
Stockoscope
Blog
Deep dives on the 5D Framework, investment strategies, platform guides, and case studies on individual companies. Independent analysis, sourced from the same database that powers the platform.
Featured
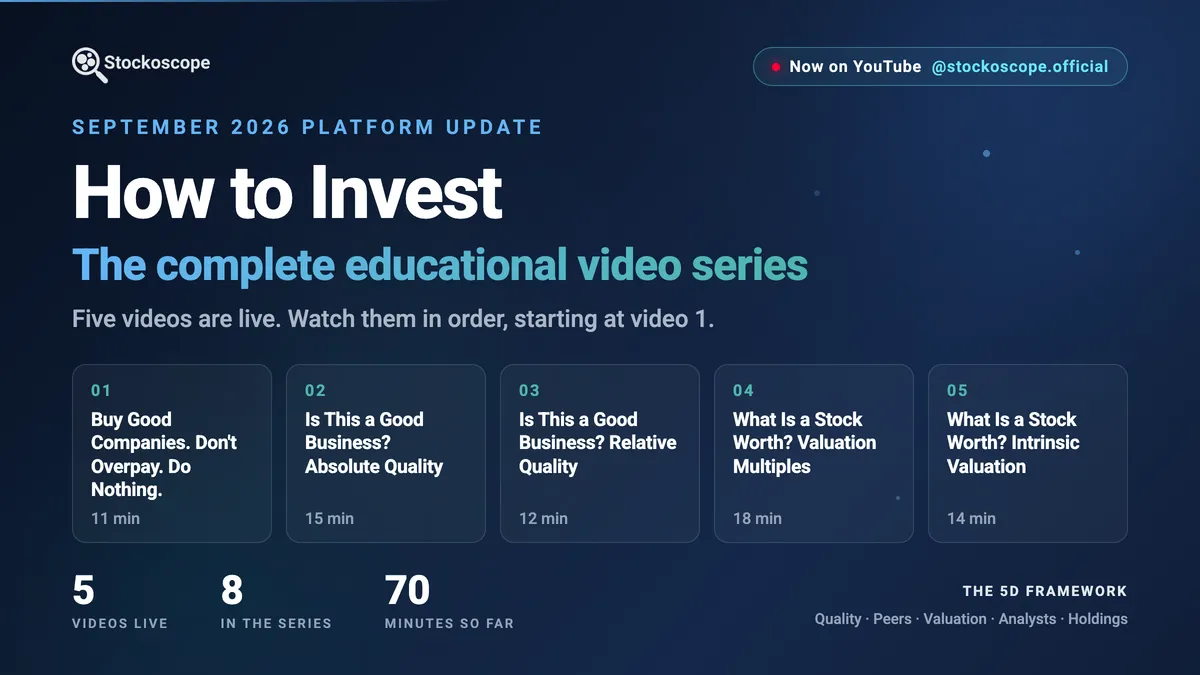
September 2026: How to Invest: The Complete Educational Video Series
Five videos of our How to Invest series are now up: the method, what makes a company good, how to compare it with its peers, and both ways to work out what a stock is worth. Free to watch, no sign-up. Plus what changed on the platform in August.
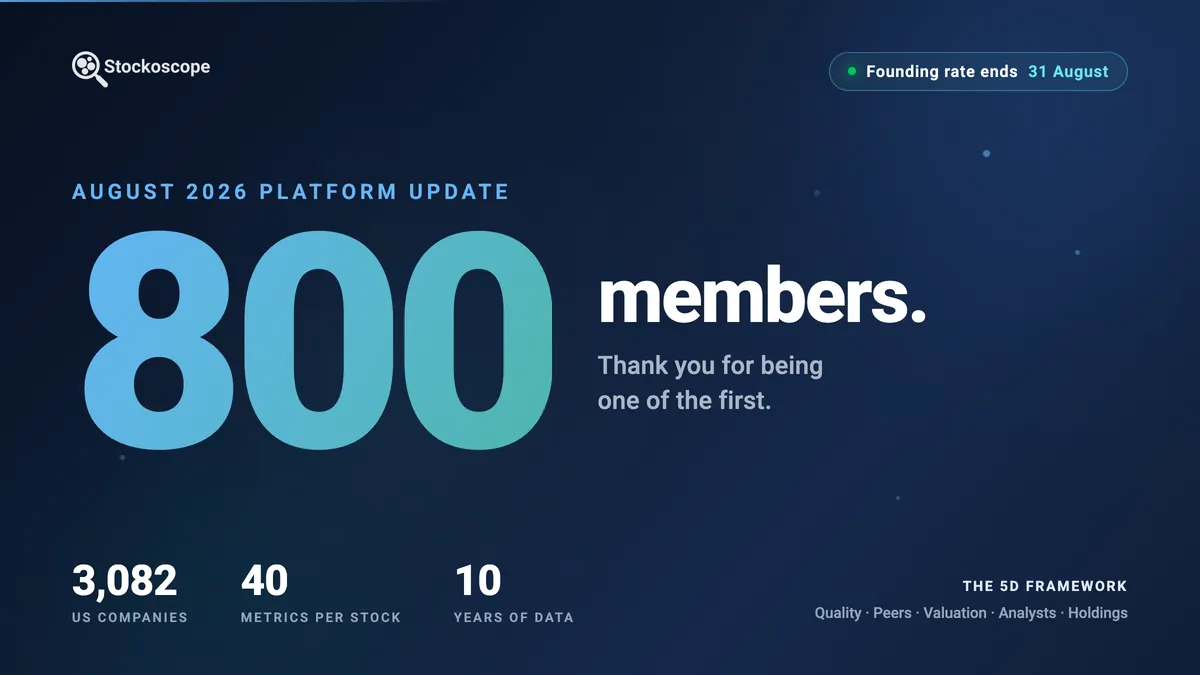
August 2026: 800 Members, and a New Way to See the Market
Stockoscope just passed 800 members. July was our first full month live: the Screener gained the Map, a new way to plot any two metrics against each other, and the Valuation page now shows every method of valuing a stock on one chart.
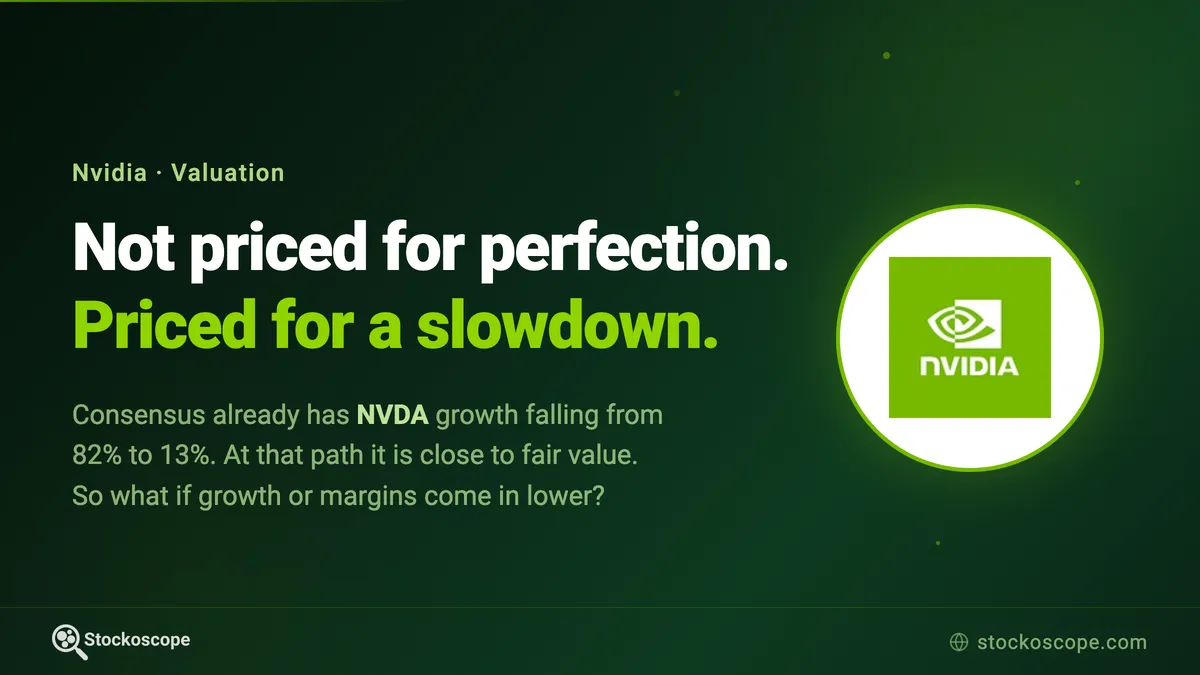
Nvidia Is Not Priced for Perfection. It's Priced for a Slowdown.
"Priced for perfection" is the phrase everyone reaches for with Nvidia. The numbers say otherwise. Analyst consensus already has growth falling from 82% to 13% within four years, and on that path our model puts the stock close to fair value. The real question is what happens if growth or margins come in below what the Street already expects.
5D Framework
6 posts
Valuation Analysis: Estimating a Company's Intrinsic Value
Quality business at wrong price destroys returns. Systematic valuation combines discounted cash flow models with market multiples to reveal whether current prices reflect fundamental value.
Holdings Analysis: Following Smart Money
Talk is cheap. Watch what informed investors actually do with their capital. Insider buying, institutional flows, and fund participation reveal conviction that analyst ratings cannot capture.
Analyst Sentiment: Reading Professional Expectations
Wall Street analysts spend careers studying companies and industries. Their estimates, price targets, and ratings reveal forward expectations that historical data cannot capture.
Peer Comparison: Why Context Determines Quality
A 15% return on equity means nothing without competitive context. Peer analysis reveals whether performance represents excellence or mediocrity.
Business Quality Analysis: The Foundation of the 5D Framework
Why some companies generate consistent returns across decades while others struggle through cycles, revealed through systematic quality analysis.
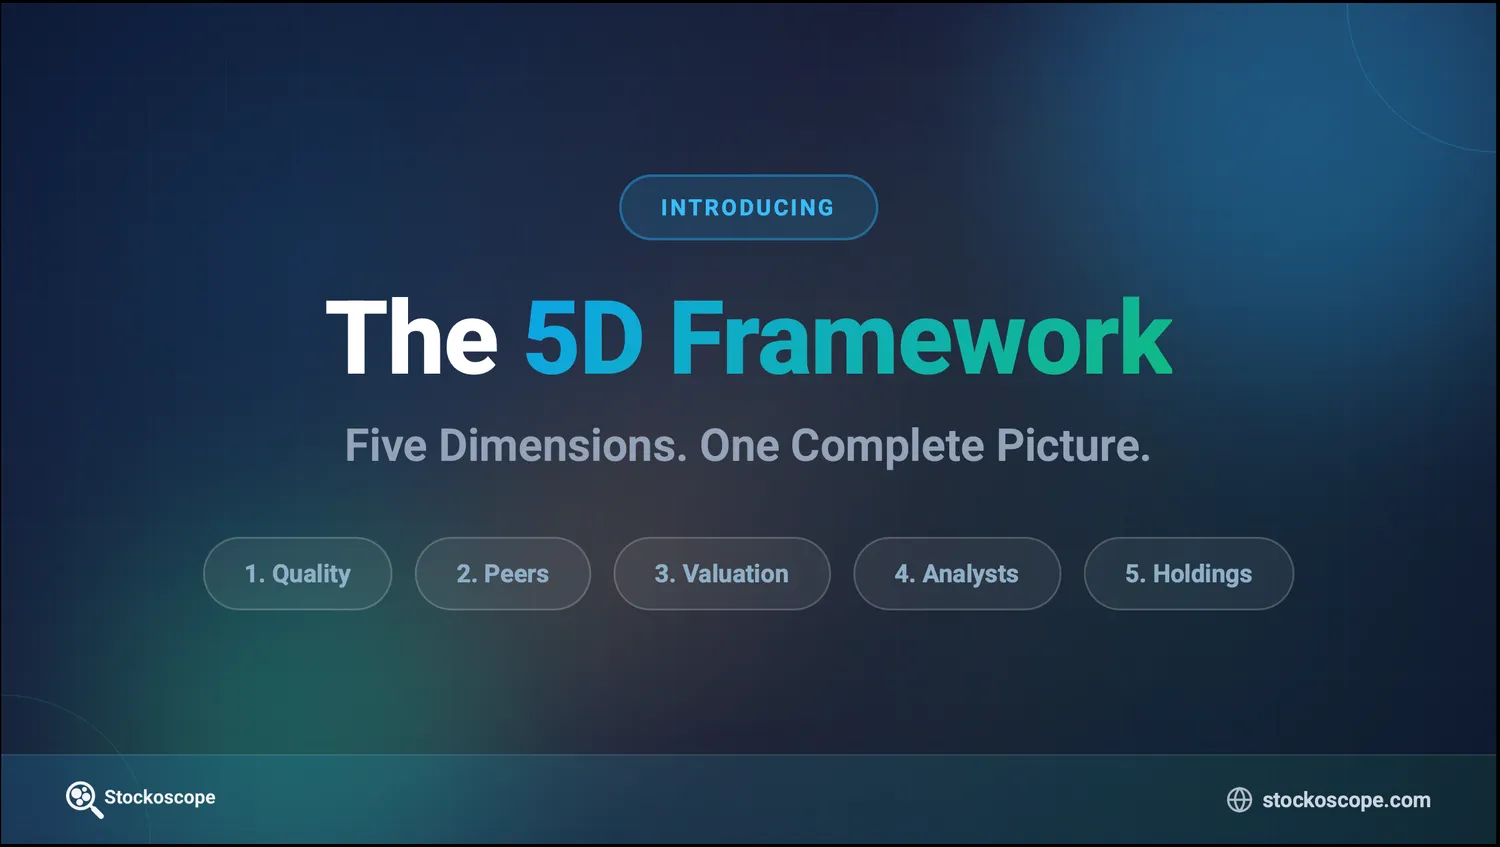
The 5D Framework: A Complete System for Stock Analysis
Our integrated methodology that examines companies from five complementary angles.
Investment Strategies
4 posts
7 Questions Before You Trust a Dividend
A dividend is a promise, not a fact, and companies break it. These seven questions test whether a payment will survive the next bad year, with a real example of each one going wrong.
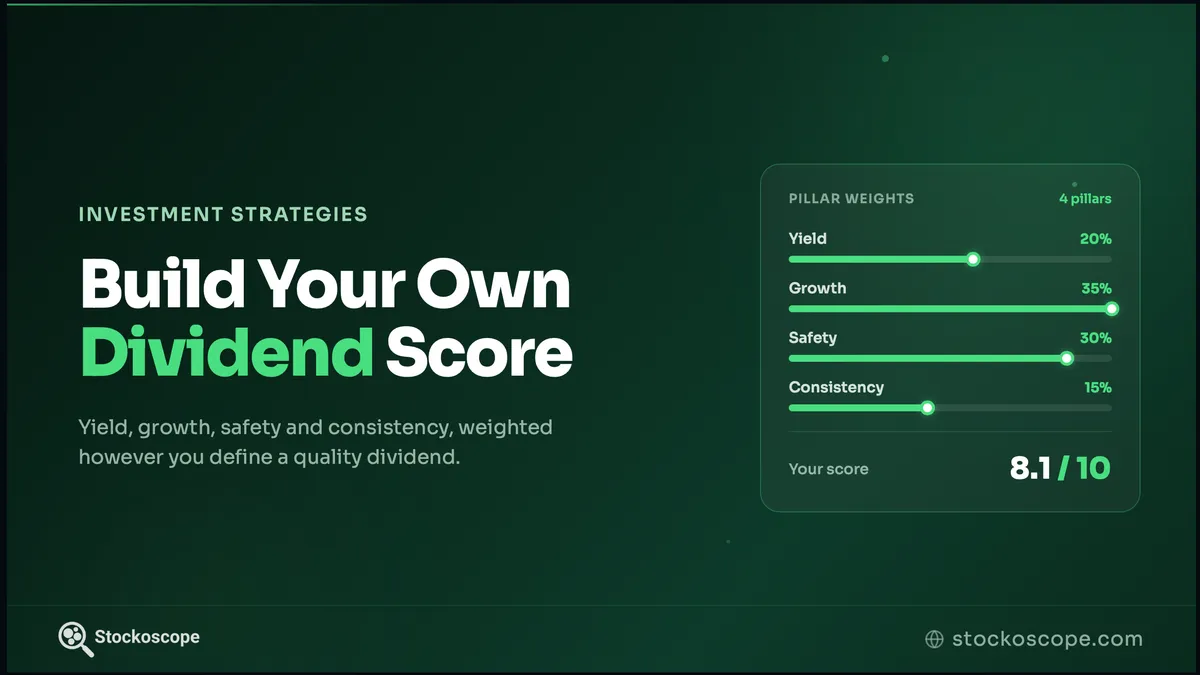
Build Your Own Dividend Score: 4 Pillars Every Income Investor Should Know
A transparent 100-point dividend score that weighs not just what a company pays today, but whether it can sustain and grow those payments - run on the Strategies page with every pillar weight under your control.
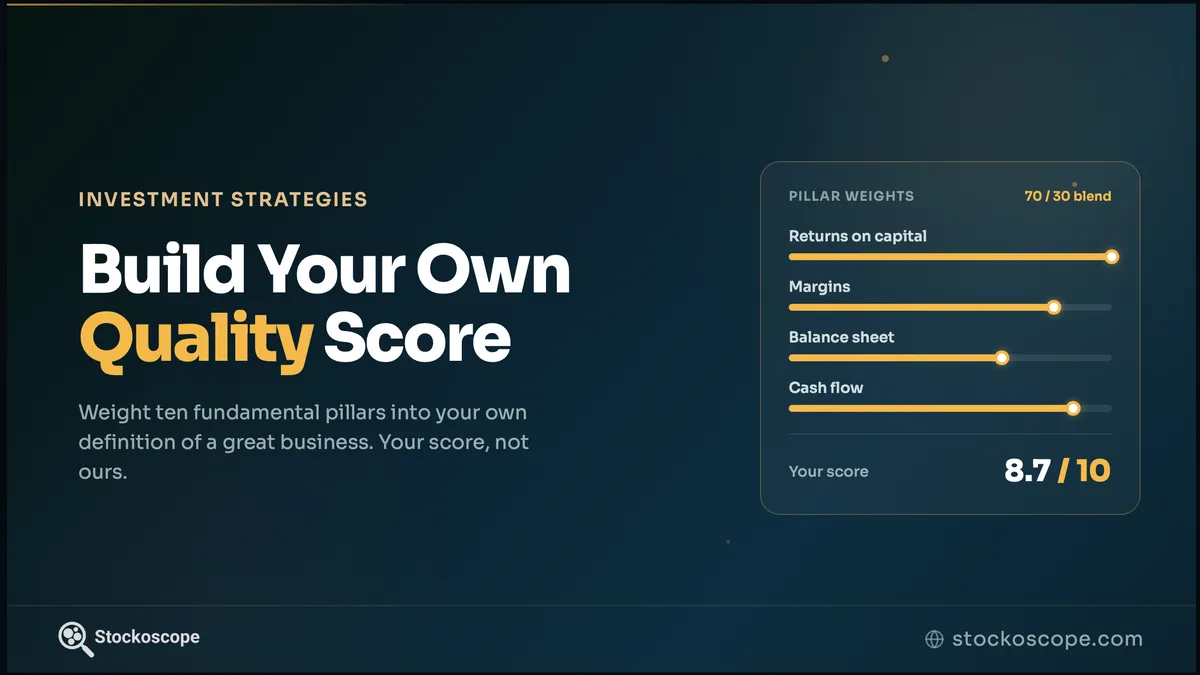
Beyond Gut Feelings: Build Your Own Quality Score
What business quality actually means, the traps to avoid, and how to weight the 10 quality pillars into your own score on the Strategies page - your definition of quality, not ours.
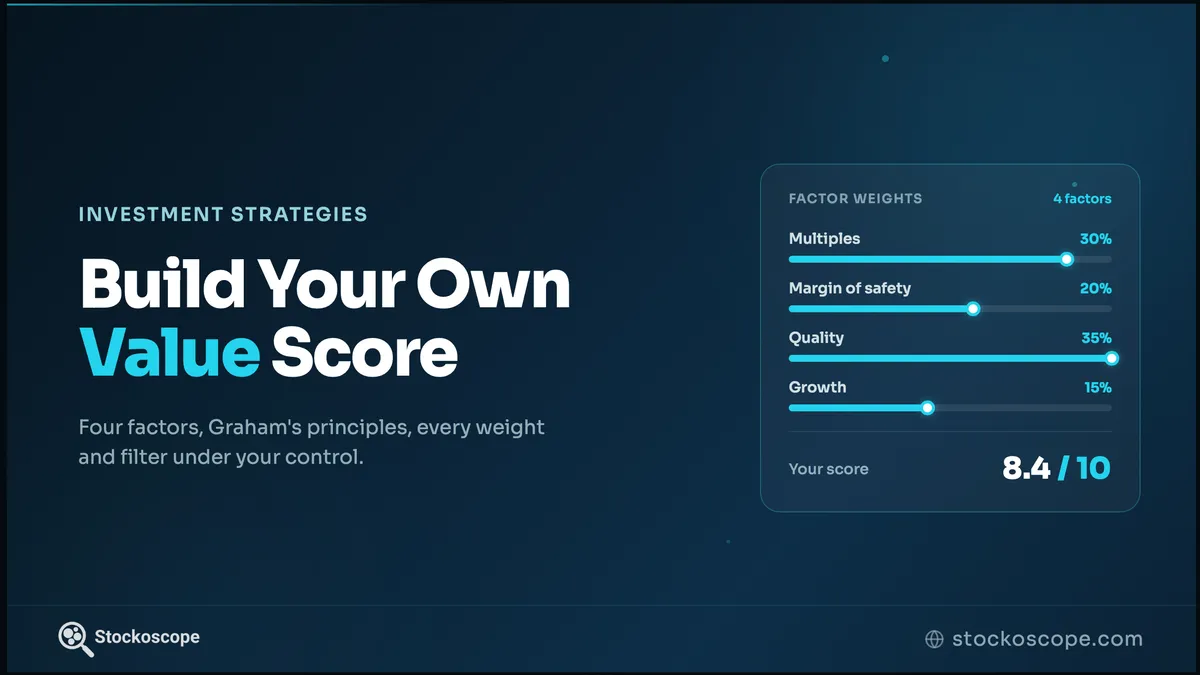
Build Your Own Value Score, Grounded in Graham's Principles
A transparent 100-point value score built on Benjamin Graham's principles, run on the Strategies page with every component weight and filter under your control.
Platform Guides
9 posts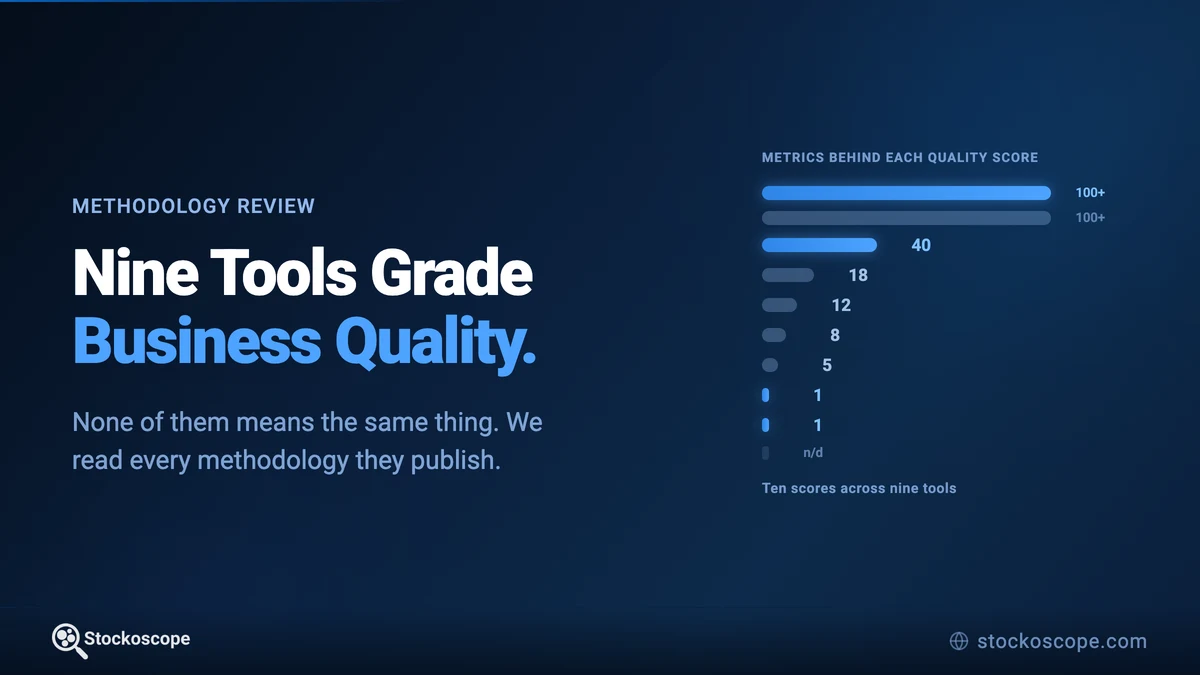
Nine Tools Grade Business Quality. None of Them Means the Same Thing.
One tool scores quality on a single metric. Another says it uses over a hundred. Five of the nine put the share price inside the score. We read every published methodology to find out what these numbers actually measure.
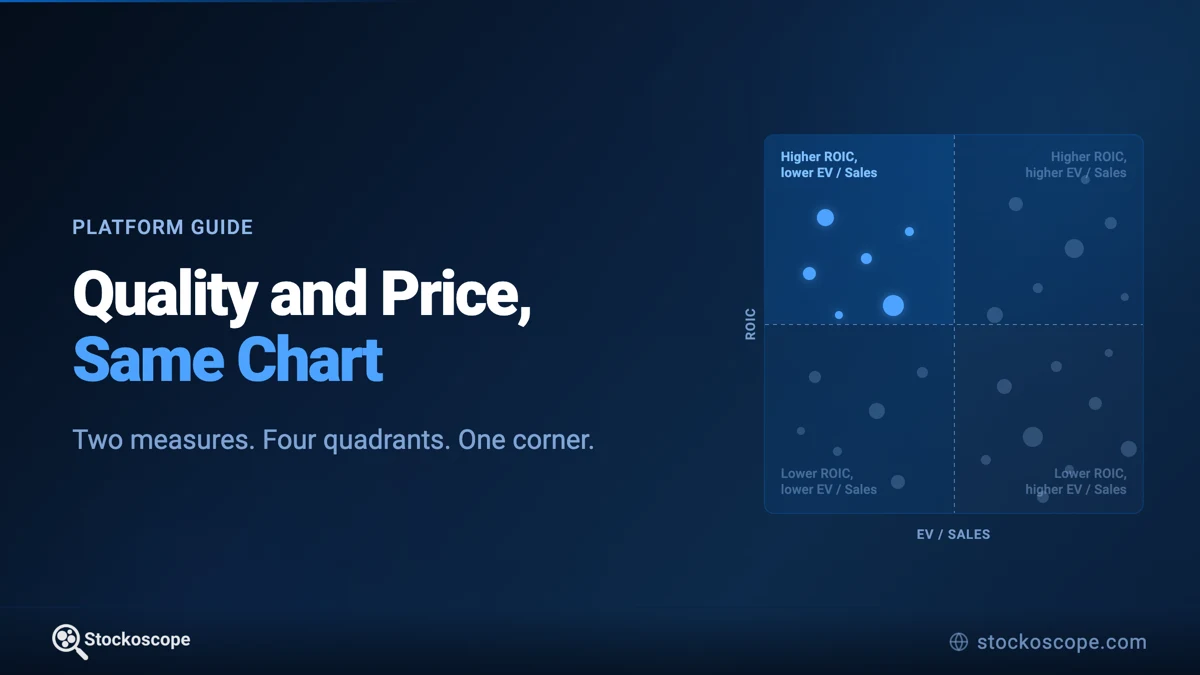
The Map: See Quality and Price at the Same Time
Screeners answer one question at a time, so you read the quality list, then the valuation list, and try to find the overlap from memory. The Map puts both on one chart and turns that overlap into a place you can point at.
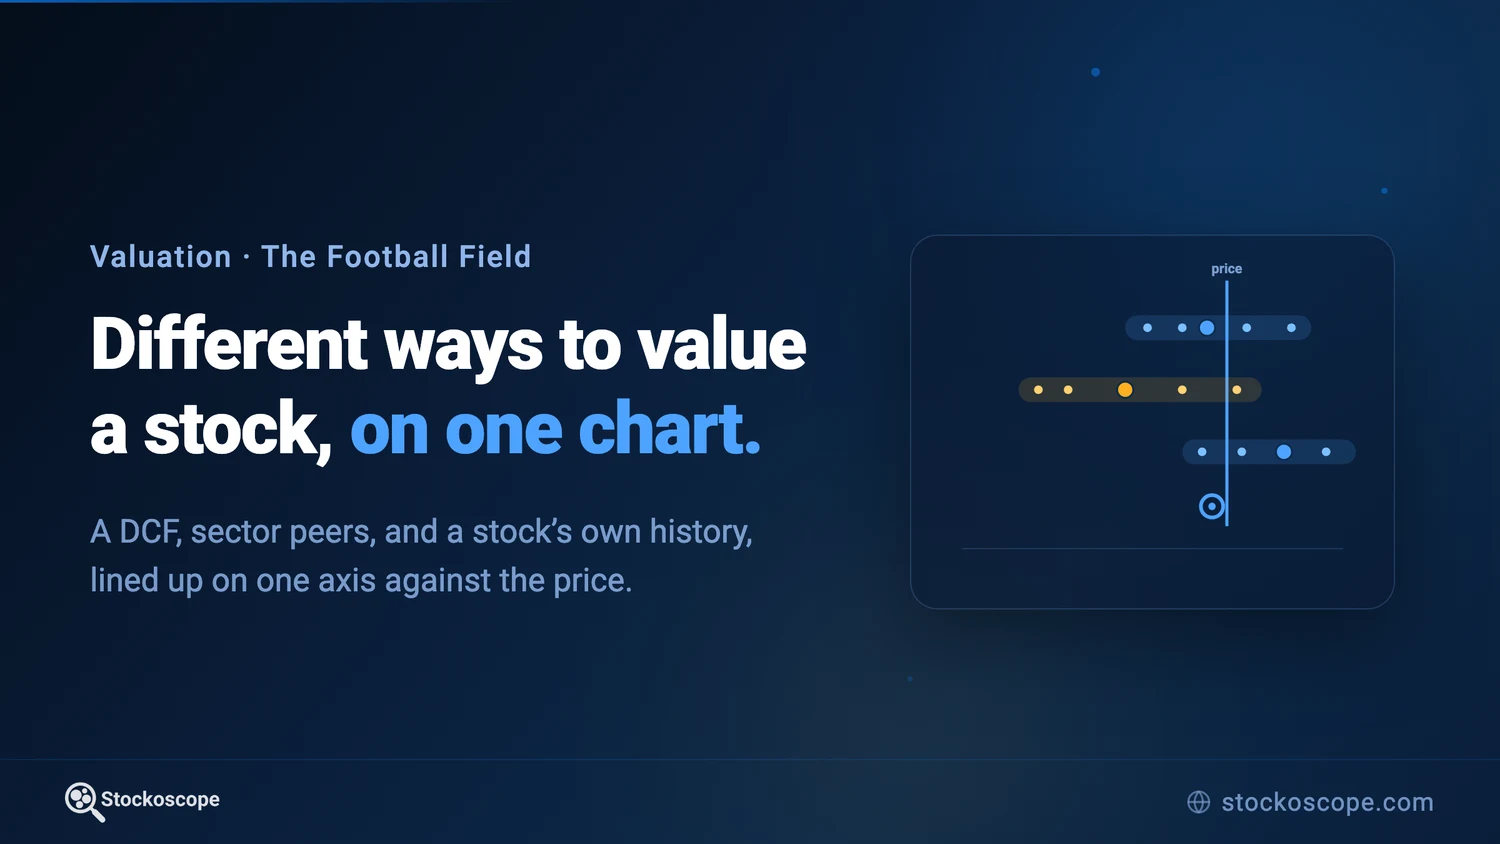
The Valuation Football Field: Different Ways to Value a Stock on One Chart
Valuing a stock two different ways, with a cash flow model and with market multiples, leaves you holding a dozen or more separate estimates. Here is how we turn multiples into plain dollar values and put every estimate on one chart, so you can see where they agree, where they disagree, and how far today's price sits from each.

The Capex Switch: How We Model AI Capital Spending in a DCF
Capital spending at the AI hyperscalers has exploded, and for a heavy reinvestor the long-run capex assumption can move a DCF more than everything else combined. Here is the problem that creates, how our model handles it, and the one switch that lets you set the assumption yourself.
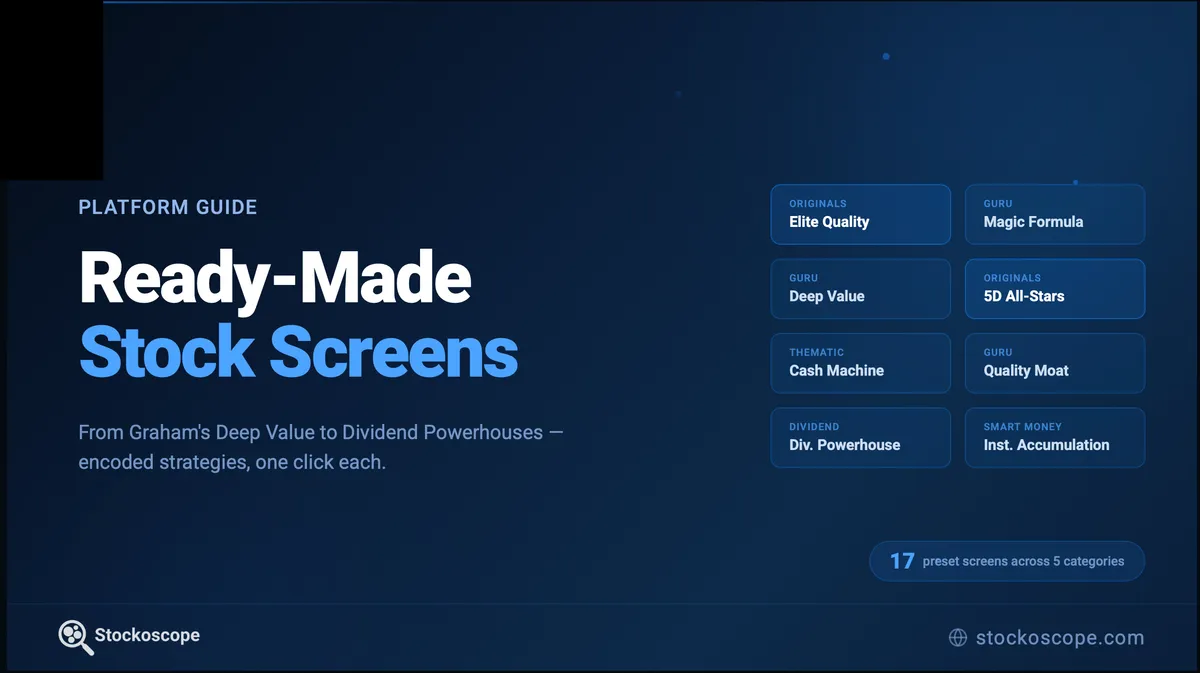
17 Ready-Made Stock Screens: From Graham's Deep Value to Dividend Growth
Skip the filter setup. Our preset screens encode ready-made strategies from Greenblatt, Lynch, Graham, and Buffett - plus proprietary screens that leverage all five dimensions of our analysis framework.
Building a Professional-Grade DCF Valuation Engine for Retail Investors
How we built a transparent, interactive DCF valuation engine using analyst consensus growth, FMP market data, and exponential growth tapering.
Reading the Money Map: How to Analyze Any Company's Profit Flow
Learn to read Sankey diagrams and instantly spot business quality through revenue-to-profit flow patterns. Compare Microsoft, Netflix, and Costco's fundamentally different economics.
10 Essential Questions Every Investor Should Ask Before Buying a Stock
A simple framework for evaluating company fundamentals before you invest. Ask these 10 questions to make decisions based on business quality, not market sentiment.
A Stock Screener Where Quality Companies Literally Rise to the Top
How we combined D3 force simulations with financial data to create a screening experience that mirrors real market dynamics.
Market Analysis
12 posts
Reddit Beat Alphabet and Meta on Our Peer Screen
Our peer screen ranks every company against others its own size in its own sector. In US large-cap Communication Services it put Reddit first, ahead of Alphabet, Meta and Netflix. We went through the numbers pillar by pillar to see where that lead is real, where it is not, and what the screen leaves out.
Nike's revenue stopped falling. Is a recovery in sight?
The freefall in Nike's revenue has stopped, but cash generation kept sliding and the dividend is no longer covered. Does Wall Street see more pain ahead, or a turn? The consensus is clearer than you'd think.
Nvidia Is Not Priced for Perfection. It's Priced for a Slowdown.
"Priced for perfection" is the phrase everyone reaches for with Nvidia. The numbers say otherwise. Analyst consensus already has growth falling from 82% to 13% within four years, and on that path our model puts the stock close to fair value. The real question is what happens if growth or margins come in below what the Street already expects.

Oracle Update: The OpenAI Risk Faded, the Debt Risk Became a Downgrade
Four months after our Oracle case study, the stock is back where it started, but a lot has changed underneath. Analysts turned bullish and OpenAI got funded, yet S&P cut Oracle to one notch above junk. We reran the DCF to see what the price is really assuming.

The AI-Capex Bet in Reverse: What Microsoft, Meta and Alphabet's Prices Already Assume
Our capex posts flagged the cost of the AI build-out but did not put a number on the return. So we ran the model backwards: hold each price fixed and solve for the growth, or the margin, that makes the company fairly valued. Alphabet has to beat consensus. Microsoft has room to spare.

Alphabet's Capex Doubled, Its Free Cash Flow Didn't: A Fresh Look at Google's Valuation
We warned that the AI capex super-cycle would pressure hyperscaler valuations, and Microsoft proved it: we called MSFT overvalued at $490 and it fell about 35%. Google spends as heavily as any of them, so here we put Alphabet's own valuation under the same capex lens.

Meta's Capex Bet: One Number Decides Whether It's Cheap or Expensive
In March we said Meta was fairly valued at $623 and warned that capex was the single biggest swing factor in the call. The stock is now around $583, down about 26% from its peak, and that one assumption has become the whole story: our model says about $659 if Meta's capex normalizes, and about $331 if it stays elevated.
Microsoft and Capex: How One DCF Assumption Drives the Whole Valuation
For a heavy reinvestor, the long-run capex assumption can swing a DCF more than everything else combined. Using Microsoft as a live example, here is how that single lever moves the modeled value across a wide range, and where the market sits within it.
S&P 500 Tech Stocks Down 20%+ Where Insiders Are Buying
We screened S&P 500 tech names down at least 20% over the past year where insiders have been net buyers, then layered in institutional share accumulation and options sentiment to see where smart money is actually positioned.
10 Stocks Analysts Expect to Rise the Most and What the Data Really Shows
We screened the S&P 500 for stocks where 100% of analyst price targets exceed the current price. Then we applied our full Analyst Sentiment framework to see if the optimism holds up.
Why Tech Stocks Lost $1 Trillion Despite Beating Earnings
Technology stocks experienced their worst selloff since April 2025. Software stocks alone lost approximately $1 trillion in market value. The companies beat earnings. So what happened?
Understanding Michael Burry's Nvidia Short: A Deep Dive Using Microsoft's Numbers
When a $4 trillion company issues a formal rebuttal to a short seller, you know something serious is happening.
Case Studies
20 posts
CLEAR Secure: A 42% Fall That Started on a Beat
CLEAR Secure beat on revenue, bookings, margins and cash flow, touched a 52-week high intraday, and closed the day flat. Six weeks later it was down 42% from that high. The 5D Framework separates what actually changed from what did not.
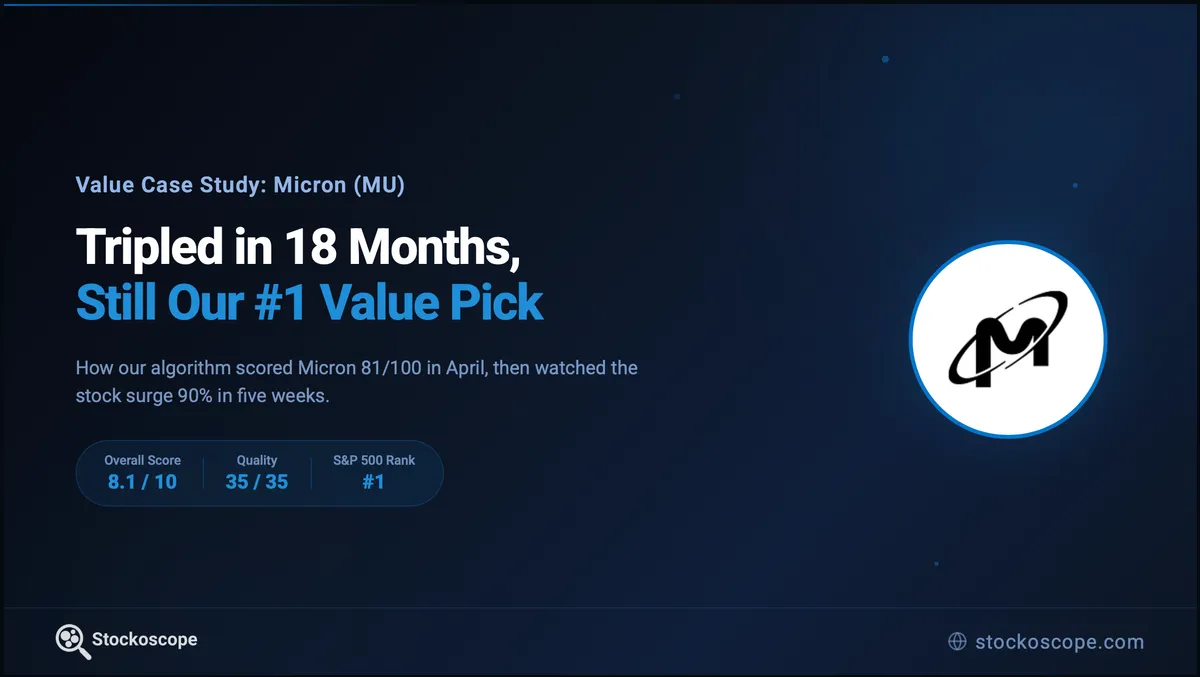
Micron: A Cyclical Value Lesson From $50 to $366
Micron scored highest on the value lens in the S&P 500 for April, even after tripling. This is what happens when earnings outrun price in a cyclical business.
Four Fallen Stocks at ~80% Off: A 5D Comparison
Duolingo, Hims & Hers, Nike, and PayPal are all down 75-80% from their highs. We applied the 5D Framework to all four to see what the data says about each drawdown.
Oracle's $553 Billion Bet: AI Infrastructure Goldmine or Balance Sheet Time Bomb?
Oracle is down 60% from its peak with $162 billion in debt, negative free cash flow, and securities fraud lawsuits. But it also has a $553 billion backlog and 44% cloud revenue growth. The 5D Framework separates the noise from the signal.

ServiceNow at Half Price: What Five Dimensions of Data Show Behind the AI Panic
ServiceNow stock has fallen 50% from its highs as AI disruption fears collide with 21% revenue growth and $4.6B in free cash flow. The 5D Framework examines where the five dimensions agree and where they diverge.
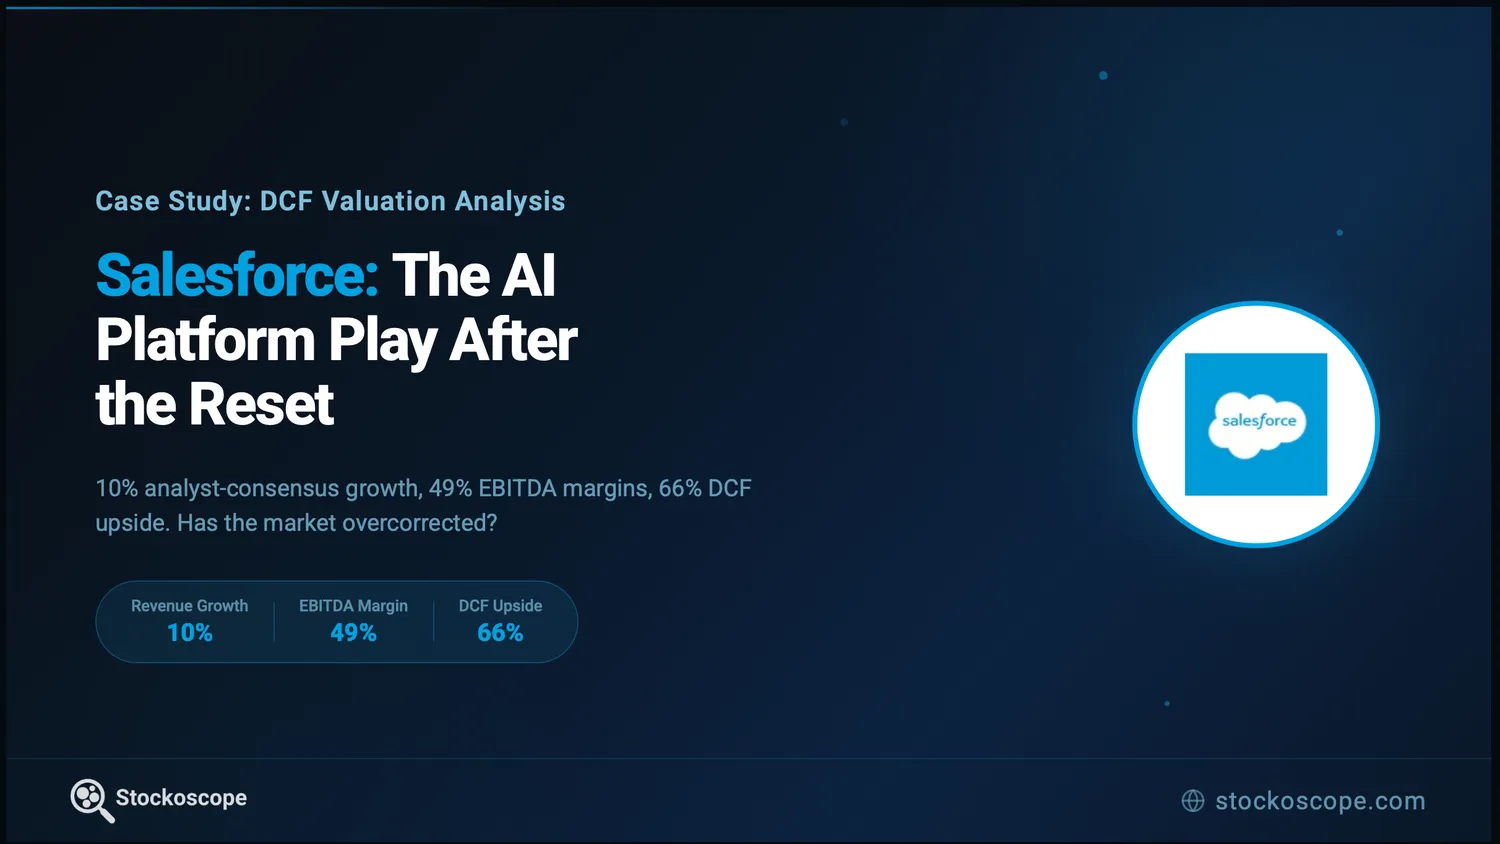
The AI Platform Play: Salesforce's Valuation After the Reset
Salesforce has pulled back sharply from its highs despite accelerating AI-driven growth. We conduct a full DCF and multiples valuation to estimate where $195 sits relative to intrinsic value.
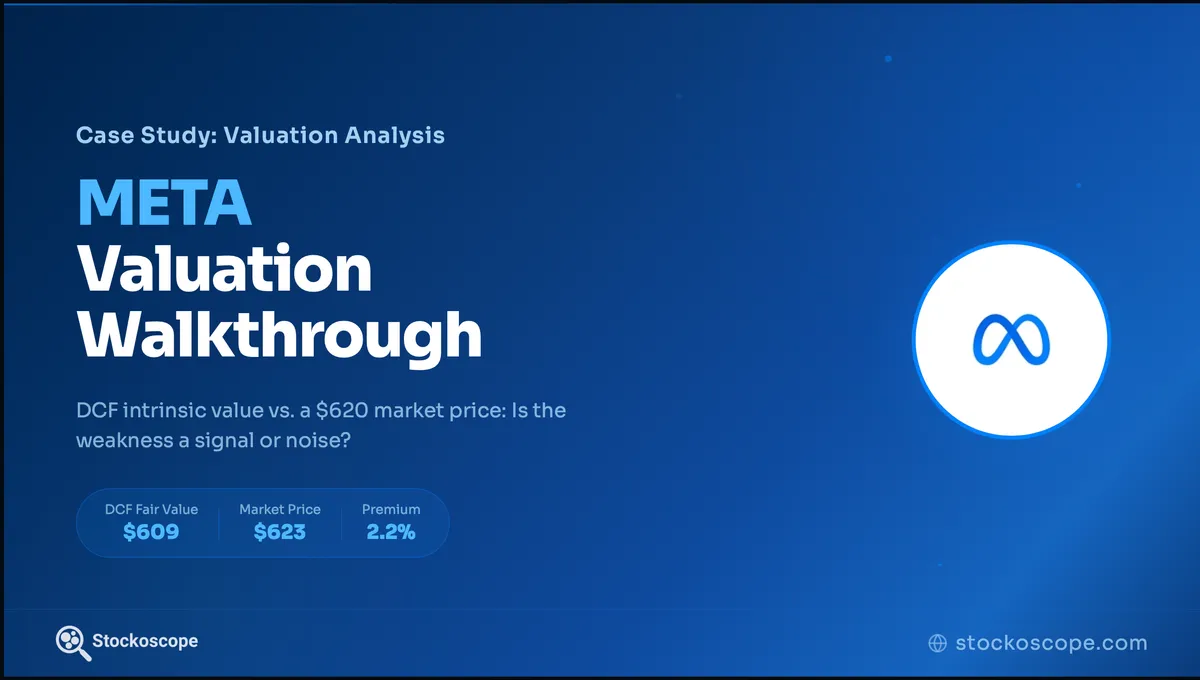
Pricing the AI Arms Race: META's Valuation at $623
Meta Platforms is investing tens of billions in AI infrastructure while growing revenue at 22%. We conduct a full DCF and multiples valuation to estimate where $623 sits relative to intrinsic value.
Paycom: When a Self-Disrupting Innovation Breaks the Growth Story
Paycom built a product so effective that it cannibalized its own revenue. Trading at a fraction of historical multiples with minimal debt and 39% EBITDA margins, the 5D Framework reveals whether the market has overcorrected or correctly repriced a decelerating business.
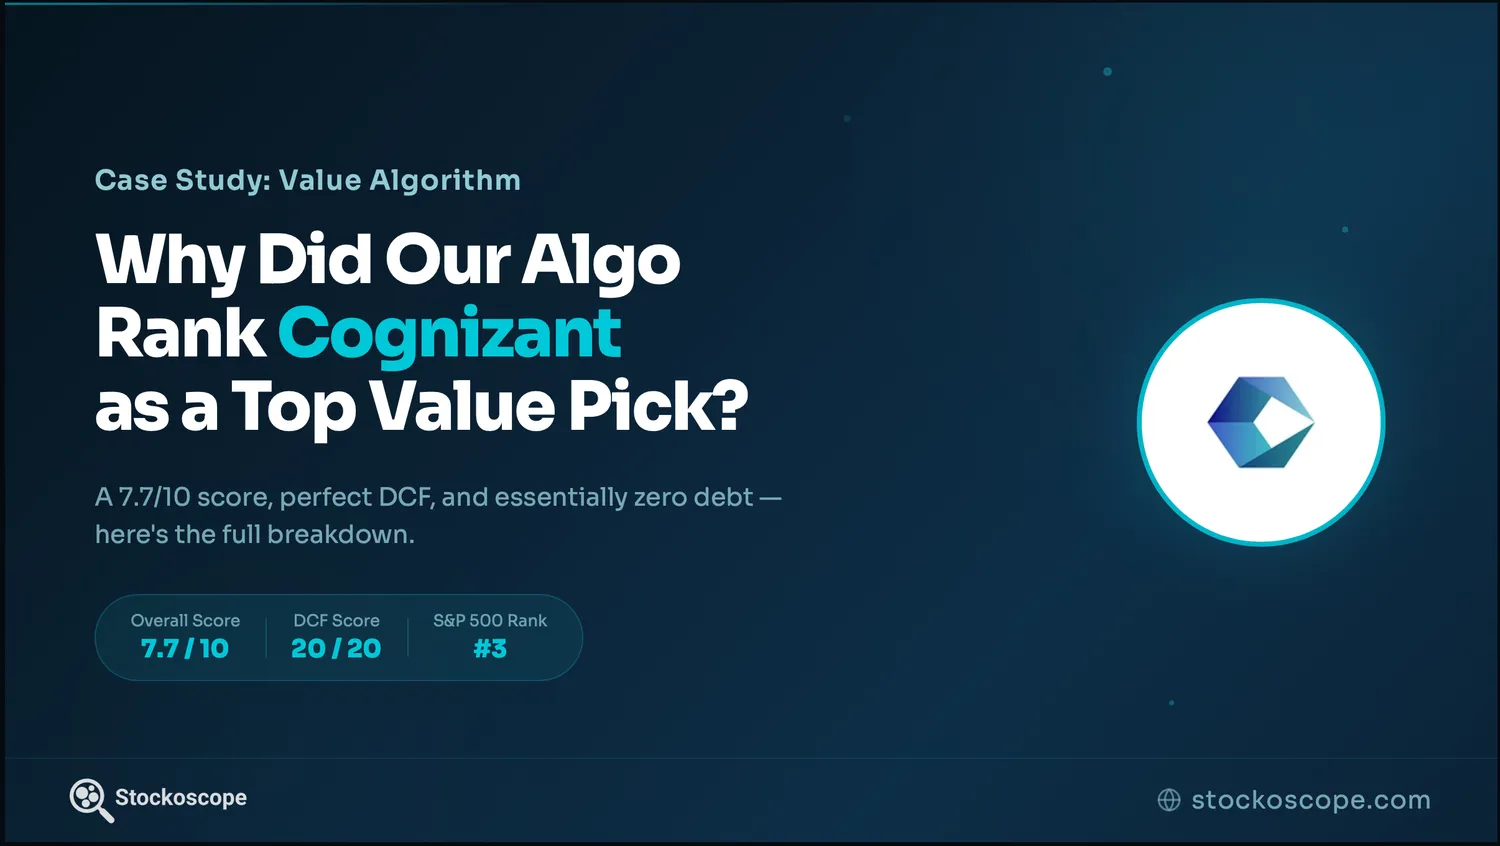
Cognizant Through the Value Lens: An IT Services Breakdown
Every month, we run our model across every S&P 500 stock and score them on valuation, DCF, quality, and growth. This month, CTSH scored third on the value lens. Here is why that is interesting.
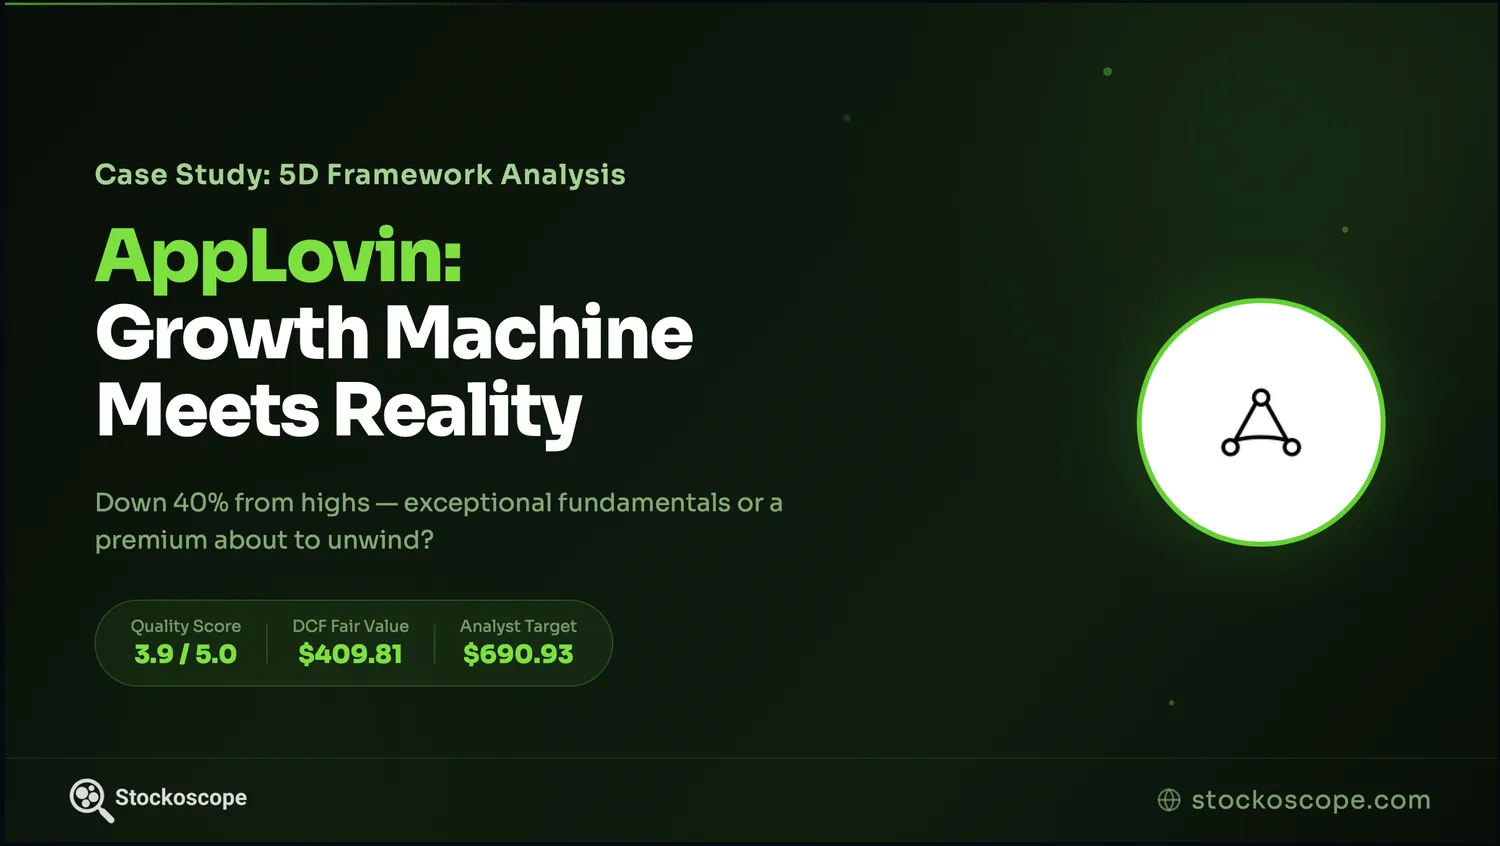
AppLovin: When a Growth Machine Meets Market Reality
AppLovin sits at the intersection of exceptional business performance and mounting investor anxiety. We analyse it through our 5D Framework to decode what smart money is really thinking.
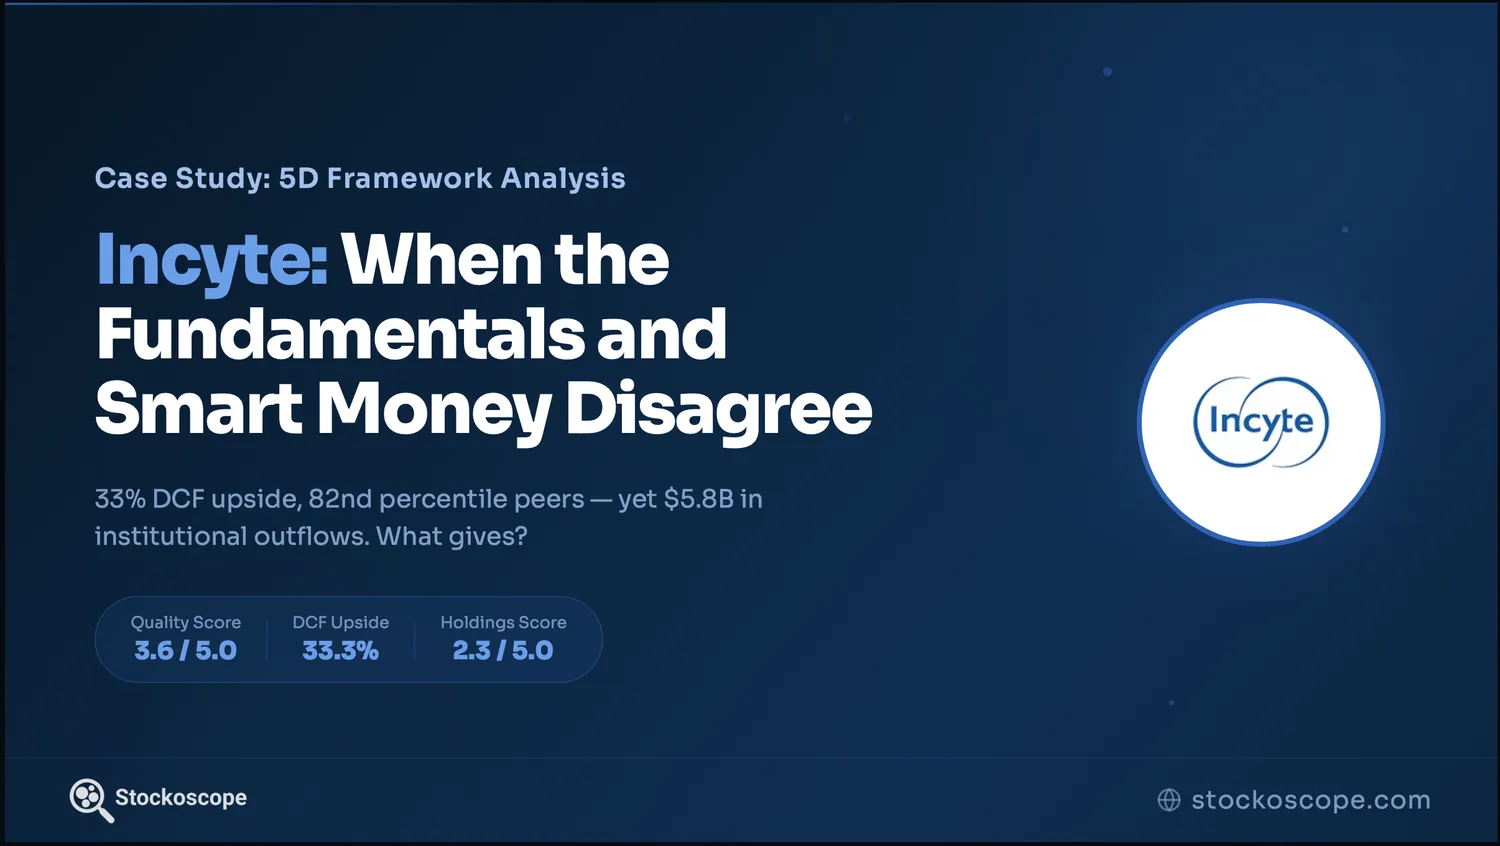
Incyte: When the Fundamentals and the Smart Money Disagree
Incyte Corporation presents a fascinating puzzle: exceptional financial performance, strong peer positioning, and DCF upside, yet $5.8 billion in institutional outflows. We examine all five dimensions to find out what's really going on.
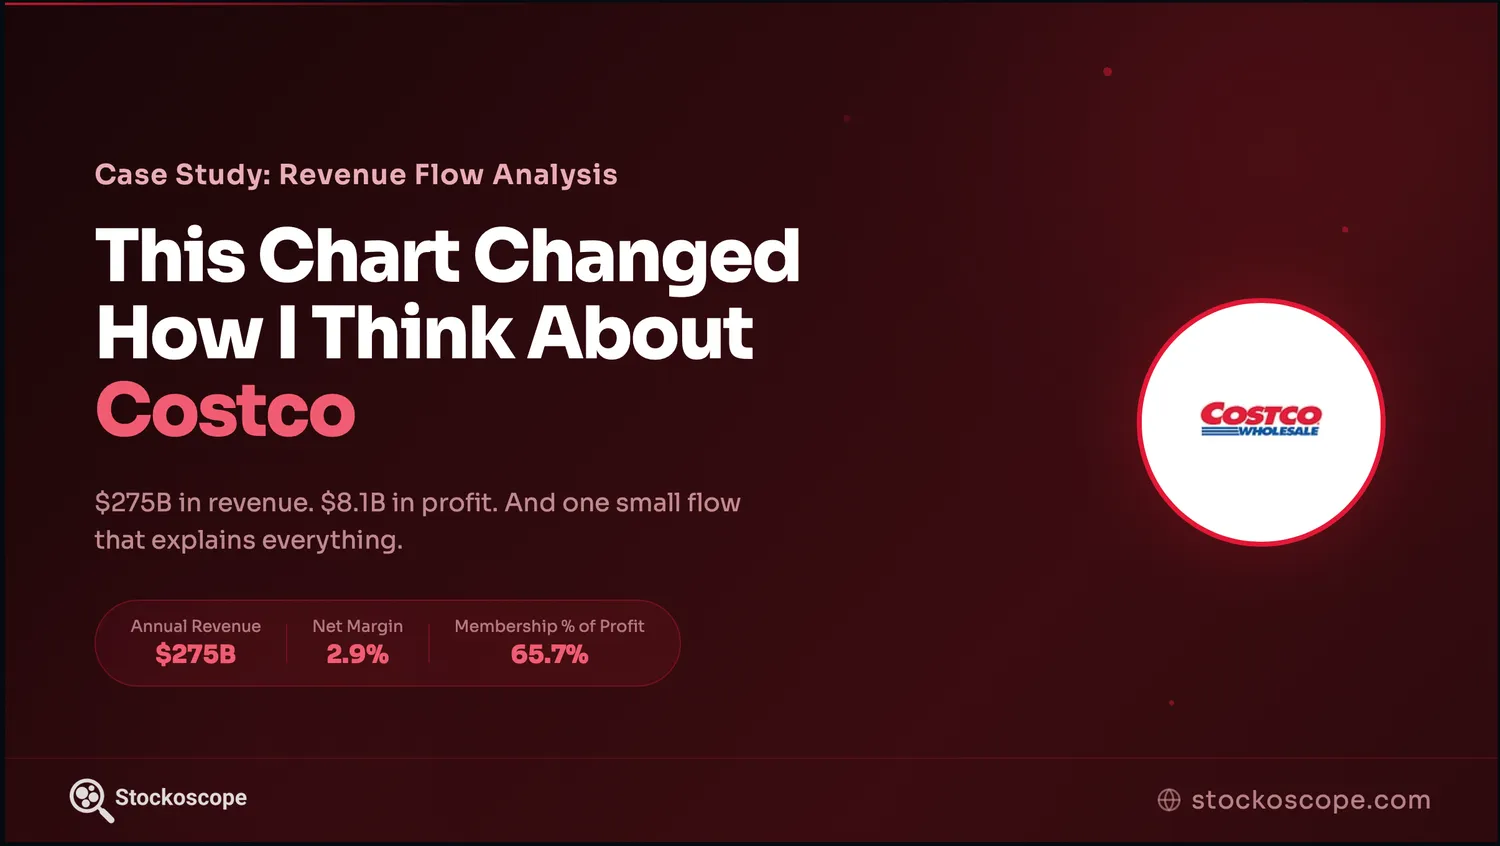
This Chart Changed How I Think About Costco
Costco makes $275 billion in annual revenue. But it's not until you see where that money actually goes that the real business model becomes impossible to miss.
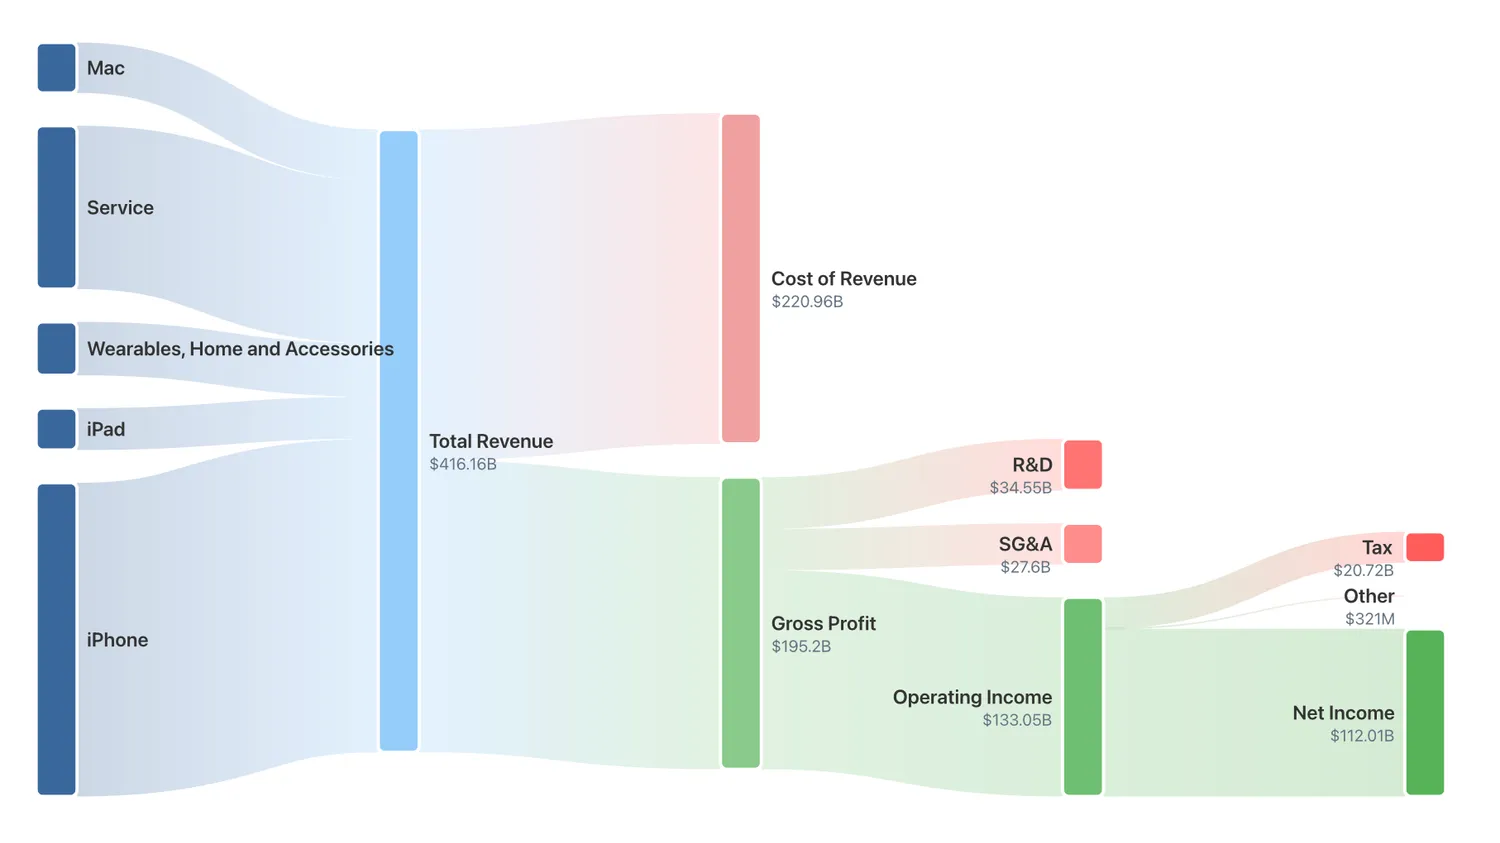
The River of Money: How Apple's Revenue Flows to the Bottom Line
Apple made $112 billion in profit last year. But most people never see the journey that $416 billion in revenue takes as it flows through the business. We built a visualization to trace every dollar.
Microsoft Case Study: The 10-Question Framework in Action
How a company scores 4.0/5.0 using our systematic approach. A walkthrough of Microsoft's fundamentals across all 10 questions: where it excels, where it falls short, and what the numbers reveal.
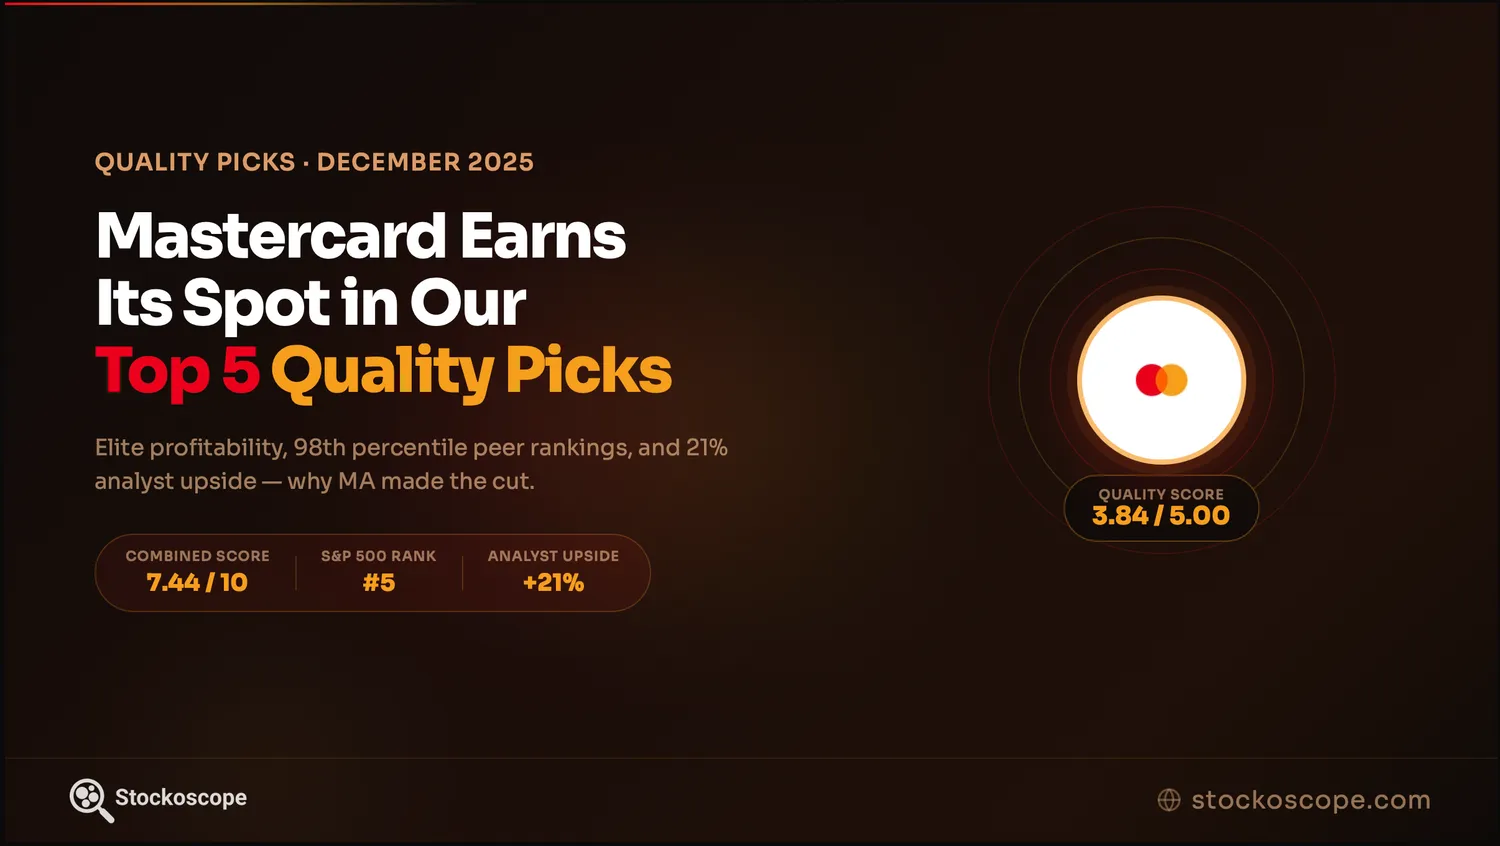
Mastercard Through the Quality Lens: A December Breakdown
How strong profitability and peer rankings drove MA's quality score in December 2025, the second time it scored this high since our quality algorithm launched in August 2025.
Fiserv Through the Value Lens: A Breakdown After a 75% Crash
Broken Business or Bargain of the Decade?
The Case for Lululemon: Finding Quality in the Wreckage of a 67% Collapse
When a high-quality business sees its valuation multiple compressed by 62%, is it time to be greedy when others are fearful?
Separating Value Stocks from Value Traps: Lessons from REGN's Earnings Beat
A data-driven approach to separating durable value stocks from value traps.
QUALCOMM Through the Dividend Lens: Why a 2.09% Yield Scored Highly
A semiconductor company scored highest on our systematic dividend lens for October. Here's what that reveals about finding quality in unexpected places.
The Crossover Signal: When Quality Stocks Become Value Opportunities
How our dual-algorithm approach identified Adobe at the intersection of business excellence and market mispricing.
Updates
3 postsSeptember 2026: How to Invest: The Complete Educational Video Series
Five videos of our How to Invest series are now up: the method, what makes a company good, how to compare it with its peers, and both ways to work out what a stock is worth. Free to watch, no sign-up. Plus what changed on the platform in August.
August 2026: 800 Members, and a New Way to See the Market
Stockoscope just passed 800 members. July was our first full month live: the Screener gained the Map, a new way to plot any two metrics against each other, and the Valuation page now shows every method of valuing a stock on one chart.

Stockoscope is Live for Everyone
After a year of beta, the full Stockoscope platform is live: the 5D Framework, a visual Screener, and Strategies you build yourself across more than 3,000 US stocks. Founding Member pricing is locked for three years through August 31.