
Incyte: When the Fundamentals and the Smart Money Disagree
Incyte Corporation presents a fascinating puzzle: exceptional financial performance, strong peer positioning, and DCF upside, yet $5.8 billion in institutional outflows. We examine all five dimensions to find out what's really going on.
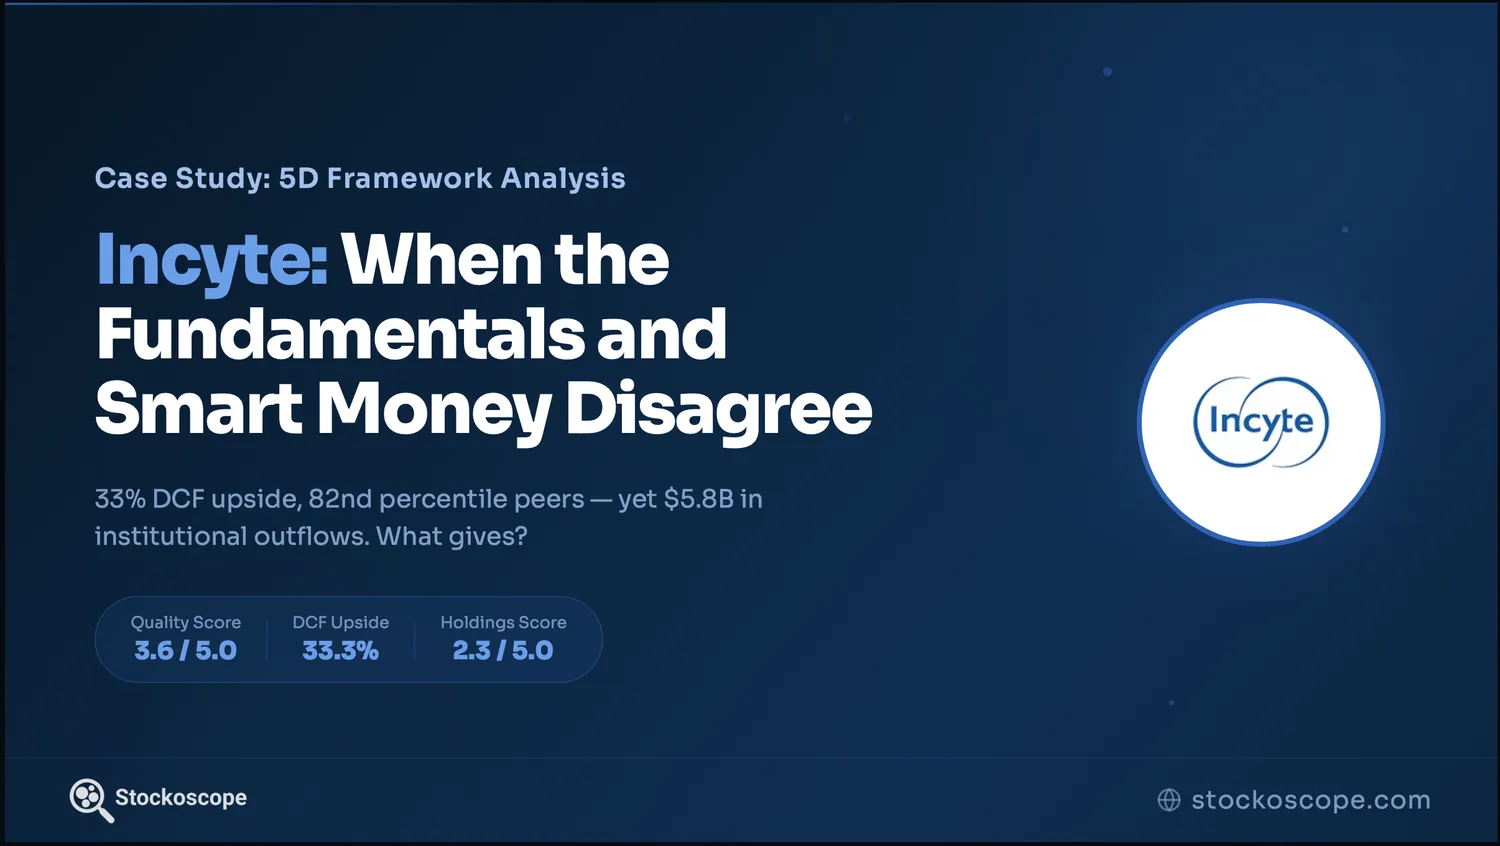
Incyte Corporation (INCY) presents a fascinating puzzle for investors. Trading at $101.16 and with a market capitalisation of around $20 billion, this biotech company has delivered extraordinary financial performance over the past year, with strong net income growth and earnings-per-share expansion. Yet beneath these impressive headline numbers lies a more nuanced story of competitive positioning, valuation tensions, and mixed signals from the investment community.
This analysis applies our 5D Framework, a systematic methodology we developed to examine companies through five complementary lenses. Throughout the week, we published five threads on INCY covering each dimension in sequence: Business Quality (Monday), Peer Comparison (Tuesday), Valuation (Wednesday), Analyst Sentiment (Thursday), and Holdings Analysis (Friday). This article consolidates those threads into a single integrated view, because each dimension answered a different question, but the real insight emerges from how they interact.
Business Fundamentals
Incyte's business quality scorecard reveals a company in transition, earning an overall rating of 3.6 out of 5 that masks significant variations across operational dimensions. Top line growth earns a 4.8 out of 5: revenue has compounded at 18.6% annually since 2016, with EBITDA, EBIT, and net income accelerating even faster at 27%, 31.1%, and 32.2%, respectively.
The company demonstrates particular strength in cash generation and liquidity management, further supported by robust liquidity ratios, with current and quick ratios above 3.0x, providing substantial financial flexibility for continued investment in research and development.
Profitability margins paint a picture of a maturing biotech operation. The company maintains an exceptional gross margin of 91.8%, reflecting the high-margin nature of successful pharmaceutical products once development costs are recovered. Operating margins of 26.4% and EBITDA margins of 34.2% demonstrate effective cost management and operational leverage, though these figures suggest room for improvement compared to the most efficient pharmaceutical operations.
However, several areas reveal underlying challenges. Asset utilisation metrics show inefficiencies, with asset turnover of 0.74x indicating the company generates less than one dollar of revenue per dollar of assets employed. Days sales outstanding of 73 days suggests longer collection periods than optimal, though this may reflect the complex reimbursement landscape in specialty pharmaceuticals. These operational efficiency gaps suggest management opportunities to enhance returns on invested capital as the business scales.
The quality assessment also reveals balance sheet conservatism that may constrain growth. While minimal debt provides financial stability, the company's reluctance to employ leverage may limit its ability to fund acquisitions or accelerate development programs compared to more aggressive competitors.
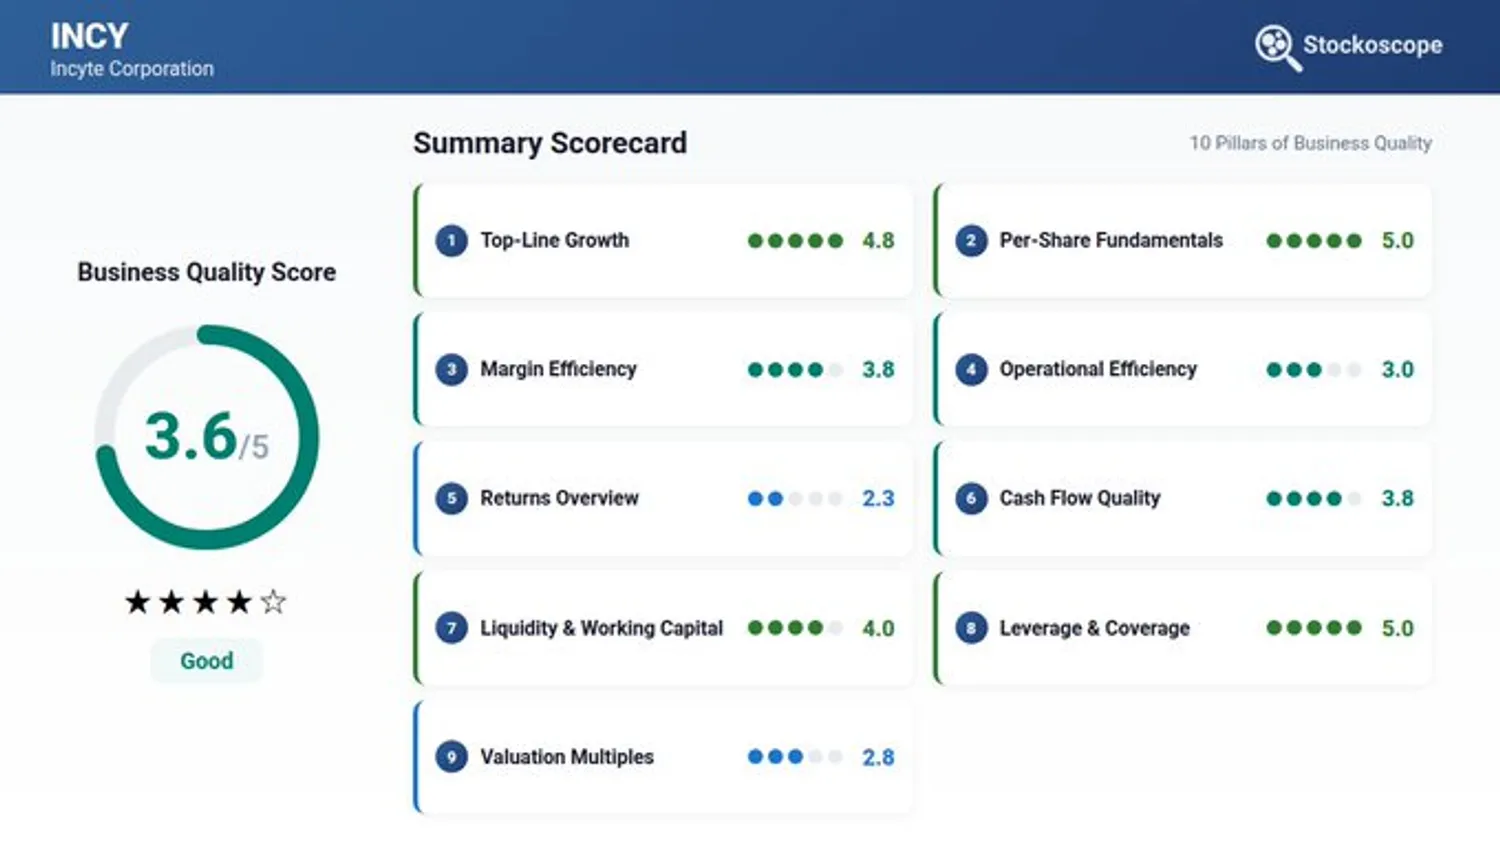 Figure 1. Incyte earns a 3.6/5.0 investment quality score. Exceptional growth and margins are offset by operational efficiency gaps. Full breakdown on our Quality Analysis page.
Peer Comparison
Within the healthcare sector, Incyte occupies an impressive position, ranking in the 82nd percentile among 59 S&P 500 healthcare companies with an overall peer comparison score of 4.5 out of 5. This strong relative performance stems from exceptional execution across growth and profitability dimensions, though with notable gaps in operational efficiency.
The company's growth profile stands out dramatically among healthcare peers. Revenue growth of 21.2% places INCY in the 97th percentile, while EBITDA and EBIT growth rank in the 95th–97th percentiles. Profitability metrics reveal sustainable competitive advantages. The gross margin of 91.8% ranks in the 100th percentile among healthcare peers, indicating exceptional pricing power and product differentiation. The company's 26.4% operating margins place it in the 80th percentile, demonstrating effective operational leverage. These margin profiles suggest INCY operates in market niches with limited competitive pressure and strong barriers to entry.
Return on capital metrics further validate the quality of Incyte's business model relative to peers. Return on assets of 18.5% ranks in the 95th percentile, while return on invested capital of 20.8% places in the 92nd percentile. These figures indicate the company generates superior returns from its asset base compared to most healthcare companies, a critical advantage in capital-intensive pharmaceutical development.
The peer analysis also reveals areas where INCY lags competitors. Working capital turnover of 1.59x ranks in only the 25th percentile, suggesting inefficient use of operating capital compared to peers. Days sales outstanding of 73 days places in the 32nd percentile, indicating slower collection of receivables than industry standards. These operational efficiency gaps offer opportunities to further enhance the company's competitive position.
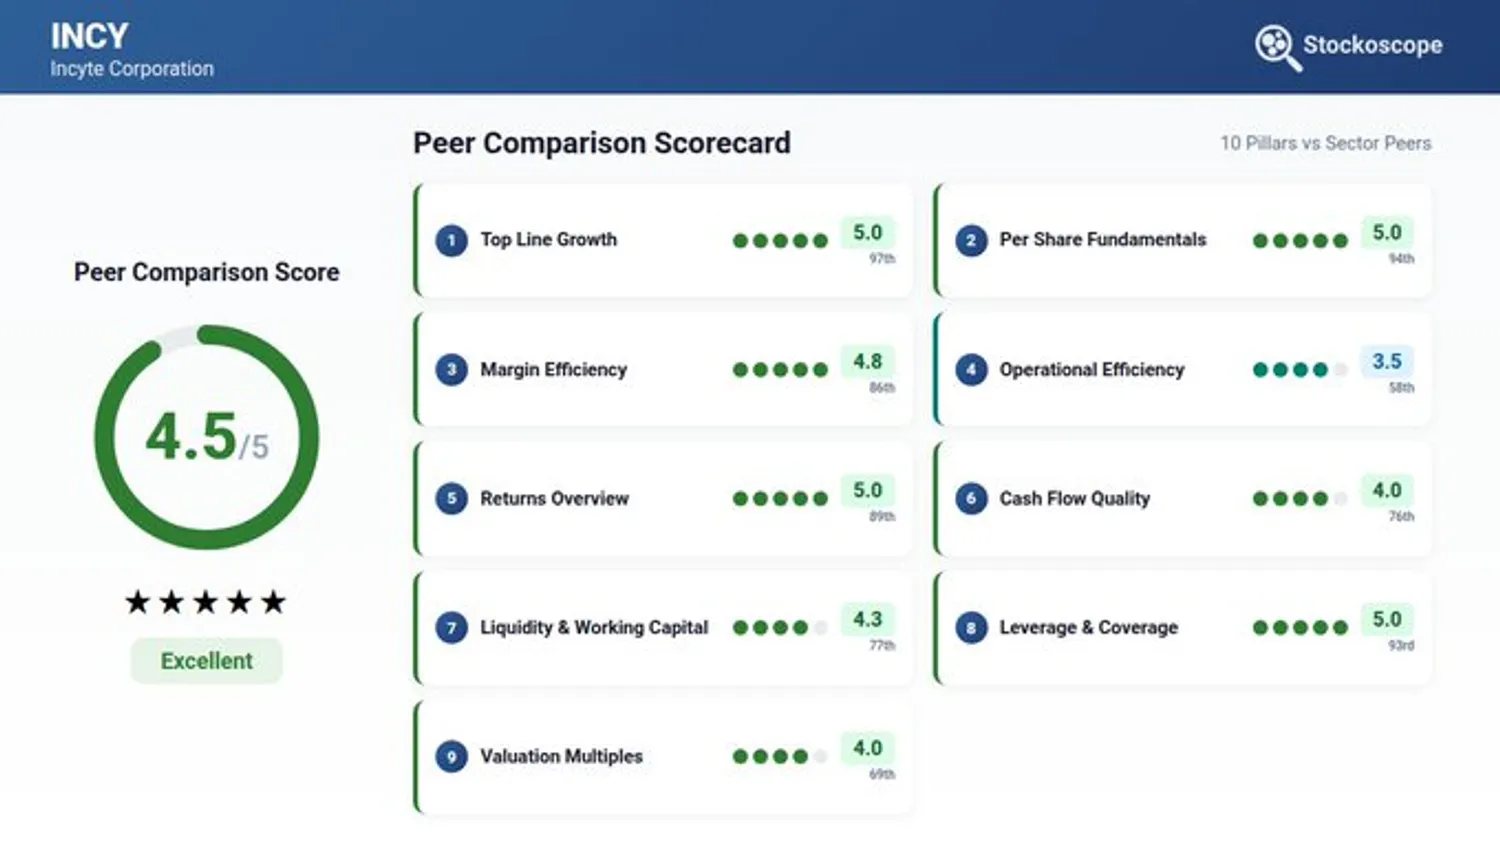 Figure 2. Incyte ranks in the 82nd percentile among 59 healthcare peers. Best-in-class margins and top-decile growth are the standout strengths, with working capital efficiency as the primary lag. Full breakdown on our Peer Comparison page.
Valuation
The valuation analysis reveals a gap between the model's intrinsic-value estimate and the market price, though this comes with assumption-dependent risks that require careful consideration. The discounted cash flow (DCF) model produces an intrinsic value of $134.80 per share compared to the current trading price of $101.16, implying 33.3% upside potential.
The DCF model rests on several key assumptions that appear reasonable given the company's recent performance trajectory. The base case projects 11.7% annual revenue growth over the first five years, tapering to 4.0% in years six through ten before settling at a 4.0% terminal growth rate. These growth assumptions reflect a maturing pharmaceutical company transitioning from rapid expansion to steady-state operations, though they may prove conservative if new product launches exceed expectations.
The discount rate of 8.5% incorporates a beta of 1.08, reflecting slightly higher volatility than the broader market while accounting for biotech sector risks. With essentially no debt in the capital structure, the weighted average cost of capital primarily reflects equity risk premiums and company-specific factors.
When examining valuation through the lens of peer multiples, our model estimates Incyte near its intrinsic-value estimate despite recent performance gains. The trailing twelve-month price-to-earnings ratio of 15.51x compares favourably with the healthcare sector median, particularly given the company's superior growth profile (and ranks in the 91st percentile compared to peers). The EV/EBITDA multiple of 9.71x also suggests reasonable pricing for a company delivering exceptional profit expansion (89th percentile).
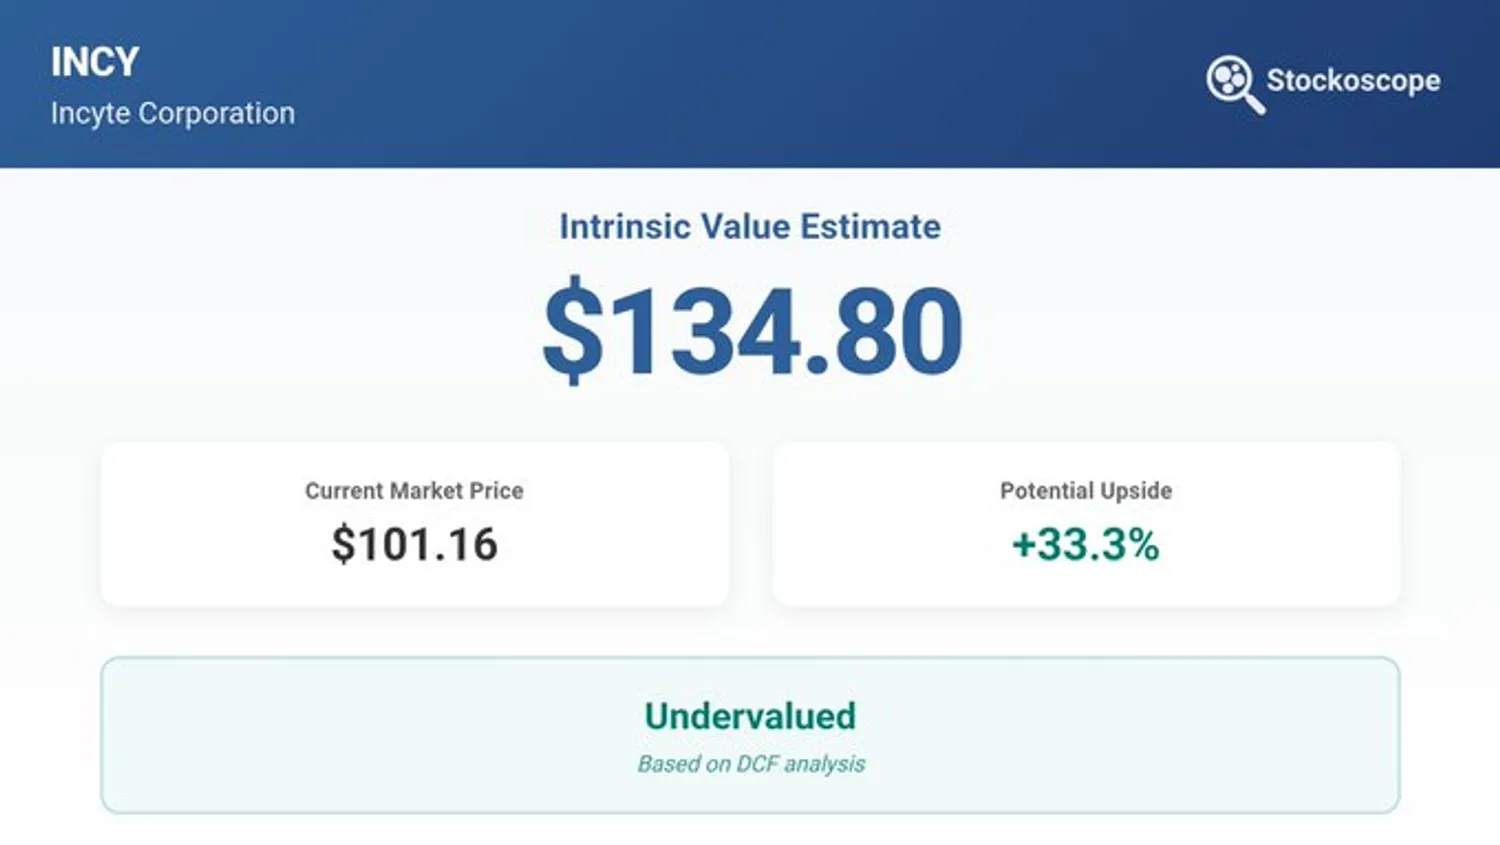 Figure 3. DCF intrinsic value of $134.80 versus current price of $101.16 implies 33.3% upside. Run your own scenarios on our Valuation Analysis page.
Analyst Sentiment
Wall Street's perspective on Incyte reflects cautious optimism tempered by awareness of biotech volatility, with analyst sentiment earning a 3.5 out of 5.0 rating. The consensus among 44 analysts covering the stock leans bullish, with 55% maintaining buy or strong buy ratings, though this moderate conviction suggests lingering uncertainty about the sustainability of recent performance gains.
Price target analysis reveals modest upside expectations from current levels. The consensus target implies 5.7% appreciation from the current price of $102.99, with a range spanning from $84.00 to $135.00. This relatively narrow upside expectation contrasts sharply with the 33.3% upside suggested by the DCF analysis, indicating either conservative analyst assumptions or scepticism about the company's ability to maintain current performance levels.
The bull case, represented by the $135 high-end target, suggests 31.1% upside potential and aligns more closely with the DCF intrinsic value calculation. This convergence implies that the most optimistic analysts share similar growth and profitability assumptions to the fundamental valuation model. Conversely, the bear-case target of $84 represents 18.4% downside risk, reflecting concerns about competitive pressures or product-cycle transitions.
Recent trends in analyst sentiment show modest improvement, with ratings trending 6 percentage points more bullish over recent months. This upgrade cycle suggests analysts are gaining confidence in the company's execution and market position, though the gradual nature of these revisions indicates measured rather than enthusiastic conviction.
Forward-looking earnings expectations provide insight into analyst growth assumptions. Projections call for revenue growth to $5.6 billion in 2026, with earnings per share reaching $7.67, expanding further to $6.2 billion in revenue and $9.34 EPS by 2027. These estimates imply continued strong growth, though at more moderate rates than the exceptional recent performance.
The company's financial health score of 4.0 out of 5.0 (A+ rating) provides analysts with confidence in management's ability to execute on growth plans. This strong fundamental foundation supports the bullish bias in consensus recommendations, even as analysts maintain realistic expectations about future performance sustainability.
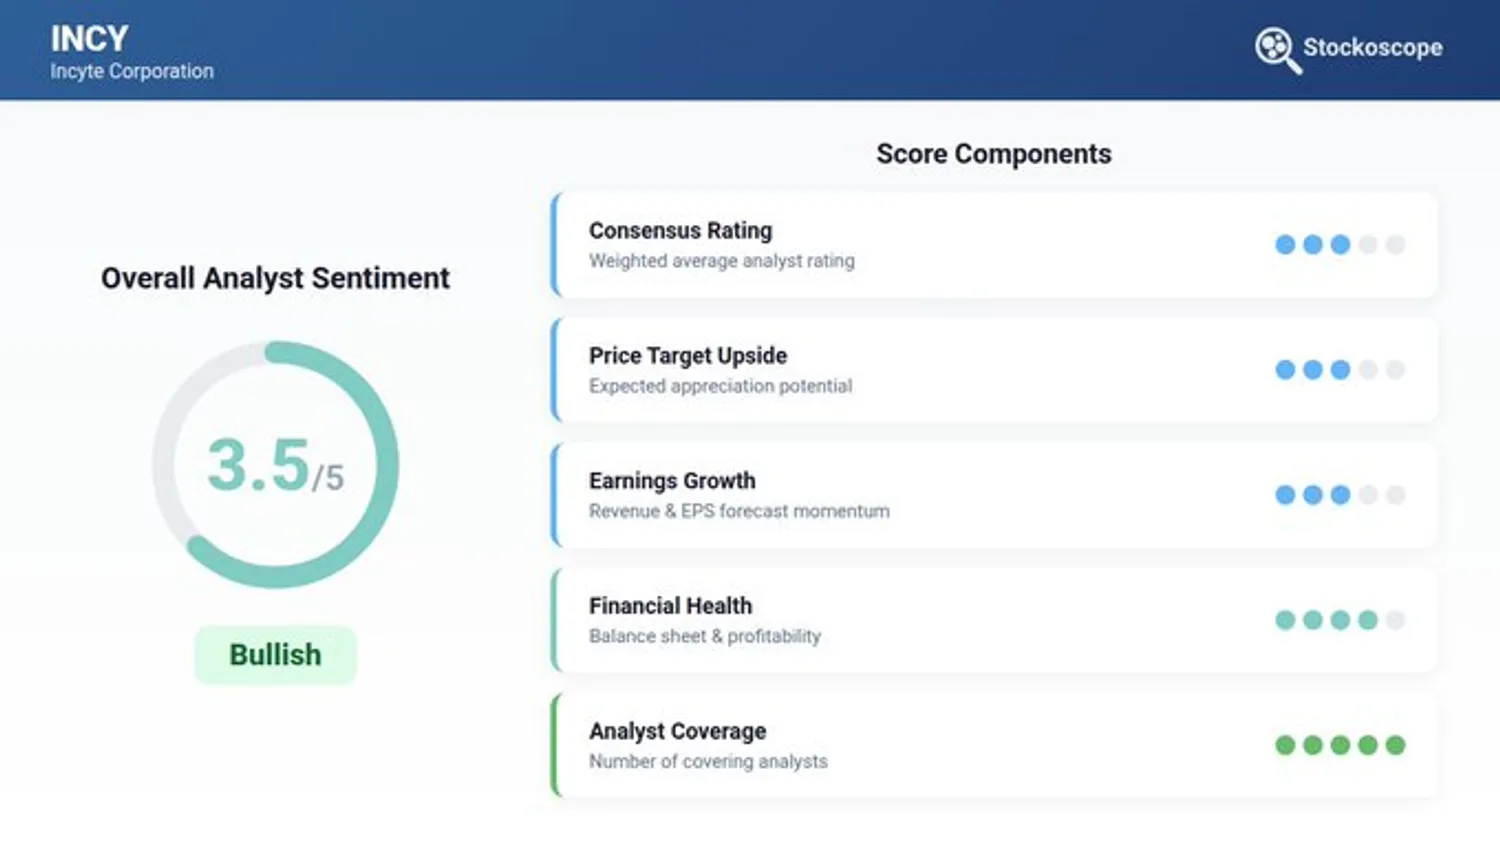 Figure 4. Incyte earns a 3.5/5.0 on analyst sentiment score. Over 50% of analysts rate INCY a Buy with a consensus target implying 5.7% upside, well below the DCF's 33.3% implied upside. Explore the full earnings estimates on our Analyst Estimates page.
Holdings Activity
Smart money activity presents a mixed but generally concerning picture, earning a holdings score of 2.3 out of 5.0 that reflects institutional caution and insider selling pressure. The most significant signal comes from massive institutional outflows totalling $5.8 billion in net selling, representing a reduction of 86.6 million shares during the quarter.
Institutional ownership patterns reveal systematic position reduction among major holders. Despite 131 new institutional positions being established, 244 existing positions were closed entirely, while 368 institutions increased holdings compared to 169 that reduced positions. This activity suggests a rotation among institutional investors rather than wholesale abandonment, though the net effect remains substantially negative for demand.
The institutional selling pressure becomes more concerning when viewed alongside insider activity patterns. Company insiders sold 35.5 thousand shares while purchasing only 94.2 thousand shares, creating an unfavourable buy-sell ratio. With 8 insider buying transactions compared to 6 sales, the modest numerical advantage in buying activity fails to offset the value-weighted selling pressure.
Mutual fund activity adds another layer of complexity to the holdings picture. While 24 new funds established positions, bringing the total to 219 funds, existing holders sold a net 2.9 million shares. This suggests fund managers are taking profits or reducing position sizes rather than adding conviction to existing holdings.
Options market activity provides the only positive signal in the holdings analysis. The put-call ratio of 0.67 indicates moderately bullish positioning, with 150.4k call options outstanding versus 101.4k puts. The disconnect between institutional selling and positive options flow creates an interesting dynamic. This divergence may reflect different investment horizons and risk tolerance levels across investor types.
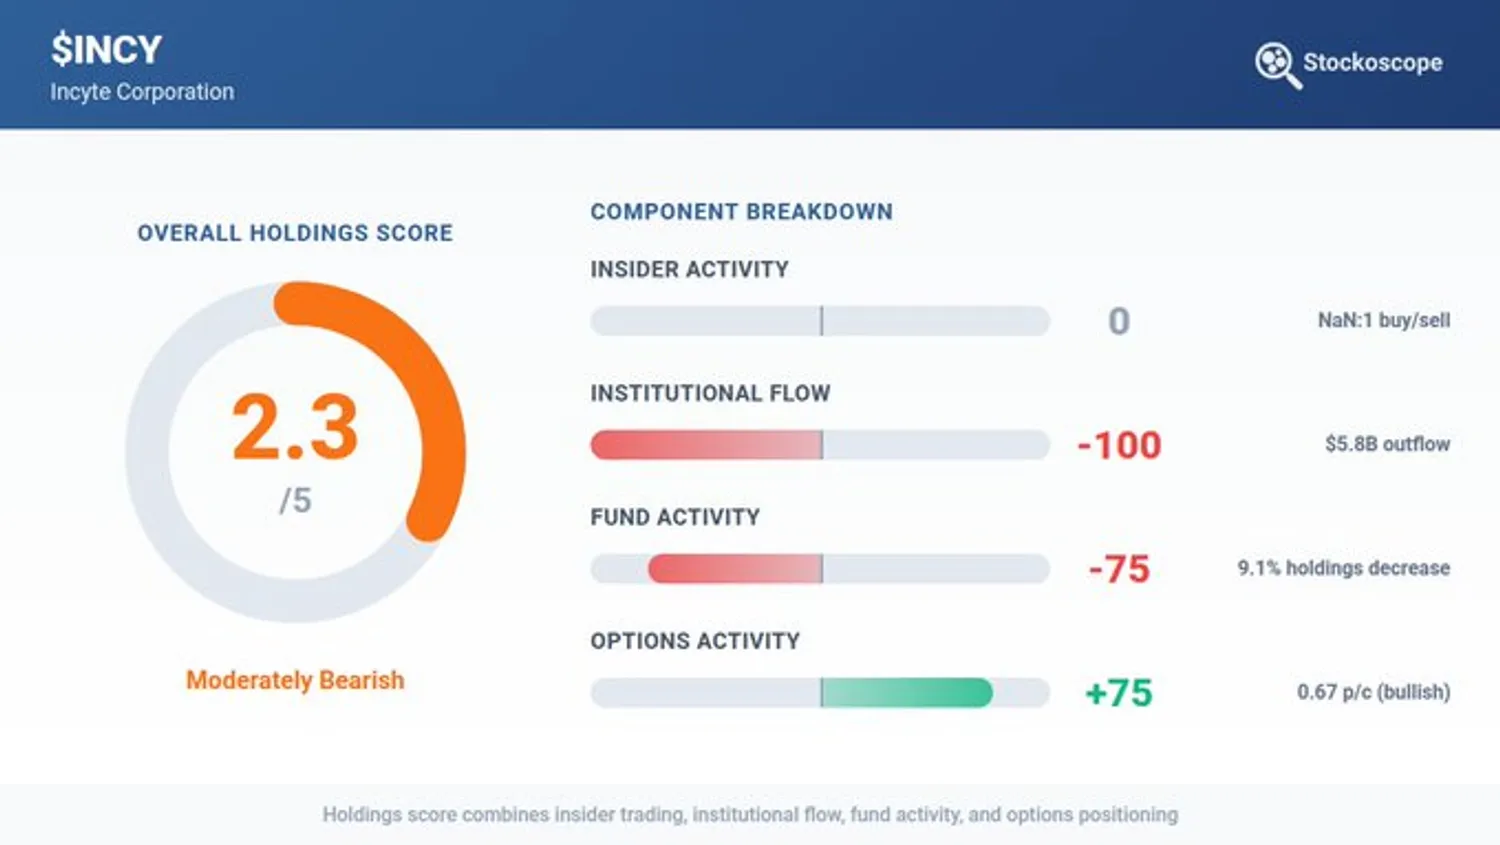 Figure 5. $5.8 billion in net institutional outflows is the dominant signal. Full breakdown on our Holdings Analysis page.
What the Five Dimensions Tell Us
The comprehensive analysis of Incyte through the lens of the 5D framework reveals a company executing exceptionally well operationally while facing a pointed question from the market's most informed participants: Is this performance sustainable?
The alignment between business quality and peer positioning makes a compelling case. Incyte demonstrates genuine competitive advantages through exceptional margins, strong returns on capital, and industry-leading growth rates. And its 82nd percentile ranking among healthcare peers confirms these aren't cyclical tailwinds but reflect a durable market position. Valuation adds weight to the bull case: the DCF implies 33% upside, valuation multiples appear reasonable, and analysts project continued revenue and earnings expansion through 2027. Taken together, three of our five dimensions tell a coherent, optimistic story.
The Holdings dimension is where that story gets complicated. The $5.8 billion in institutional outflows isn't noise. It represents informed capital making a deliberate exit at precisely the moment when fundamentals look strongest. Analyst sentiment, while moderately bullish, reinforces this caution: a 5.7% median price target upside from a community that acknowledges the operational excellence suggests Wall Street is pricing the execution risk, not the DCF scenario. When Holdings and Analyst sentiment both pump the brakes despite strong Quality, Peer, and Valuation signals, the framework is doing exactly what it's designed to do: preventing a clean fundamental picture from becoming blind conviction.
That pattern doesn't disqualify INCY as an investment, but it does define the central question: are institutions exiting a quality compounder at an inopportune moment, or do they know something the financials haven't yet revealed?
You can run the same 5D Framework analysis on any S&P 1500 stock, starting with Quality, Peers, Valuation, Analysts, and Holdings.
This article was originally published on X on 21 February 2026. We have retained the original publication date on this platform for consistency. All data, prices, and results reflect information available at the time of publication.
This analysis is for informational purposes only and should not be considered personalised investment advice. Past performance does not guarantee future results.