
The 5D Framework: A Complete System for Stock Analysis
Our integrated methodology that examines companies from five complementary angles.
Most investors analyze stocks the same way: glance at a few ratios, skim the latest earnings call, check what analysts are saying, and make a decision. The problem isn’t a lack of information. It’s a fragmented analysis that misses how different dimensions of a company connect.
A stock might look cheap on valuation metrics, but have deteriorating fundamentals. Strong fundamentals might be undermined by insider selling. Bullish analyst sentiment might ignore peer underperformance. Each lens reveals something the others miss. Used in isolation, each can mislead. Combined systematically, they form a complete picture.
The solution is systematic integration: five analytical dimensions, each answering different questions, combined into a single framework for understanding businesses. We call it the 5D Framework.
Five Dimensions, One Complete Picture
The 5D Framework examines every stock through five complementary lenses:
- Quality Analysis asks: Is this a quality business? It examines absolute fundamental strength across 40 metrics.
- Peer Analysis asks: How does it compare to competitors? It measures relative positioning within the sector and industry.
- Valuation Analysis asks: What could it be worth? It calculates intrinsic value through DCF modeling but considers valuation multiples.
- Analyst Analysis asks: What does Wall Street think? It aggregates professional sentiment and price expectations.
- Holdings Analysis asks: What is smart money doing? It tracks insider, institutional, and fund positioning.
Each dimension answers questions that the others cannot. Together, they reveal whether a stock represents a genuine opportunity or a hidden risk.
The sequence matters. We start with business quality, add competitive context, estimate value, incorporate professional sentiment, and confirm with ownership behavior. By the end, you understand not just what a company is, but how it compares, what it’s worth, what experts think, and what insiders are doing.
Dimension 1: Is This a Quality Business?
The foundation of any investment decision is business quality. Before considering valuation, sentiment, or positioning, you need to know whether the underlying company generates sustainable returns.
The Framework
Our Pillar Analysis evaluates 40 financial metrics organized into 10 fundamental pillars, each answering a specific question about business health:
- Returns Overview: Does management generate strong returns on capital?
- Margin Efficiency: Can the company convert revenue into profit?
- Cash Flow Quality: Do accounting profits translate to real cash?
- Top Line Growth: Is the business actually expanding?
- Operational Efficiency: Does it use assets and working capital wisely?
- Leverage & Coverage: Is debt at sustainable levels?
- Valuation Multiples: Is the market pricing reasonable?
- Dividend Metrics: Does it reward shareholders sustainably?
- Per-Share Fundamentals: Are shareholders getting richer?
- Liquidity & Working Capital: Can it meet short-term obligations?
Each pillar contains four metrics. For example, Returns Overview includes Return on Equity (ROE), Return on Invested Capital (ROIC), Return on Assets (ROA), and Return on Capital Employed (ROCE). Every metric is scored on a 1–5 scale using threshold-based tiers. Pillar scores are averaged from their four metrics. The overall Business Quality Score is the weighted average of all 10 pillars, yielding a final score of 1.0 to 5.0.
What It Reveals
Look for patterns across dimensions. Companies scoring 4.0+ show excellence across most areas: strong returns, expanding margins, cash matching earnings, and manageable debt. These businesses typically possess durable competitive advantages. Scores below 2.5 reveal a systematic weakness that no valuation discount can fix. However, don’t fixate on the aggregate score alone. Examine which pillars show strength or weakness.
Example
Meta (META) scores 4.0/5.0, with exceptional marks in Margin Efficiency (5.0) and per-share fundamentals (5.0) and Returns (4.0). The data reveals a business ggenerating 27.5% ROE, 80.7% gross margins and 45.6% EBITDA margins. Before examining valuation or analyst opinion, Business Quality Analysis confirms this is a fundamentally strong business.
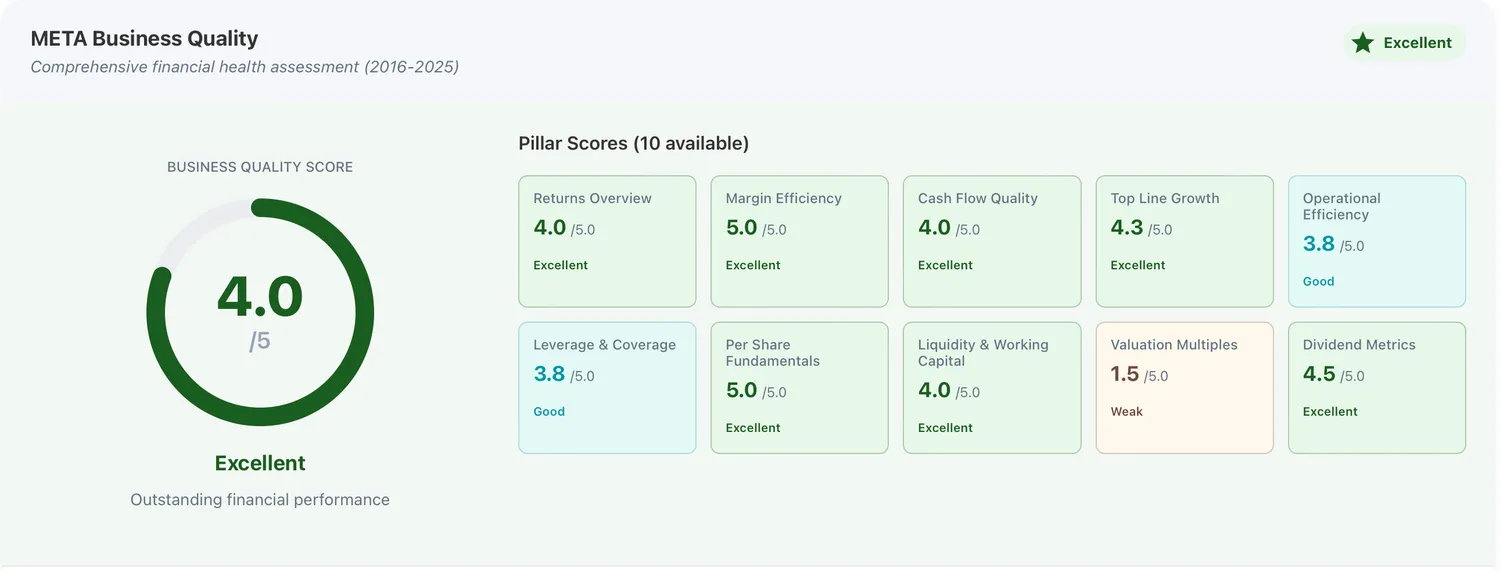
Figure 1: Meta's business quality score card
Dimension 2: How Does It Compare Against Peers?
A 15% profit margin might be exceptional for a retailer but mediocre for a software company. Absolute metrics, evaluated in isolation, miss critical context. Peer Analysis provides that context by ranking companies against their sector and industry competitors.
The Framework
Peer Analysis uses the same 40 metrics and 10 pillars as Pillar Analysis, but instead of scoring against fixed thresholds, it calculates percentile rankings within peer groups.
Two comparison groups provide different perspectives. Sector Comparison ranks the company among all companies in its sector (e.g., Technology) within the same market index (S&P 500/400/600). Industry Comparison ranks it within its specific industry (e.g., Software Infrastructure).
For each metric, the system collects data for all companies in the peer group, filters for outliers and anomalies, and calculates the percentile rank of the target company. These percentiles convert to 1–5 scores.
What It Reveals
Peer Analysis reveals competitive positioning that absolute metrics obscure. A company might score 3.5/5.0 on absolute quality but 4.5/5.0 relative to peers, indicating strong execution within a challenging industry. Conversely, a 4.0 absolute score might translate to only 2.5 relative to peers in a high-quality sector.
Example
CF Industries (CF) operates in Basic Materials, a sector typically associated with commodity-like margins and returns. Absolute analysis might overlook it. But Peer Analysis reveals CF ranks in the 90th+ percentile on returns, margins, and efficiency within its sector. A peer score of 4.4/5.0 identifies CF as a quality leader that an absolute analysis might miss.
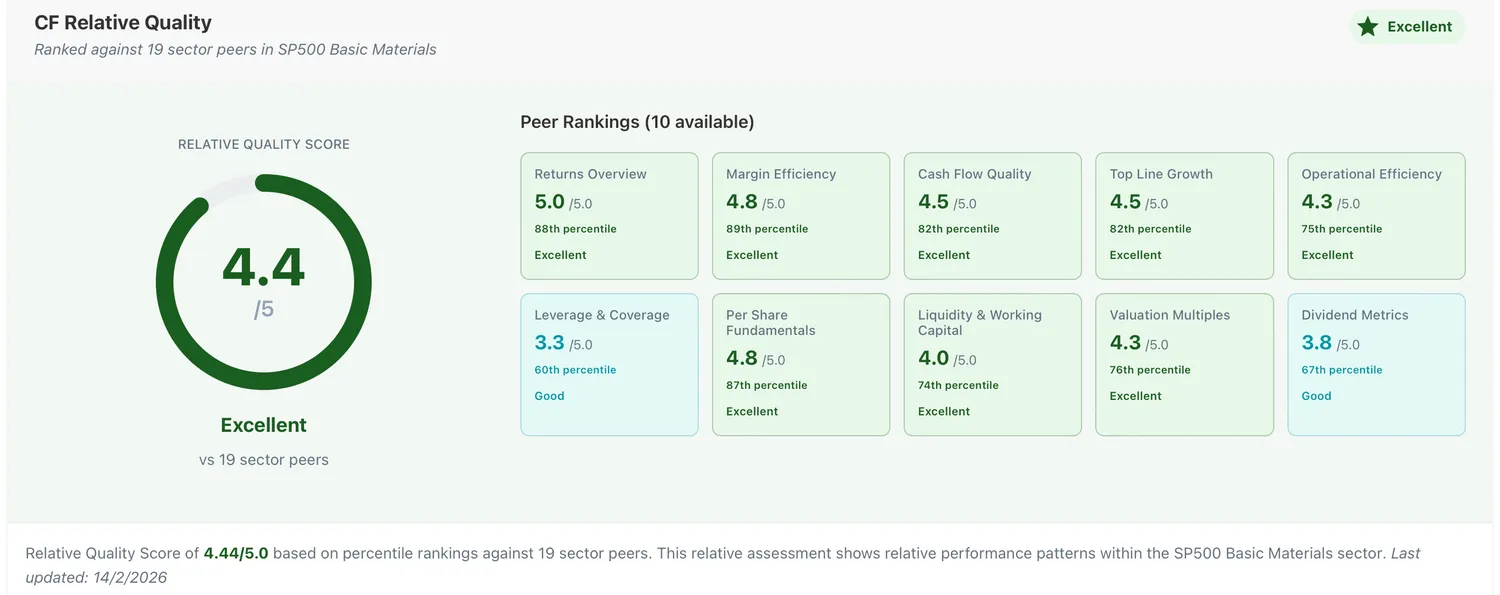
Figure 2: CF Industry's relative quality score card
Dimension 3: What Could It Be Worth?
Quality companies at excessive prices generate poor returns. Mediocre companies at deep discounts can outperform. Valuation Analysis estimates intrinsic value through two complementary approaches: discounted cash flow (DCF) modeling for fundamental value, and comparative valuation multiples for market context.
The Framework
Our valuation system combines bottom-up DCF analysis with top-down multiples comparison.
DCF engine projects future free cash flows, discounts them to present value, and calculates intrinsic value per share. The methodology incorporates analyst-consensus-first growth analysis with historical CAGR fallback, two-phase growth modeling with exponential tapering toward terminal rates, company-specific WACC calculation using current market data from Financial Modeling Prep (FMP), and transparent assumptions with full visibility into every input.
Valuation Multiples analyzes 10 key metrics across four perspectives to validate DCF findings and reveal market sentiment. Six price-based multiples (P/E, PEG, P/B, P/S, P/FCF, FCF Yield) measure what equity investors pay, while four enterprise value multiples (EV/EBITDA, EV/EBIT, EV/Sales, EV/FCF) provide capital structure-neutral comparisons. Each metric is evaluated through absolute thresholds, 10-year historical trends, sector peer rankings, and forward analyst estimates.
DCF analysis and valuation multiples are combined into a unified Valuation Score (1–5 scale) that weights DCF intrinsic value and multiples composite implied price equally (50/50 blend).
What It Reveals
The DCF analysis produces an intrinsic value estimate that can be compared directly to the market price, revealing whether the market is pricing in too much optimism, too much pessimism, or roughly fair expectations. Valuation multiples complement this by contextualizing the DCF result.
When DCF and multiples align (both placing the price below the estimates or both placing it above), confidence is high. When they diverge (DCF shows upside but multiples look expensive), investigate why. Sometimes the market sees risks DCF models miss. Sometimes multiples reflect temporary factors while DCF captures long-term value.
Example
Decker's outdoor Corp. shows an intrinsic value estimate of $202.49 per share while trading at $115.73; our model estimates the price is below its intrinsic-value estimate by about 75%. Multiples analysis reflects this: the P/E ratio ranks in the 85th percentile among peers, trading over 65% below its 10-year average, with forward estimates suggesting margin expansion. Combined, this produces a Valuation Score of 4.0/5.0, with both DCF and multiples contributing high scores.
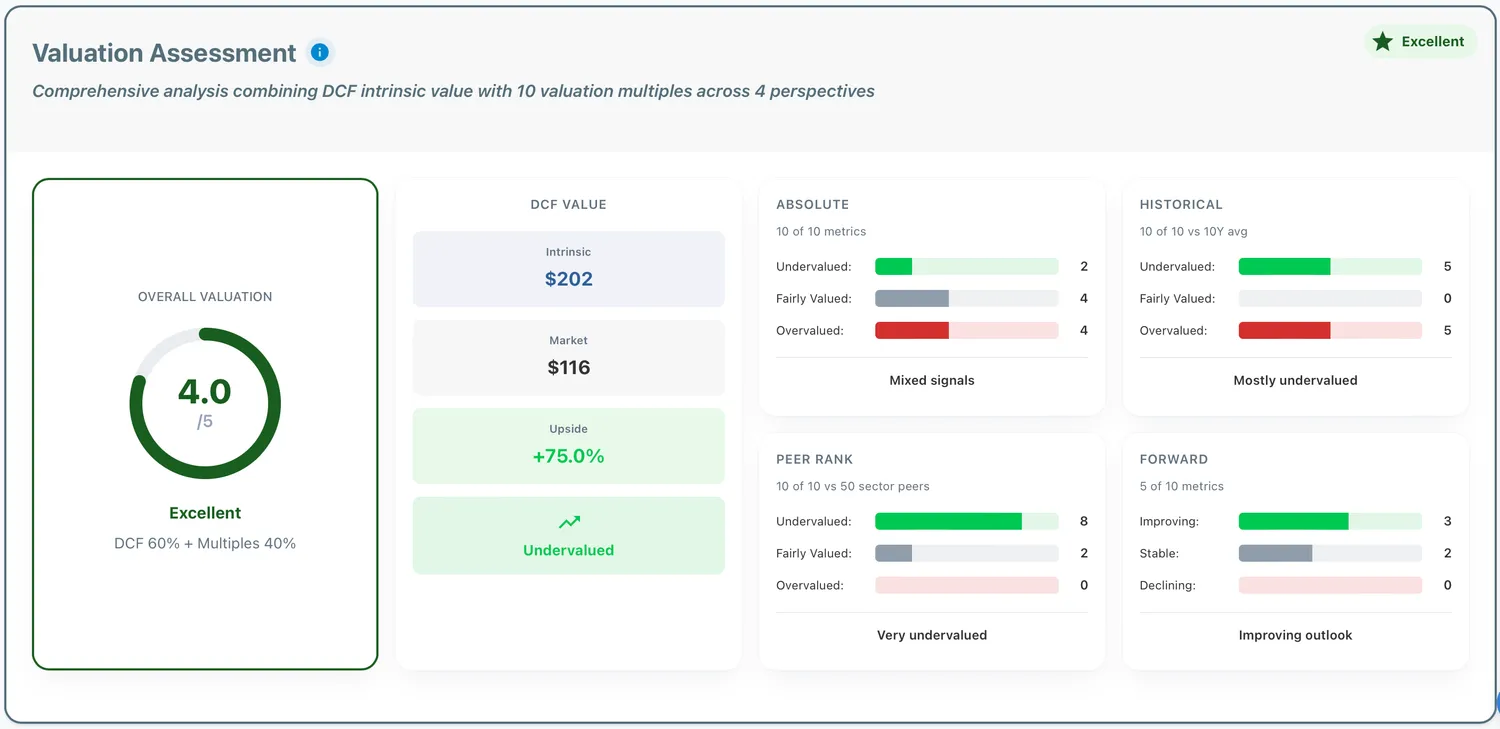
Figure 3: DECK's valuation score card
Dimension 4: What Does Wall Street Think?
Professional analysts dedicate their careers to understanding specific companies and industries. Their collective sentiment, including price targets, ratings, earnings forecasts, and financial health assessments, reflects deep research and market expertise. Analyst Analysis aggregates this professional perspective into clear signals.
The Framework
Analyst Sentiment Analysis combines five key components into an overall sentiment score. The framework examines:
- Consensus Rating: The aggregate recommendation from analysts (Strong Buy through Strong Sell)
- Price Target Upside: The gap between analyst price targets and the current market price, weighted across high, median, and low estimates
- Earnings Growth Expectations: Forward-looking revenue and EPS growth forecasts compared against historical performance
- Financial Health Assessment: Analysts' evaluation of balance sheet strength, profitability, and operational efficiency
- Analyst Coverage Depth: The breadth of professional research attention, indicating conviction in consensus views
Each component is independently evaluated, then weighted by reliability and predictive value.
What It Reveals
Analyst Sentiment Analysis reveals where professional consensus stands while exposing potential disconnects with market reality. A sentiment score above 4.0 indicates strong professional optimism backed by compelling price targets and growth expectations. Scores below 2.0 signal caution or outright pessimism from those who study the company most closely.
The real value emerges when combining analyst sentiment with other dimensions. Bullish sentiment that aligns with strong fundamentals, reasonable valuation, and insider buying creates high-conviction opportunities. Conversely, when analysts remain bullish despite deteriorating peer rankings or heavy insider selling, investigation is warranted. Similarly, bearish sentiment contradicted by improving fundamentals and institutional accumulation may signal a mispriced opportunity.
Example
AppLovin scores 4.3/5.0 on Analyst Sentiment Analysis, placing it in very bullish territory. The stock carries a Buy consensus from 23 analysts, with median price targets 67% above current levels. Earnings estimates point to strong growth, though the company’s financial health assessment scores a B.
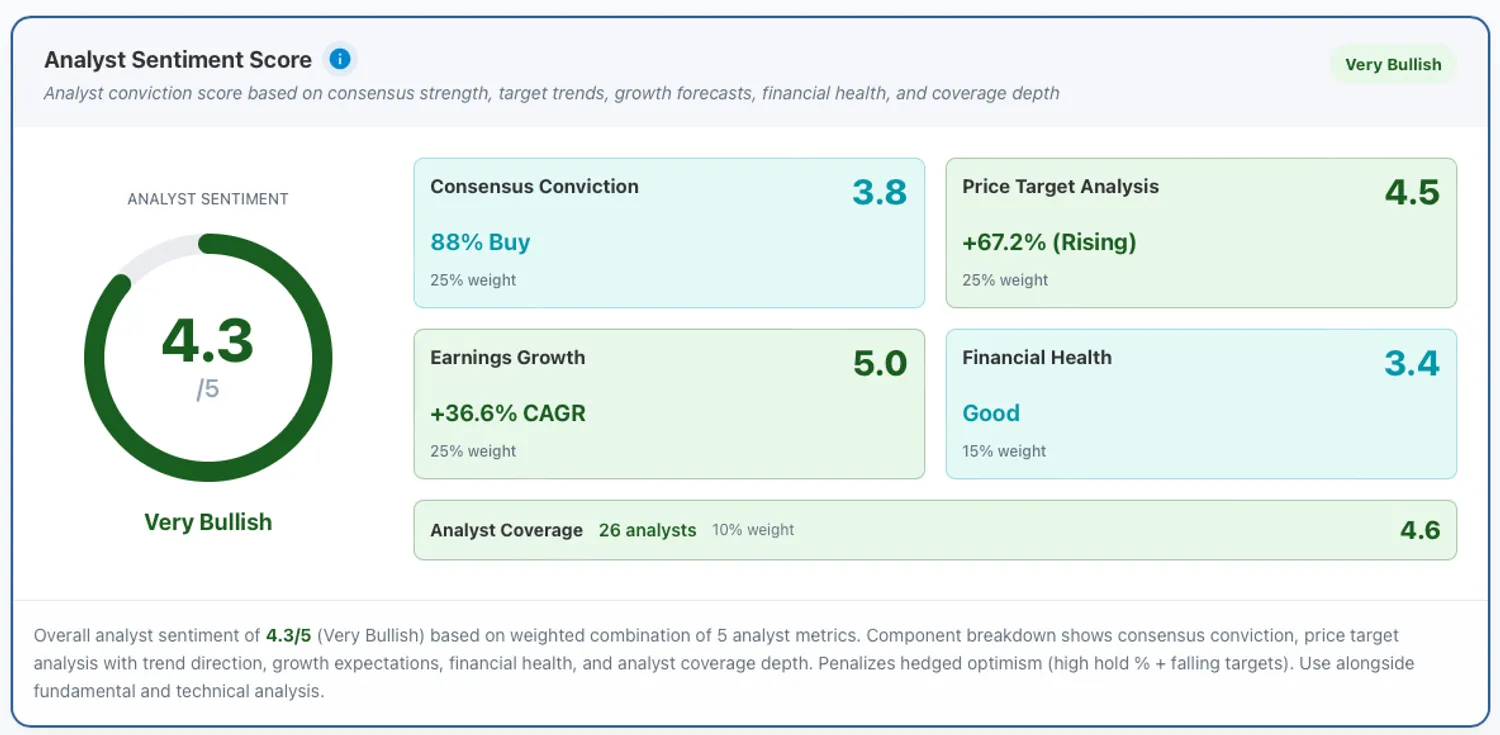
Figure 4: AppLovin's analyst sentiment score card
Dimension 5: What Is Smart Money Doing?
Actions speak louder than words. While analysts publish opinions, insiders and institutions vote with their capital. Holdings Analysis tracks the behavior of those with the most information and the most at stake.
The Framework
Holdings Analysis examines four layers, each weighted by reliability and impact. Insider Activity tracks executive and director transactions, revealing what those closest to the business are doing with their own money. Institutional Flow monitors quarter-over-quarter changes in institutional investment from professional money managers. Fund Activity follows ETF and mutual fund share flows and holder counts from long-term investment vehicles. Options Activity examines put/call ratio positioning to gauge institutional hedging behavior.
These four components combine into an overall Smart Money Sentiment Score (1.0–5.0 scale), providing a unified view of ownership behavior across all investor types.
What It Reveals
Holdings Analysis reveals what sophisticated investors are actually doing versus what they’re saying. A sentiment score above 4.0 indicates strong accumulation across multiple investor types, suggesting broad conviction in the company’s prospects. Scores below 2.0 signal widespread distribution, reflecting concerns not yet visible in fundamentals.
Insider buying during price weakness can reflect that management views the shares as priced below their estimate of value. Institutional accumulation indicates professional conviction backed by deep research. Fund outflows despite strong fundamentals might signal concerns not yet reflected in price. Options positioning can reveal whether institutions are hedging risk or positioning for upside.
The dimension is particularly valuable when it contradicts other signals. Strong fundamentals combined with an insider selling demand investigation. Bearish analyst sentiment contradicted by institutional accumulation warrants a closer look.
Example
HIMS scores 1.2 out of 5.0 on Holdings Analysis, placing it firmly in bearish territory. The details reflect insider selling by executives, along with significant capital outflows in the most recent quarter, including $10 billion from institutions and $13 billion from funds. A put to call ratio of 2.6 further indicates defensive positioning among options traders.
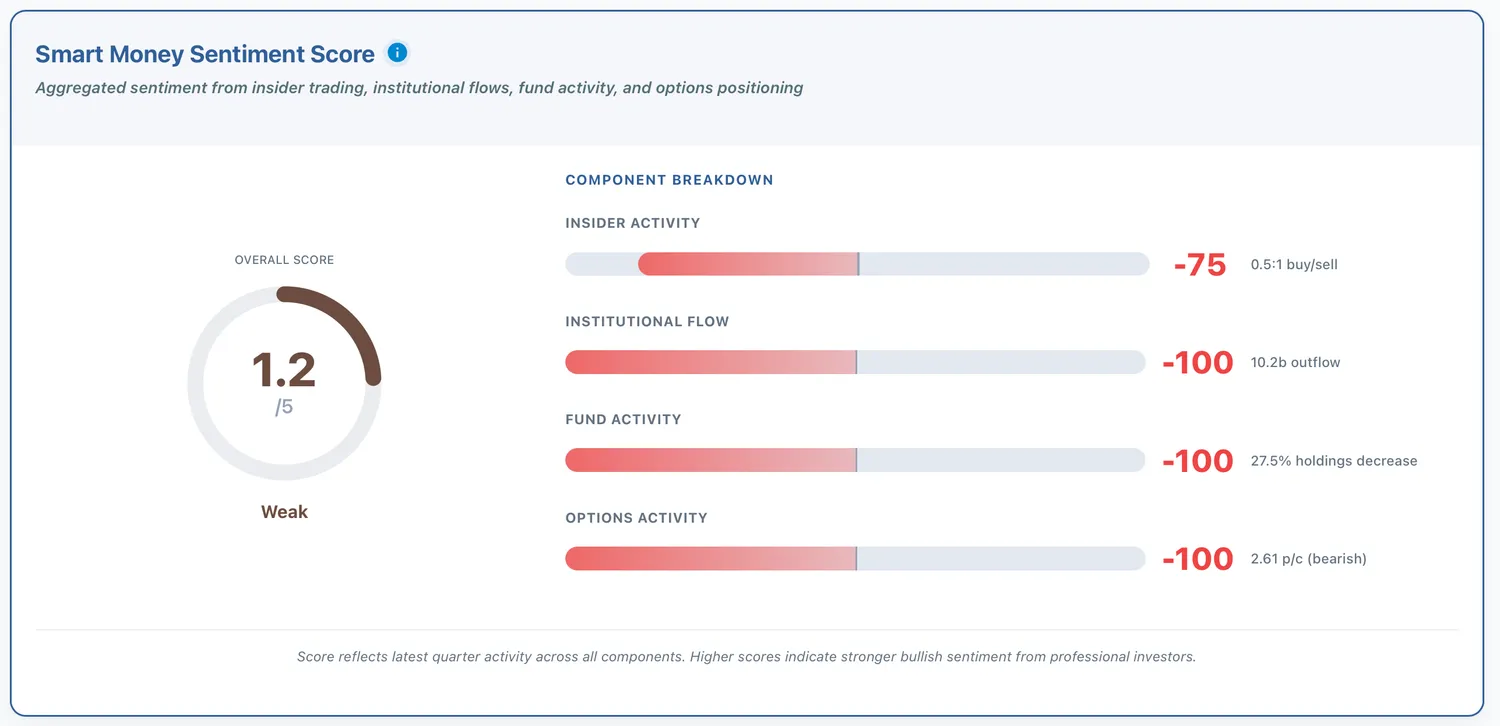
Figure 5: Hims and Hers Health's holdings analysis score card
How the Five Dimensions Work Together
The framework's analytical power emerges not from any single dimension but from their systematic integration.
Strong Alignment Creates Conviction
Consider a company scoring 4.3 on Quality, 4.5 on Peers, 3.8 on Valuation, 4.1 on Analysts, and 3.9 on Holdings. Every dimension aligns in the 3.8 to 4.5 range. This creates high conviction. The business demonstrates strong fundamentals. It outperforms competitors. Valuation appears reasonable relative to quality. Analysts maintain bullish views. Smart money accumulates shares. When all five dimensions agree, the signal strengthens dramatically.
Divergence Demands Investigation
Contrast this with a company scoring 4.2 on Quality, 3.9 on Peers, 2.1 on Valuation, 4.3 on Analysts, and 1.8 on Holdings. Quality and peer scores suggest a strong business. Analysts remain optimistic with a 4.3 rating. But valuation scores just 2.1, indicating the stock trades at a significant premium to intrinsic value. Holdings scores 1.8, revealing insiders sell shares while institutions reduce positions. This creates divergence that demands investigation.
Multiple explanations could account for this pattern. Perhaps the market overvalues future growth prospects that analysts support but insiders question. Maybe insiders sell for tax or diversification reasons unrelated to company outlook. Alternatively, insiders might see deterioration in competitive position not yet reflected in trailing fundamentals or analyst models. The divergence does not provide answers. It identifies questions that require investigation through news analysis, earnings call transcripts, and qualitative assessment.
The Analytical Sequence
We recommend analyzing dimensions in order. Quality Analysis establishes baseline quality: is this worth investigating further? Peer Analysis adds context: how does quality compare to alternatives? Valuation Analysis determines price: what could it be worth? Analyst Analysis incorporates professional views: what does Wall Street see? Holdings Analysis confirms with behavior: what are insiders and institutions doing?
By the end of this sequence, you understand the business (Pillar), its competitive position (Peer), its intrinsic value (Valuation), professional sentiment (Analyst), and smart money behavior (Holdings). When dimensions diverge or raise questions, recent news and qualitative analysis can provide context: management changes, competitive threats, regulatory developments, or strategic shifts that the numbers alone don’t capture.
Making It Actionable
The framework is available for most S&P 1500 stocks. An Overview page presents all five dimension scores simultaneously, revealing alignment or divergence at a glance. Five detailed pages cover Quality, Peers, Valuation, Analysts and Holdings, enabling deep analysis of each dimension. This allows systematic examination of any company using the same integrated methodology professional investors employ. When dimensions diverge or raise questions, refer to the News page as it can provide context: management changes, competitive threats, regulatory developments, or strategic shifts that the numbers alone don’t capture.
The Bottom Line
Stock analysis does not require perfect prediction. It requires systematic process that examines companies from multiple angles, identifies alignment and divergence, and produces informed decisions based on weight of evidence rather than single data points.
The 5D Framework provides that systematic approach. Quality Analysis answers whether fundamentals support long-term value creation. Peer Analysis reveals competitive positioning within the industry landscape. Valuation Analysis determines if current prices reflect reasonable expectations or significant mispicing. Analyst Analysis incorporates professional forward-looking views. Holdings Analysis shows whether informed investors back their views with capital.
Strong alignment across dimensions creates conviction. When a quality business trades at reasonable valuations with bullish professional sentiment and smart money accumulation, the dimensions point in the same direction. When dimensions diverge, investigation becomes essential. Understand why signals conflict before making investment decisions.
This article is an updated version of the blog originally published on Medium on 5 January 2026. It has been revised with new examples and refreshed data as of 14 February 2026.
Data sourced from Financial Modeling Prep API.
This article is for educational purposes only and does not constitute investment advice. Always conduct your own research and consider consulting with financial professionals before making investment decisions.