
Holdings Analysis: Following Smart Money
Talk is cheap. Watch what informed investors actually do with their capital. Insider buying, institutional flows, and fund participation reveal conviction that analyst ratings cannot capture.
Actions reveal conviction better than words. An analyst can issue a Buy rating while their firm sells shares. A CEO can praise prospects while dumping stock. But capital allocation shows true beliefs. When insiders purchase with personal wealth, institutions deploy billions, and hundreds of funds add exposure, those actions signal conviction no recommendation can match.
Holdings analysis tracks what informed investors do with money. Three categories provide distinct perspectives: insiders with superior business information, institutions with professional research resources, and funds representing aggregated capital. Each group's buying and selling patterns reveals expectations about future performance.
Why Ownership Patterns Matter
Public companies disclose ownership changes through SEC filings. Insiders report transactions within days. Institutions file 13F reports quarterly. Fund holdings appear in quarterly disclosures. This creates transparent records of informed investor behavior.
Ownership patterns provide forward-looking signals historical analysis misses. A company might show excellent past returns and strong margins. But if insiders systematically sell while institutions reduce exposure, that divergence deserves investigation. Perhaps they see slowing growth or margin pressure not yet visible in trailing numbers.
Conversely, aggressive insider buying with increasing institutional ownership reflects accumulation by informed investors. Insiders know product pipelines and customer traction before public disclosure. Institutions identify mispriced opportunities through deep research. When both accumulate simultaneously, that coordination shows shared positioning.
The magnitude and persistence matter more than isolated transactions. One insider selling for liquidity provides minimal signal. Ten insiders buying across three quarters shows conviction. One institution closing might reflect rebalancing. Two hundred increasing positions indicates broad professional recognition.
Insider Trading: Management's Vote with Capital
Company insiders possess material non-public information about business operations, product development, competitive dynamics, and financial performance. While they cannot trade on specific material information, they can and do buy shares when they believe their company is undervalued or sell when they see limited upside.
The primary metric is shares acquired versus shares disposed. Insiders acquire shares through open market purchases, option exercises with cash, or as part of compensation. They dispose of shares through sales, gifts, or transfers. The balance reveals net insider sentiment.
The buy-to-sell ratio provides the clearest signal. When insiders acquire more shares than they dispose of, the ratio exceeds 1.0, indicating net buying. Ratios above 2.0 show strong buying conviction. Ratios below 0.5 indicate heavy net selling. This ratio normalizes across different company sizes and share prices.
Tesla in Q4 2025 showed 424 million shares acquired versus 307,000 shares disposed. This produces a buy-to-sell ratio exceeding 1,300, representing overwhelming insider buying conviction. Only two acquisition transactions occurred, suggesting large strategic purchases rather than routine compensation activity.
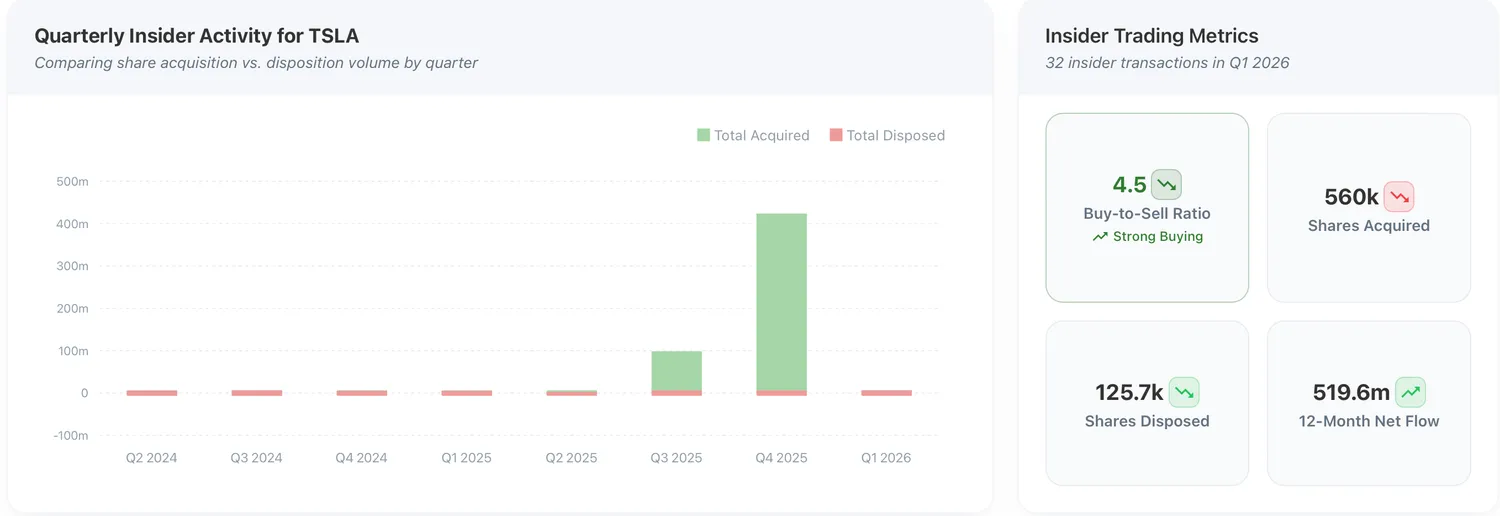
Figure 1: Tesla insider trading card
Walmart in Q4 2024 demonstrated the opposite pattern with 4.8 billion shares disposed versus 8,000 shares acquired. The ratio near zero indicates systematic insider selling. This volume and consistency suggests coordinated liquidation rather than normal diversification.
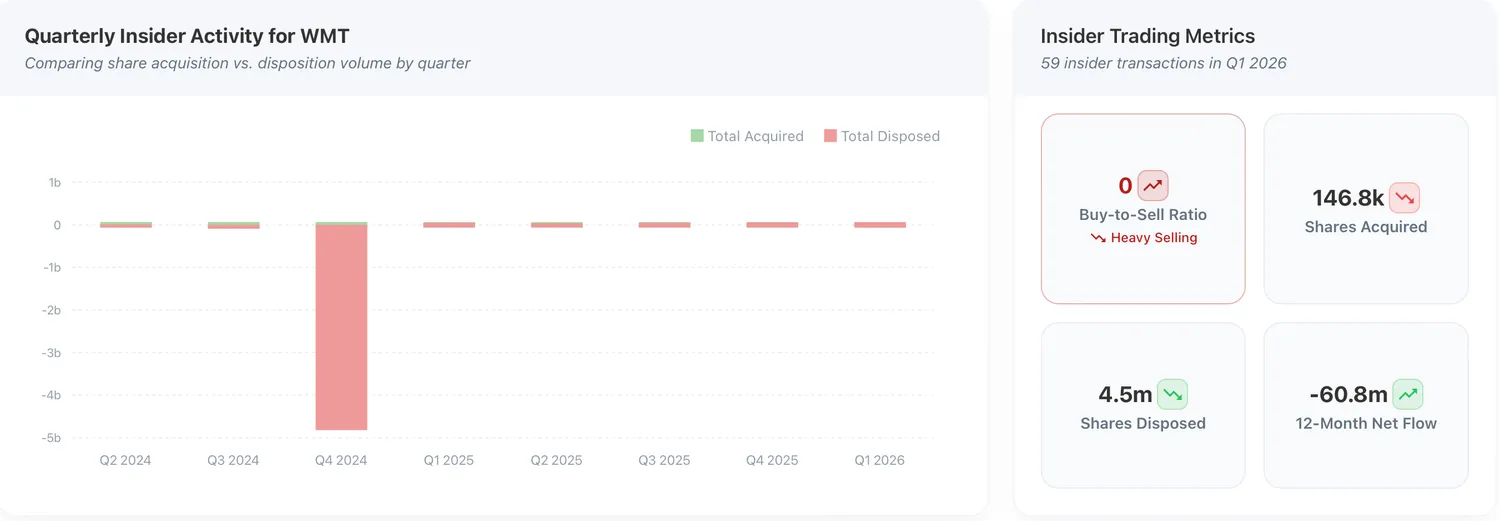
Figure 2: Walmart insider trading card
Transaction details provide additional context. Large purchases by CEOs and CFOs carry more weight than small sales by mid-level executives. Purchases outside preset trading plans show stronger conviction than mechanical plan-based sales. Clustered buying across multiple insiders simultaneously indicates shared positive outlook.
But insider selling requires careful interpretation. Executives receive substantial stock compensation requiring diversification for tax planning and wealth management. Selling portions of large holdings represents prudent portfolio management, not necessarily pessimism. The ratio and pattern matter more than absolute selling volume.
Institutional Ownership: Professional Capital Allocation
Institutional investors including pension funds, mutual funds, hedge funds, and asset managers control trillions in capital. Their position changes reflect professional research, quantitative analysis, and portfolio strategy decisions. These investors employ teams of analysts, access management directly, and maintain sophisticated valuation models.
Two primary metrics reveal institutional sentiment: investment flow and ownership percentage.
Investment flow measures the dollar value of net institutional buying or selling each quarter. Positive flow means institutions collectively increased capital deployed into the stock. Negative flow indicates net selling. The magnitude relative to market capitalization shows conviction strength.
NVIDIA in Q2 2024 attracted $1.8 trillion in institutional investment. This represents massive professional capital allocation supporting the AI thesis. The breadth of institutional participation shows broad adoption across new and existing holders.
By Q4 2025, institutional inflows continued but moderated significantly to $93 billion, with ownership at 67.5% and net position activity of +883. This normalization represents institutions managing to target weights after substantial appreciation, not a loss of conviction in the underlying thesis.
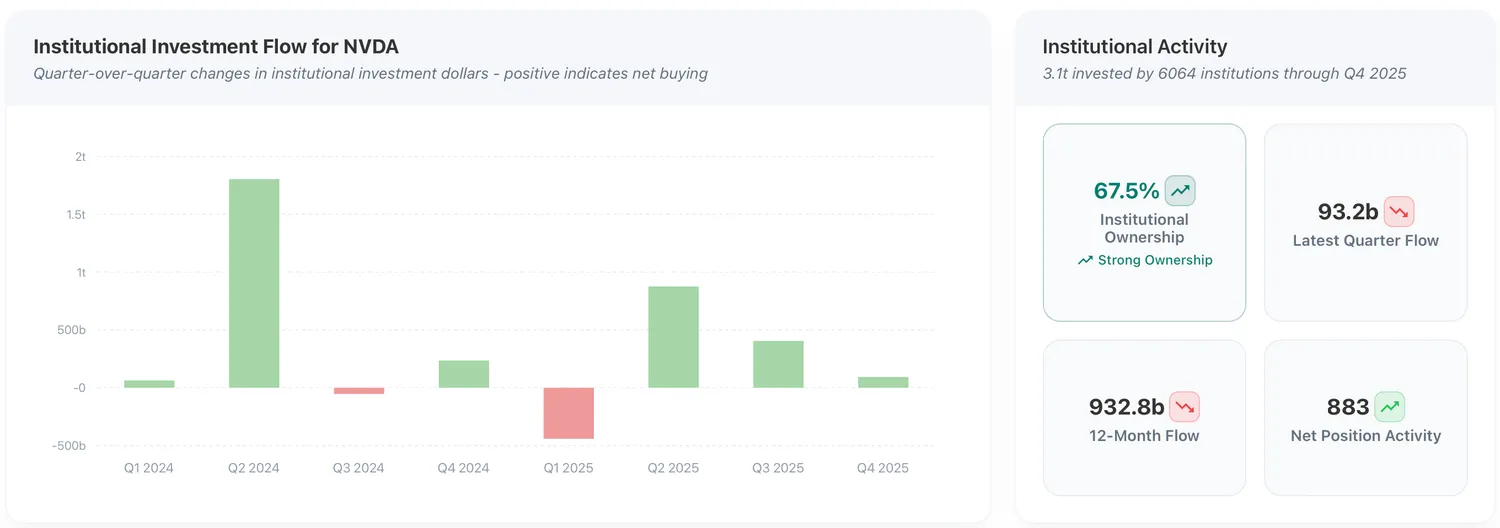
Figure 3: NVIDIA institutional ownership card
The ownership percentage shows how much of the company institutions collectively own. High institutional ownership above 70% provides stability and liquidity but limits incremental buying capacity. Low institutional ownership below 40% suggests either value undiscovered by professionals or fundamental concerns keeping institutions away.
For example, Mastercard demonstrates stable strong institutional ownership at 96.2% with $40.8 billion in Q4 2025 inflows. Positive flows across all four quarters of 2025 indicate broad professional conviction in the business model and growth trajectory.
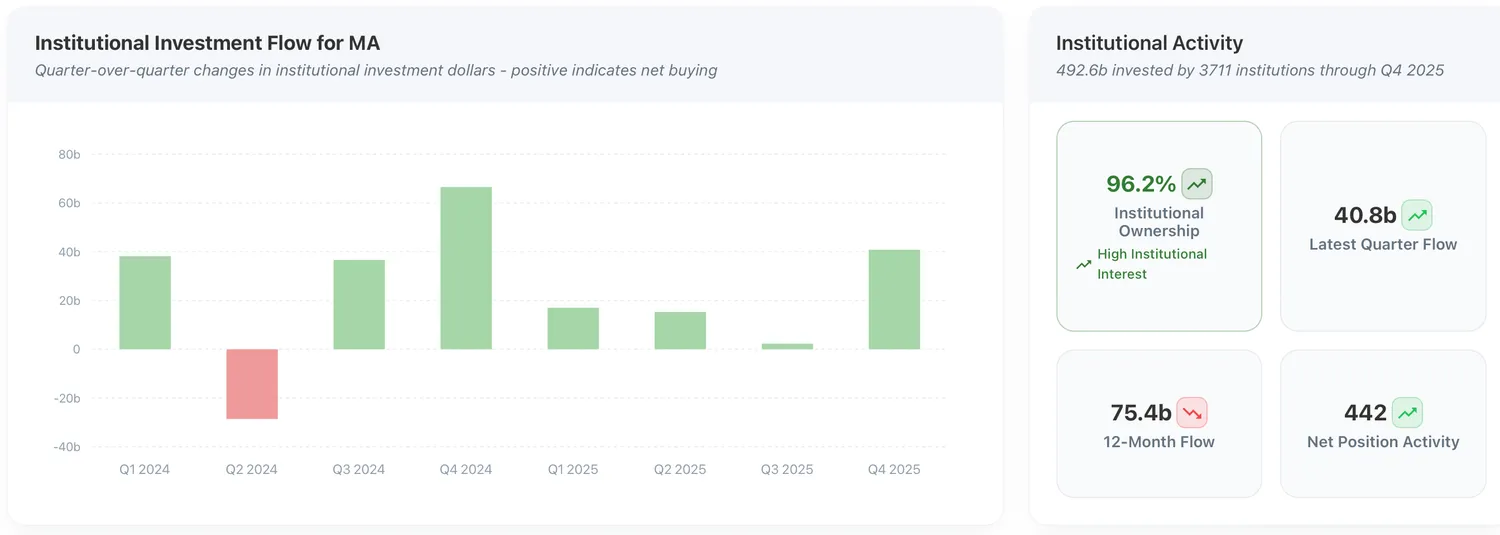
Figure 4: Mastercard institutional ownership card
Fund Participation: Retail and Professional Aggregation
ETFs and mutual funds aggregate both retail investor capital and professional fund manager decisions. Fund flows reveal how this broader investment community views opportunities. Unlike institutional 13F filings showing end-of-quarter snapshots, fund flows capture ongoing capital allocation through subscriptions and redemptions.
The primary metrics are share flow and fund count.
Share flow measures net fund buying or selling each quarter. Positive flow means funds collectively added shares. Negative flow indicates net selling. This differs from institutional investment flow by measuring share quantities rather than dollar values, capturing physical accumulation patterns.
AT&T in Q4 2025 saw funds add 6.8 billion shares with 820 funds holding positions. This broad-based accumulation indicates fund managers finding value despite the stock's mature profile.
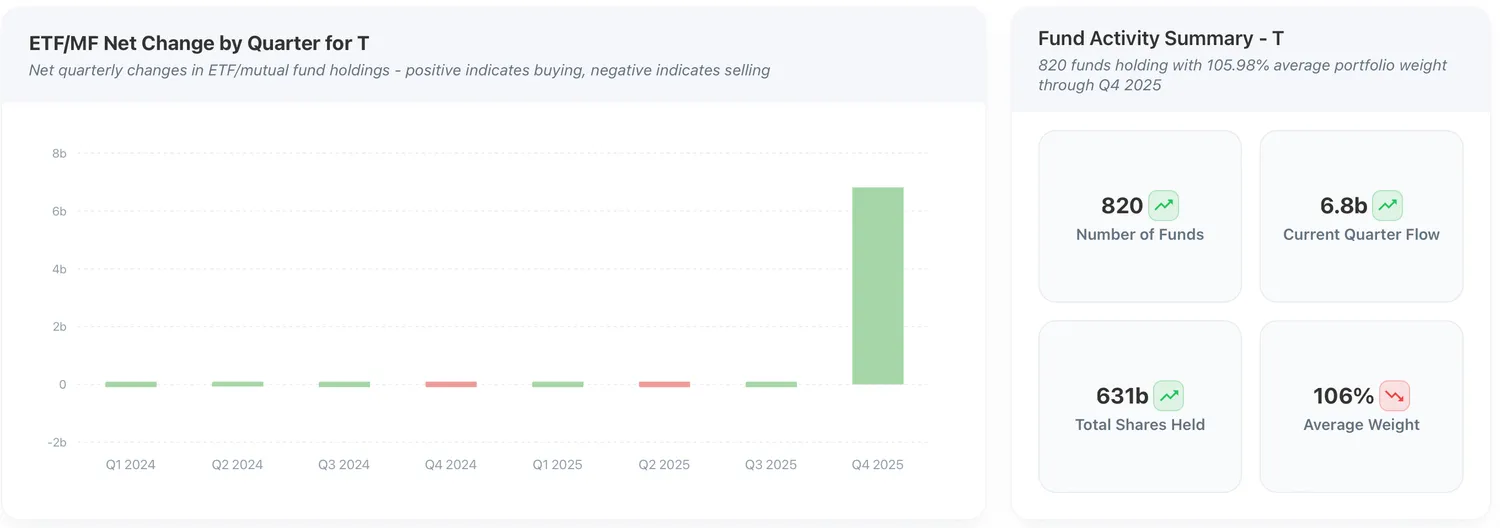
Figure 5: AT&T ETF and Mutual Fund Participation card
Fund count shows how many different funds hold the stock. Higher counts indicate broad participation across different investment styles and strategies. Growing fund counts suggest increasing adoption. Declining counts indicate funds exiting positions.
NVIDIA in Q4 2025 saw funds add 105 million shares with 769 funds holding positions. The continued accumulation across a large fund base indicates broad ongoing adoption despite the stock's substantial prior appreciation.
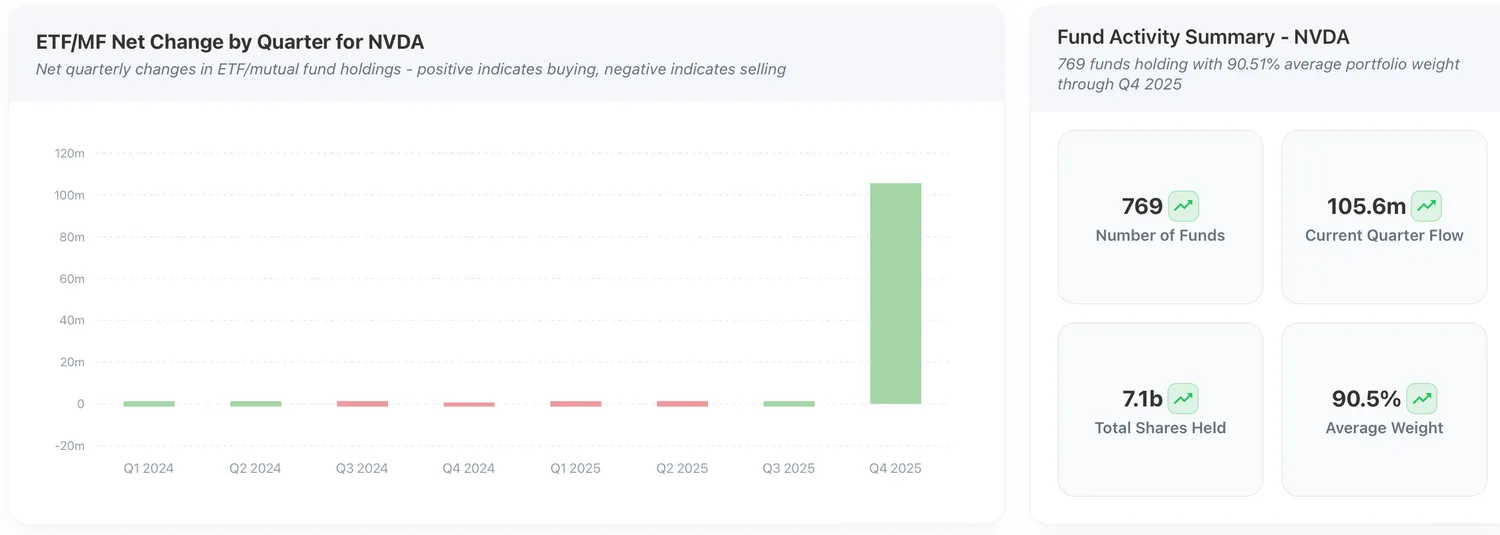
Figure 6: NVIDIA ETF and Mutual Fund Participation card
Fund flows complement institutional data by capturing smaller investors and passive index funds excluded from 13F filings. The combination reveals complete ownership picture across all investor types.
Portfolio weight shows the average percentage allocation funds maintain. Higher weights indicate funds making concentrated bets. Lower weights suggest diversification with smaller positions. Weight changes reveal conviction shifts as managers adjust sizing.
What Drives Ownership Changes
Understanding motivations improves interpretation.
Insiders buy for few reasons: they believe shares are undervalued, they want to signal confidence, or they have compensation obligations. The first two show genuine conviction.
Insiders sell for many reasons: liquidity needs, tax obligations, diversification, or viewing shares as fully valued. The abundance of legitimate selling reasons makes insider buying more significant than selling.
Institutions buy when valuation appears attractive, when risk-adjusted returns exceed alternatives, or when momentum aligns. They sell when reaching price targets, when better opportunities emerge, or when portfolio constraints require rebalancing.
Funds buy when managers identify opportunities or when subscriptions create deployment needs. They sell when managers lose conviction, when redemptions force liquidation, or when index changes require adjustments.
The multiplicity of selling reasons explains why sustained buying patterns matter more than isolated selling. Coordinated buying across insiders, institutions, and funds suggests genuine opportunity. Selling might reflect dozens of unrelated portfolio decisions.
Integration with the Framework
Ownership analysis gains power through combination with quality fundamentals, peer rankings, valuation metrics, and analyst sentiment.
Quality analysis from Dimension 1 establishes whether the business generates sustainable returns. Strong quality with increasing insider buying and institutional accumulation creates compelling opportunity. Weak quality with increasing ownership suggests either mispriced turnaround potential or investors making mistakes.
Peer comparison from Dimension 2 shows competitive positioning. If a company ranks top quartile among peers while insiders buy and institutions accumulate, that alignment strengthens conviction. If peer rankings deteriorate while ownership increases, investigation into what informed investors see that metrics miss becomes essential.
Valuation analysis from Dimension 3 provides context for ownership changes. Institutions accumulating while DCF shows significant upside and multiples trade below historical averages creates consistency. Institutions selling while valuation appears attractive suggests either the intrinsic value estimates are wrong or temporary factors drive selling.
Analyst sentiment from Dimension 4 can confirm or contradict ownership patterns. When analysts maintain Buy ratings while insiders sell and institutions reduce positions, that divergence demands investigation. When analysts downgrade while informed investors accumulate, ownership behavior might reveal opportunity analysts miss.
The framework synthesizes these signals. Quality business at reasonable valuation with bullish analysts and increasing informed ownership shows alignment across dimensions. Quality business with deteriorating ownership despite bullish fundamentals and analyst optimism shows divergence across dimensions. The multi-dimensional view prevents over-reliance on any single signal.
Making This Actionable
Holdings analysis reveals informed investor behavior through three lenses: insider transactions showing management conviction, institutional flows showing professional capital allocation, and fund participation showing broader market adoption.
Focus on key metrics that provide clearest signals. For insiders, track buy-to-sell ratio and watch for clustered buying across multiple executives. For institutions, monitor quarterly investment flows and ownership percentage trends. For funds, follow share flows and fund count changes.
Sustained multi-quarter patterns matter more than single period movements. One quarter of selling might represent rebalancing. Four consecutive quarters of selling indicates conviction shift. One quarter of buying could be opportunistic. Three quarters of coordinated accumulation suggests genuine opportunity recognition.
But ownership data provides one perspective requiring integration with fundamental analysis, valuation work, and competitive positioning. Insiders can be wrong. Institutions can miss opportunities or hold onto losers too long. Funds can pile into overcrowded trades. The complete 5D framework reduces these risks by cross-validating signals.
Explore holdings analysis for any S&P 1500 company with our Holdings tool. The page shows insider trading patterns, institutional investment flows, and fund participation trends with quarterly charts and detailed transaction tables. From there, examine Quality, Peers, Valuation, and Analysts to build the complete picture.
Holdings data sourced from SEC Form 4 filings (insider transactions), SEC 13F filings (institutional ownership), and fund prospectus disclosures as of March 2026. Ownership percentages and flows calculated from regulatory filings.
This article is for educational purposes only and does not constitute investment advice. Always conduct your own research and consider consulting with financial professionals before making investment decisions.