
Valuation Analysis: Estimating a Company's Intrinsic Value
Quality business at wrong price destroys returns. Systematic valuation combines discounted cash flow models with market multiples to reveal whether current prices reflect fundamental value.

Two investors buy shares of the same quality company at different times in the market cycle. The first buys early in the bull market when shares trade at 15 times earnings. The second buys near the peak when shares trade at 30 times earnings. Over the next ten years, the company performs exactly as expected, growing earnings steadily. The first investor earned 12% annually. The second earned 3% annually. Same company, same earnings growth, dramatically different returns. The difference was valuation at entry.
Quality analysis reveals whether a business generates sustainable returns. Valuation determines whether current prices offer reasonable entry points. A quality business at excessive valuation can produce poor returns. A mediocre business at deep discount can generate gains if fundamentals improve. Price matters as much as quality.
Why Valuation Requires Rigor
Simple heuristics fail. "P/E under 15 looks cheap" ignores growth rates, capital requirements, and competitive positioning. A utility with stable 5% growth at 12 times earnings might be expensive. A software company growing 30% annually at 35 times earnings might be cheap.
Valuation demands systematic analysis from multiple perspectives. Discounted cash flow models estimate intrinsic value by projecting future cash flows and discounting to present value. Valuation multiples compare current prices to financial metrics, revealing how the market values this company relative to history and peers. Combined, they create a more complete picture.
The goal is not precision. You cannot value a company to two decimal places. The goal is establishing reasonable ranges and identifying significant divergences between market prices and fundamental value.
DCF Valuation: The Robust Approach
Discounted cash flow analysis starts with a simple premise. A company is worth the present value of all future cash flows it will generate. The challenge is estimating those future cash flows with reasonable accuracy and discounting them at appropriate rates.
Two-Stage Growth Model
Our methodology uses a two-stage approach. The first stage projects revenue growth and margins over a five-year forecast period. The second stage assumes the business matures into perpetual growth at a lower terminal rate. This structure reflects business reality. Companies cannot maintain 20% growth indefinitely. Eventually, market saturation, competition, or economic constraints force growth to moderate toward economy-wide averages.
The revenue growth rate for the forecast period uses an analyst-consensus-first approach. When analyst coverage is strong (3+ analysts covering 2+ forward years), the model calculates the compound annual growth rate implied by consensus revenue estimates. When coverage is limited, historical revenue CAGR over the past 5 years serves as the fallback. This prioritizes forward-looking data while ensuring every company gets a data-driven growth assumption.
Growth confidence scores reflect this data quality. A confidence score approaching 1.0 indicates strong analyst coverage with estimates extending multiple years. Lower scores indicate historical-only growth assumptions. The system identifies the source as "analyst" or "historical" to show which inputs drove the final growth assumption.
WACC Calculation
The discount rate uses weighted average cost of capital calculated with company-specific market data from Financial Modeling Prep (FMP). Cost of equity employs the capital asset pricing model with current risk-free rates, equity risk premiums, and company-specific betas sourced from FMP. Cost of debt uses the company's actual borrowing costs. Capital structure weights reflect current market-value-based debt and equity weightings.
This produces discount rates typically ranging from 6% to 11% for stable companies. Higher-growth companies with elevated betas might see discount rates reaching 12% to 15%. The discount rate compounds over time, so small differences create meaningful valuation impacts over ten-year periods. For ADR stocks, country-specific risk premiums are automatically applied to account for additional geographic risk.
Terminal growth rate
Terminal growth rates are sourced from FMP's long-term growth rate estimates, capped at 3% to ensure they don't exceed reasonable long-term GDP growth assumptions. The system also enforces a minimum 2% spread between WACC and terminal growth to prevent mathematically extreme terminal value multiples. This combination of data-driven terminal rates with sensible guardrails produces stable, defensible terminal values.
Reading DCF Results
The model outputs intrinsic value per share, which compares directly to current market price. The upside percentage shows the gap. But the numbers require interpretation beyond simple "undervalued" or "overvalued" labels.
Consider DECK, currently trading at $104.71 with DCF intrinsic value of $174.86. This implies 67% upside. The model projects 7.8% revenue growth over five years based on analyst consensus across 6-20 analysts, with 3% terminal growth. The 9.2% discount rate reflects DECK's beta of 1.161 and capital structure (98.3% equity), calculated from FMP market data. The growth confidence of 0.94 indicates strong analyst coverage supporting the forecast.
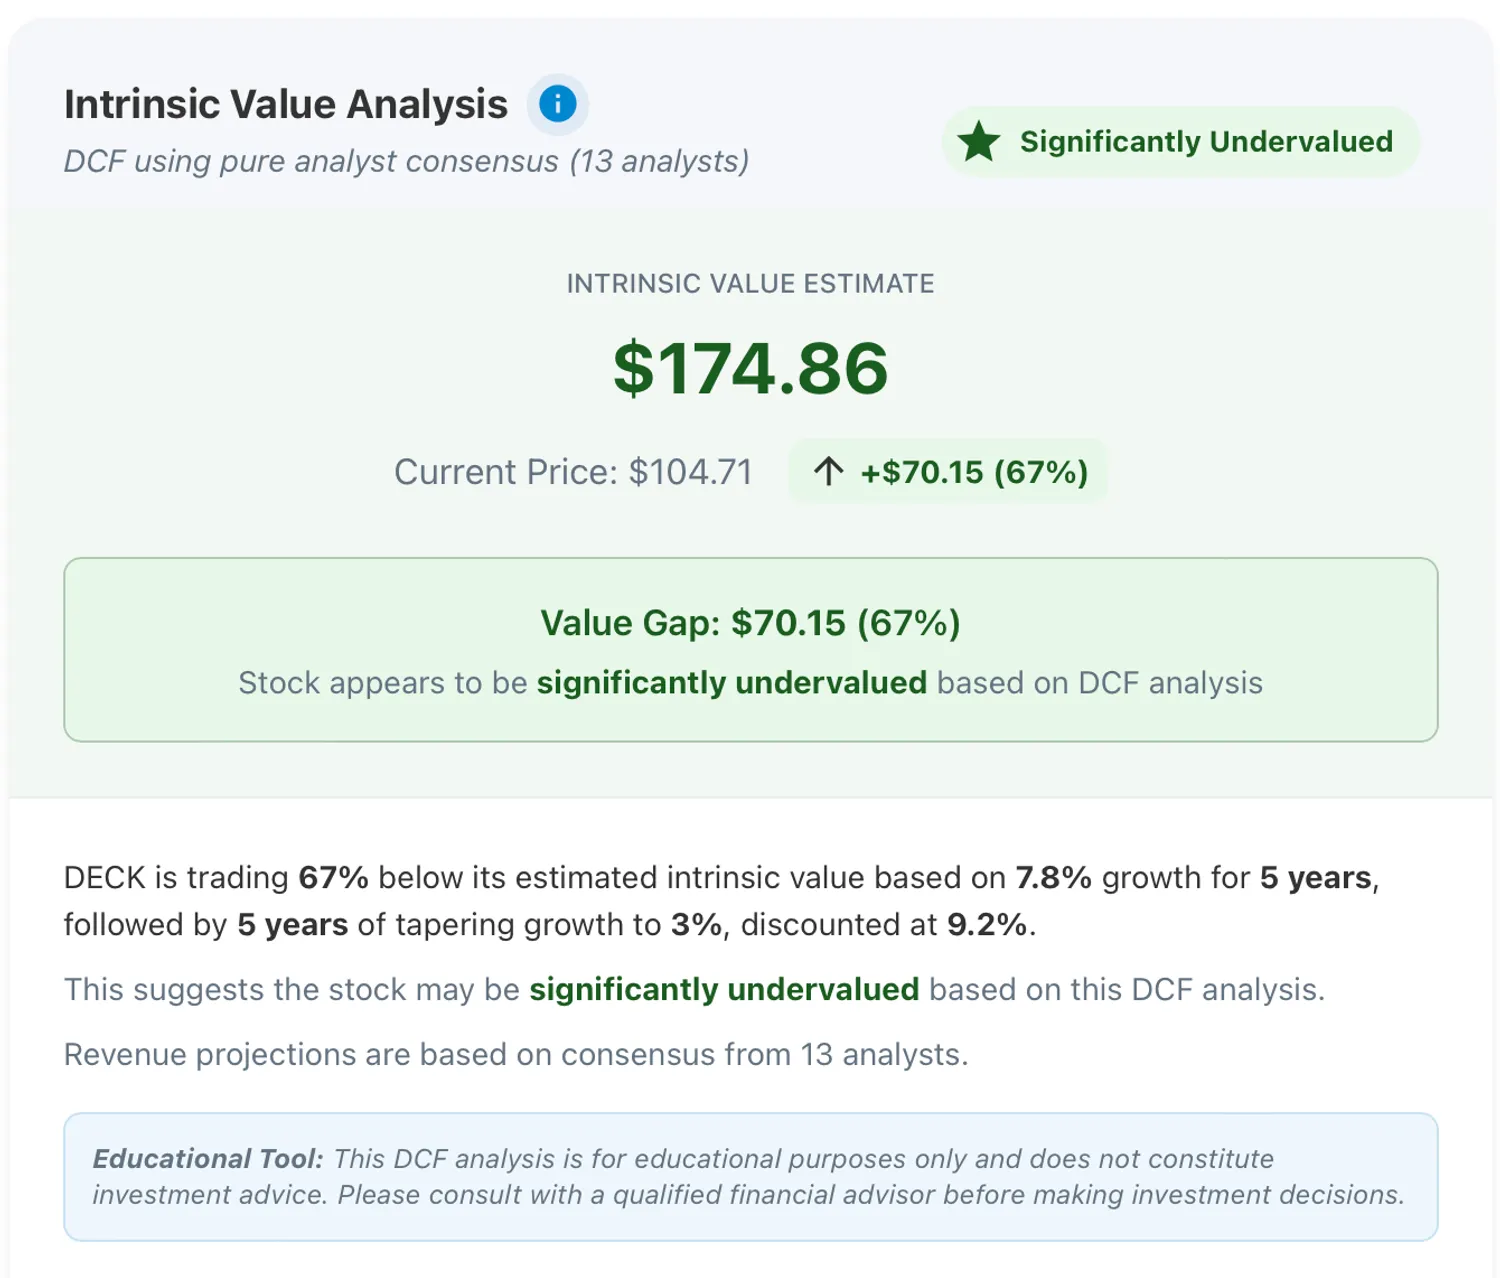
Figure 1: DECK's DCF Valuation Results
This valuation does not mean DECK will definitely reach $175. It means if the company executes according to analyst expectations for growth and maintains margins, the present value of those cash flows justifies $175 per share. The current price of $105 discounts significant execution risk, competitive pressure, or market skepticism about growth sustainability.
The 67% gap to the intrinsic-value estimate demands further investigation. Is the market underestimating DECK's competitive position? Are analysts too optimistic about growth? Has something changed in the business that DCF assumptions miss? The DCF provides the framework for these questions, not the final answer.
Cash Flow Projections
The cash flow projections illustrate DECK's expected financial trajectory over the 10-year analysis period, with revenue growing from $5.4 billion in Year 1 to $8.7 billion by Year 10.
The model maintains the 7.8% growth rate through the initial 5-year forecast period, generating progressively larger free cash flows that reach $1.704 billion by Year 5. During the tapering phase (Years 6-10), growth rates decline exponentially from 4.9% to 3.0%, creating a realistic business maturation pattern while still producing substantial cash generation of $2.095 billion in the final projection year.
The present value calculations show how the 9.2% discount rate affects these future cash flows, with earlier years contributing $872-1,156 million each in present value terms, while the exponential tapering creates smooth transitions that avoid the unrealistic "cliff effects" common in simplified DCF models.
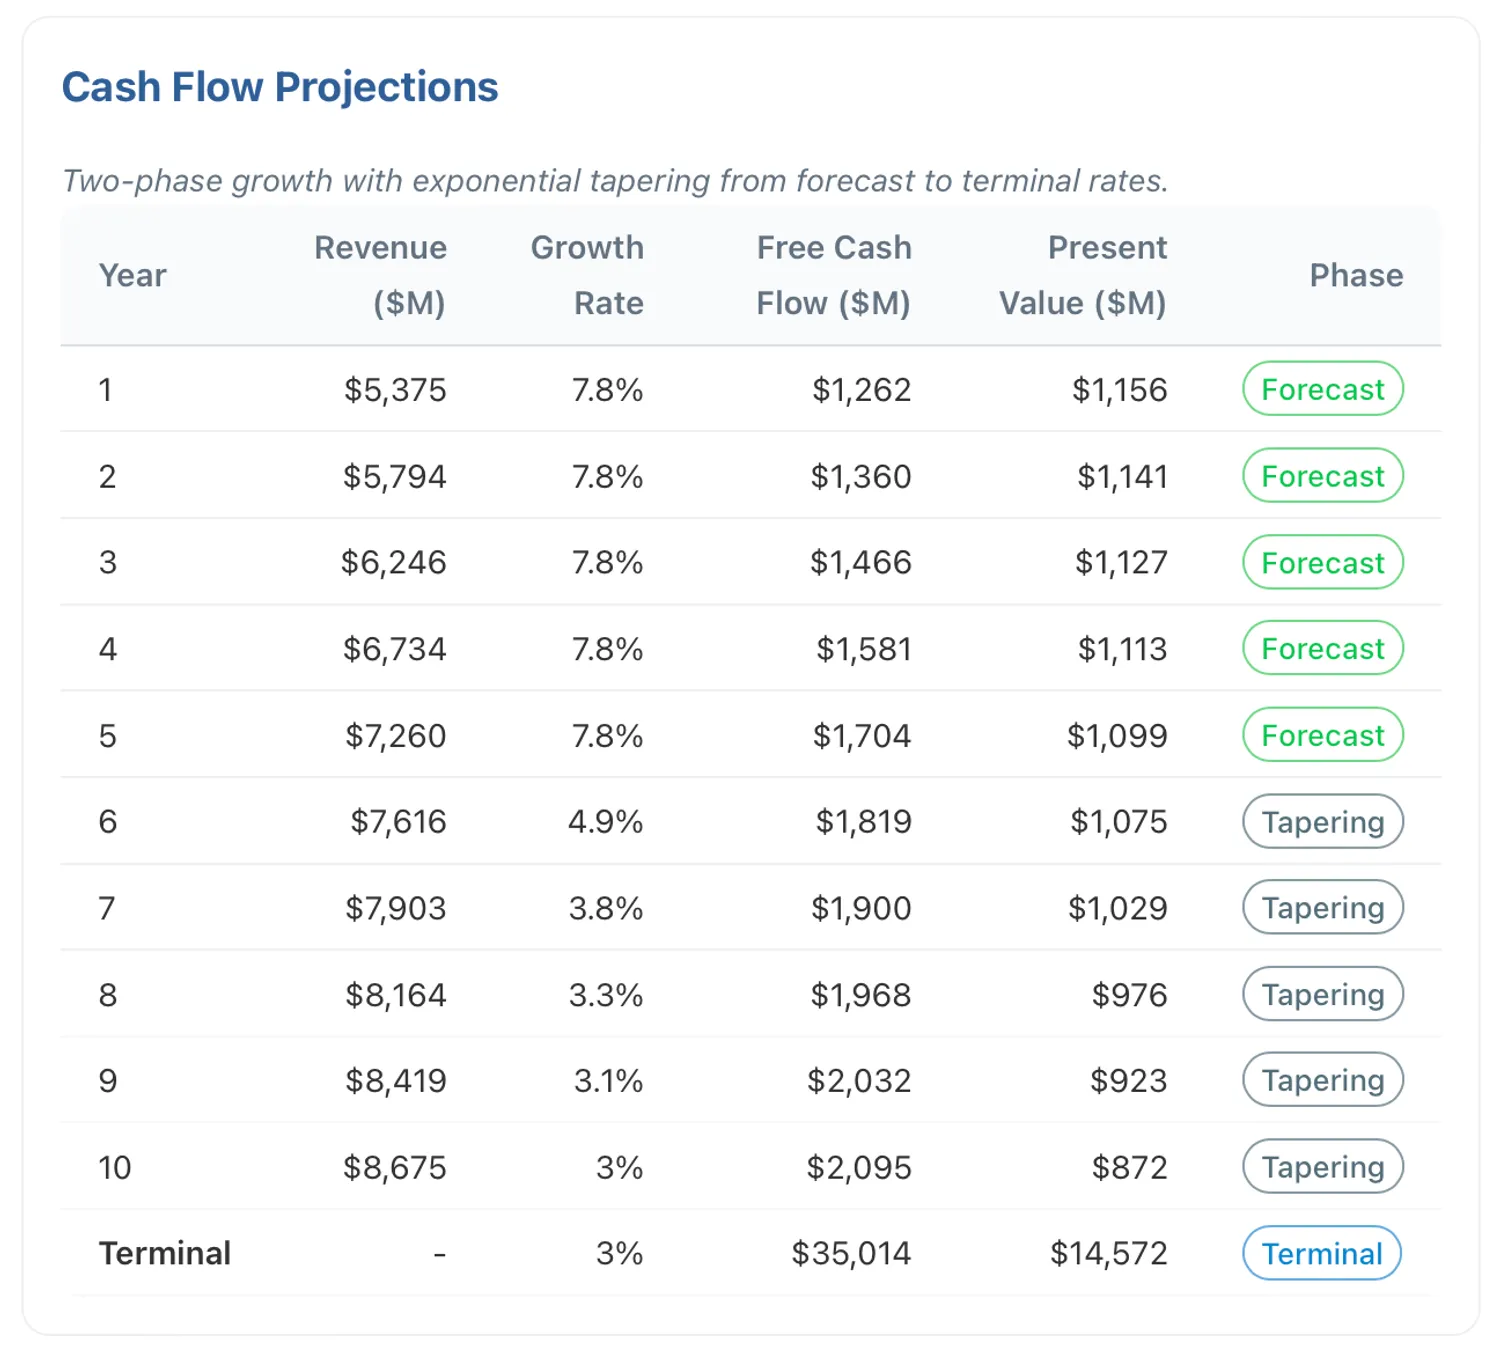
Figure 2: DECK's 10-year cash flow projections.
Sensitivity Analysis: Testing Your Assumptions
DCF valuation depends entirely on assumptions about future growth, terminal value, and discount rates. A single intrinsic value number provides false precision. The platform allows you to adjust these critical inputs to understand how valuation changes under different scenarios.
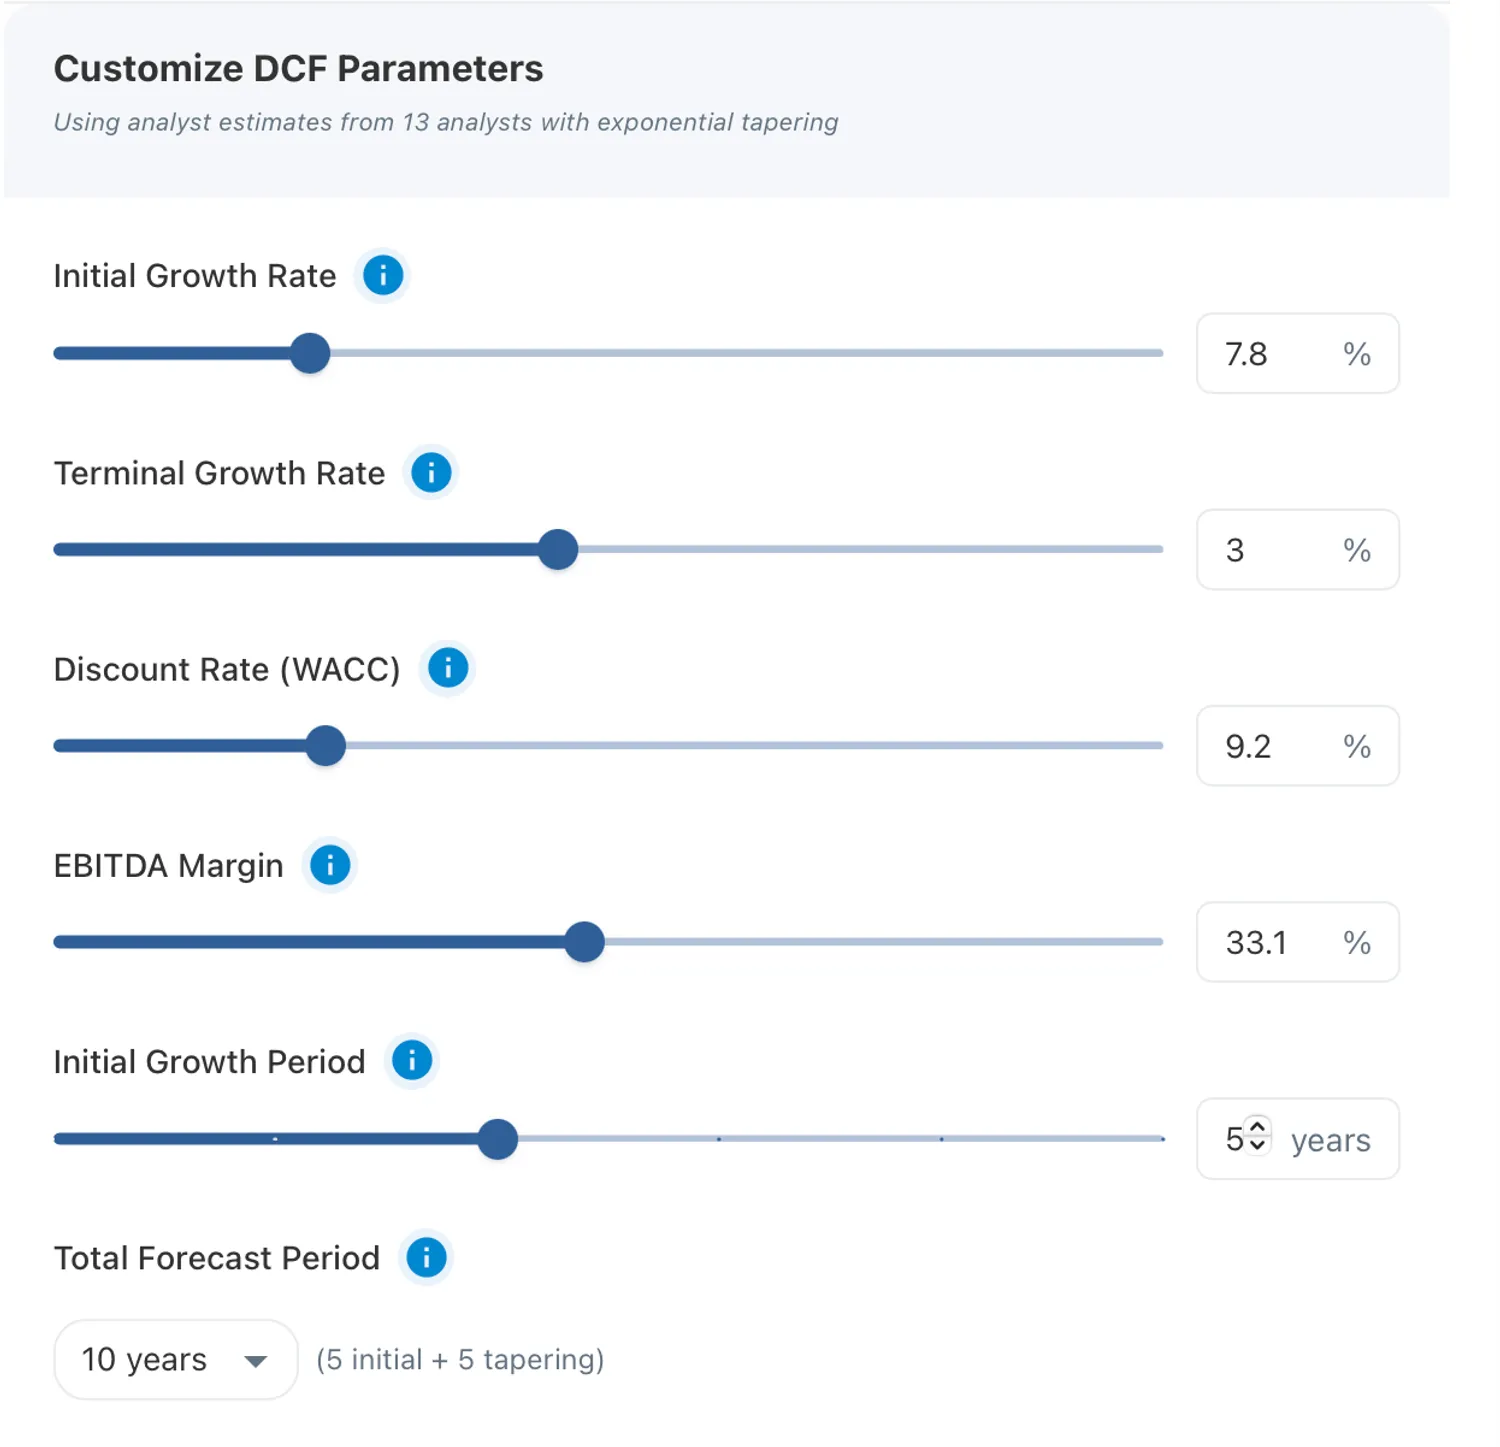
Figure 3: Interactive valuation controls let users adjust growth, discount rates, and forecast horizons in real time to test DCF assumptions
You can modify five key parameters: the initial revenue growth rate, the terminal growth rate, the discount rate, the EBITDA margin and the projection period. Changing the revenue growth assumption from 7.8% to 5% would drop intrinsic value from $175 to $154. Raising the discount rate from 9.2% to 11% would reduce intrinsic value to $136. Lowering terminal growth from 3% to 2% would produce $157 intrinsic value.
This sensitivity testing reveals the range of reasonable valuations rather than fixating on a single number. If intrinsic value ranges from $130 to $210 across sensible assumption variations, and the stock trades at $105, that still suggests upside across most scenarios. But if realistic assumptions produce intrinsic values from $100 to $120, the apparent 67% upside might disappear under more conservative projections.
Always conduct sensitivity analysis before drawing valuation conclusions. Test pessimistic scenarios with lower growth and higher discount rates. Test optimistic scenarios with sustained growth and lower costs of capital. The stock might offer compelling value if intrinsic value exceeds market price across most reasonable assumptions. But if intrinsic value drops below market price under modest assumption changes, the margin of safety disappears.
Never rely on a single DCF output. The model provides framework for thinking about value, not definitive answers. Test your assumptions, understand the sensitivity, and maintain appropriate skepticism about projections extending years into uncertain futures.
Valuation Multiples: What the Market Implies About Value
DCF estimates intrinsic value from projected cash flows. Valuation multiples take a different approach: they reveal what the stock would be valued at if it traded at the same multiple as its sector peers, its own historical average, or the level implied by analyst forward estimates. The platform analyzes 10 distinct multiples across price-based and enterprise value measures, and for each one calculates a concrete implied value price.
Implied Values: Three Perspectives
Rather than just showing raw multiples, the platform converts each multiple into an actionable dollar-value answer. For every metric, three implied value prices are calculated.
- Sector peer implied price. If the stock traded at its sector's median multiple, what would the share price be? This is the primary perspective and the hero value displayed on each metric card. A stock trading at 15x earnings when its sector median is 25x implies a peer-implied value 67% above the current price.
- Historical implied price. If the stock traded at its own 10-year median multiple, what would the share price be? This reveals whether the market is pricing the company above or below its own historical norms.
- Forward implied price. If analyst estimates for next year materialize, what does the current multiple imply about value? This captures whether improving fundamentals justify the current price.
Each metric card leads with the peer-implied value as the hero number, followed by a narrative comparing the current multiple against sector and historical medians, detailed rows showing all three implied prices with their raw multiple values, and a 10-year bar chart of the historical multiple with the sector interquartile range overlaid.
This approach transforms abstract ratios into concrete price targets. Instead of interpreting whether a P/E of 14.8 is cheap or expensive, the platform answers directly: sector peers imply a value of $178, the company's own history implies $144, and forward estimates imply $32.
Key Valuation Multiples
Five primary multiples are featured on the valuation page, selected for their broad applicability and complementary perspectives across earnings, growth, cash flow, and enterprise value.
Price-to-Earnings Ratio
The P/E ratio divides market capitalization by annual net income. A P/E of 20 means investors pay $20 for every $1 of annual profit. Lower P/E multiples suggest cheaper valuations, though fast-growing companies typically command higher P/E ratios than mature businesses.
DECK trades at 14.8x trailing earnings. The peer-implied value is $178, representing 70% upside from the current price. This is based on the consumer cyclical sector median of 25.1x, meaning DECK trades at a steep discount to peers on an earnings basis. The stock ranks in the 85th percentile on this multiple within its sector. DECK's own 10-year median of 20.3x implies a historical value of $144, also well above the current price.
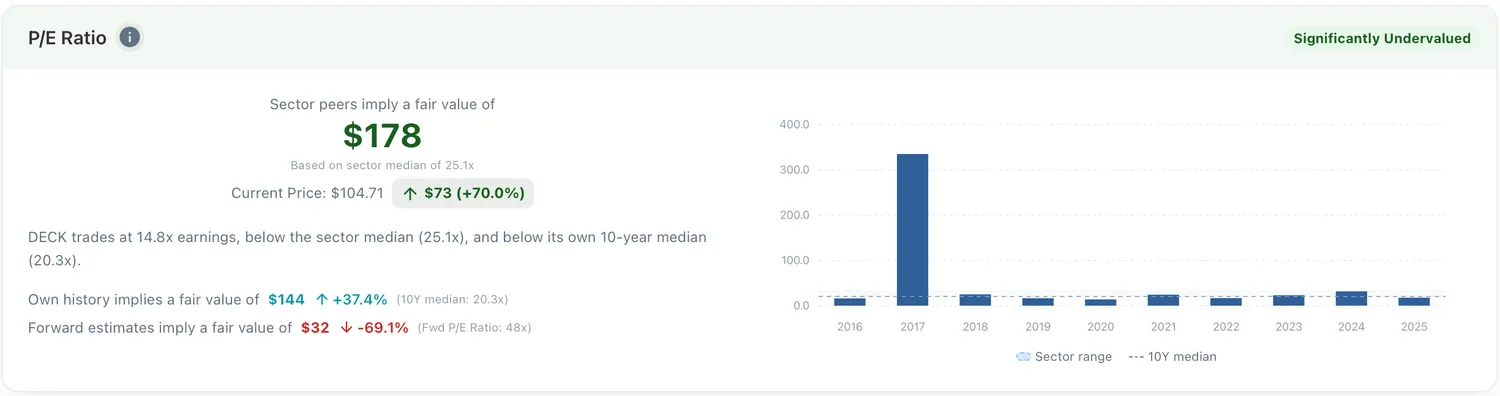
Figure 4: DECK's P/E Ratio showing peer-implied value of $178, narrative comparison, three implied price rows, and 10-year historical chart with sector range overlay.
PEG Ratio
The PEG ratio divides P/E by the earnings growth rate, adjusting valuation for growth expectations. A PEG of 1.0 suggests growth is priced in line with the model. PEG below 1.0 indicates the price may be low relative to expected growth; PEG above 2.0 suggests expensive growth pricing.
DECK shows a PEG of 1.4x. The peer-implied value is $275, representing 163% upside, reflecting the sector median PEG of 3.8x. This gap indicates DECK ranks among the lowest on this growth-adjusted multiple relative to consumer cyclical peers. The historical PEG median of 0.7x implies $49, suggesting DECK historically traded at even lower PEG ratios during high-growth periods.
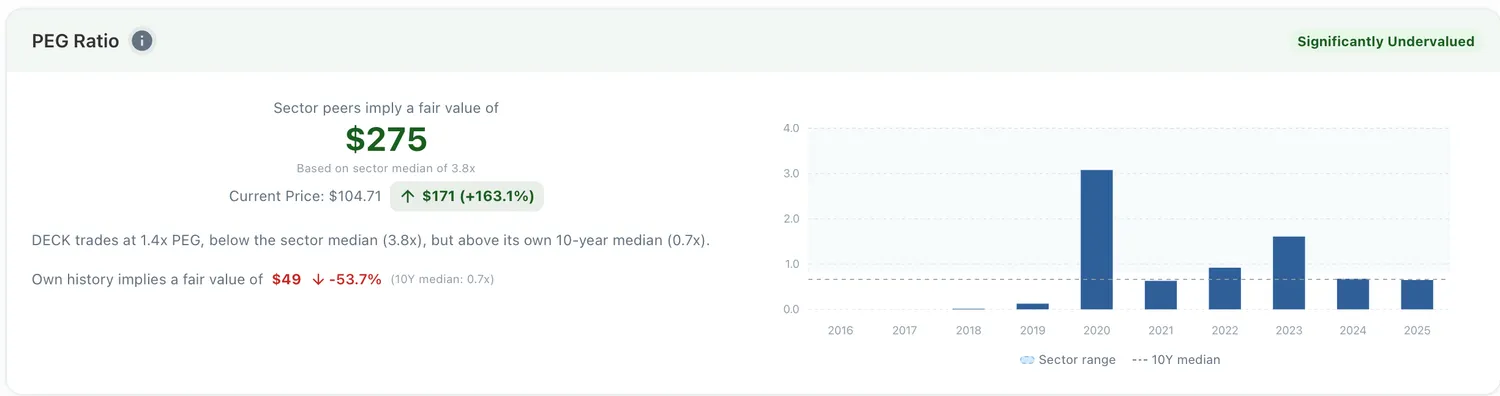
Figure 5: DECK's PEG Ratio
Free Cash Flow Yield
FCF yield shows annual free cash flow as a percentage of market capitalization. Higher yields indicate better cash returns. Comparing FCF yield to bond yields or dividend yields reveals whether stock pricing offers attractive cash generation relative to alternatives.
DECK generates a 6.1% FCF yield, with a peer-implied value of $142, representing 36% upside. The sector median yield of 4.5% means DECK generates more cash per dollar of market cap than most consumer cyclical peers. The historical median yield of 5.9% implies $109, roughly in line with the current price, suggesting DECK's cash generation is near its own historical norms.
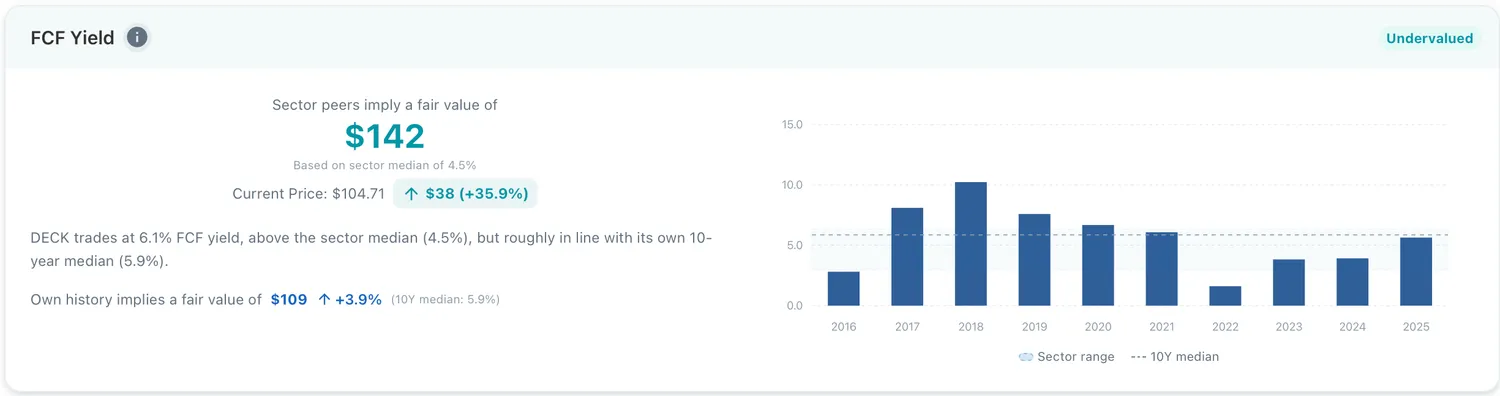
Figure 6: DECK's Free Cash Flow Yield
EV-to-EBITDA
EV/EBITDA divides enterprise value by earnings before interest, taxes, depreciation, and amortization. This multiple removes capital structure and accounting policy differences, enabling pure operating performance comparison. Quality businesses typically trade at 8-15x EBITDA.
DECK shows EV/EBITDA of 9.9x, with a peer-implied value of $159, representing 52% upside. The sector median of 15.7x places DECK in the 83rd percentile, cheaper than most of the consumer cyclical sector on an EBITDA basis. The historical median of 11.5x implies $120, also above the current price, confirming DECK trades below both peer and historical norms on this measure.
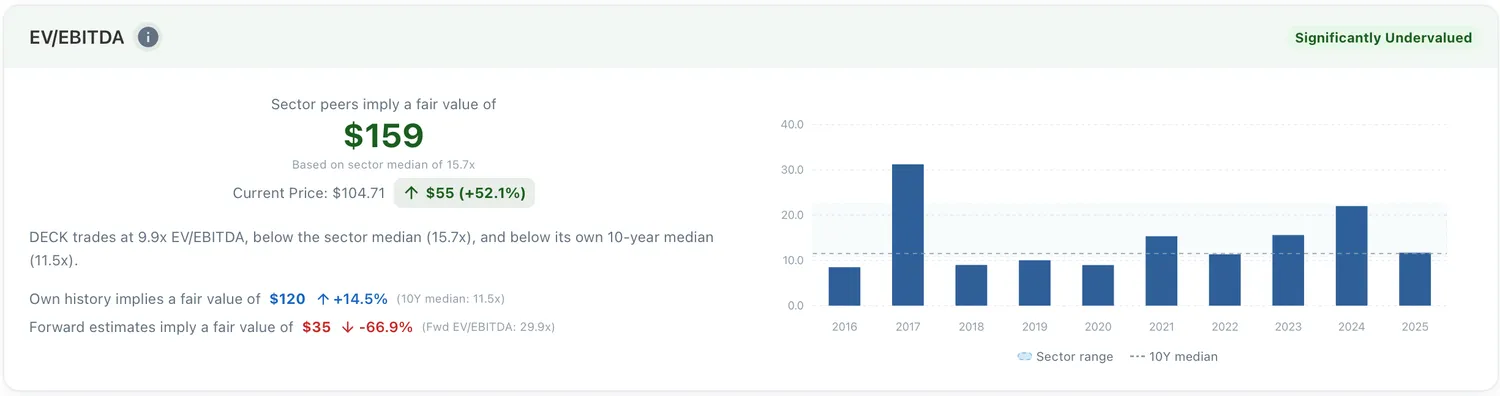
Figure 7: DECK's EV-to-EBITDA
EV-to-Free Cash Flow
EV/FCF shows total enterprise value relative to free cash flow generation. This captures how many years of current cash flow would equal the cost to acquire the business including debt assumption. Lower EV/FCF indicates cheaper cash flow valuations.
DECK's EV/FCF of 14.5x produces a peer-implied value of $211, representing 101% upside. The sector median of 31.1x places DECK in the 89th percentile on this multiple within its sector on an enterprise cash flow basis. The historical median of 15.5x implies $111, close to the current price and suggesting DECK's enterprise cash flow valuation is near its own norms.
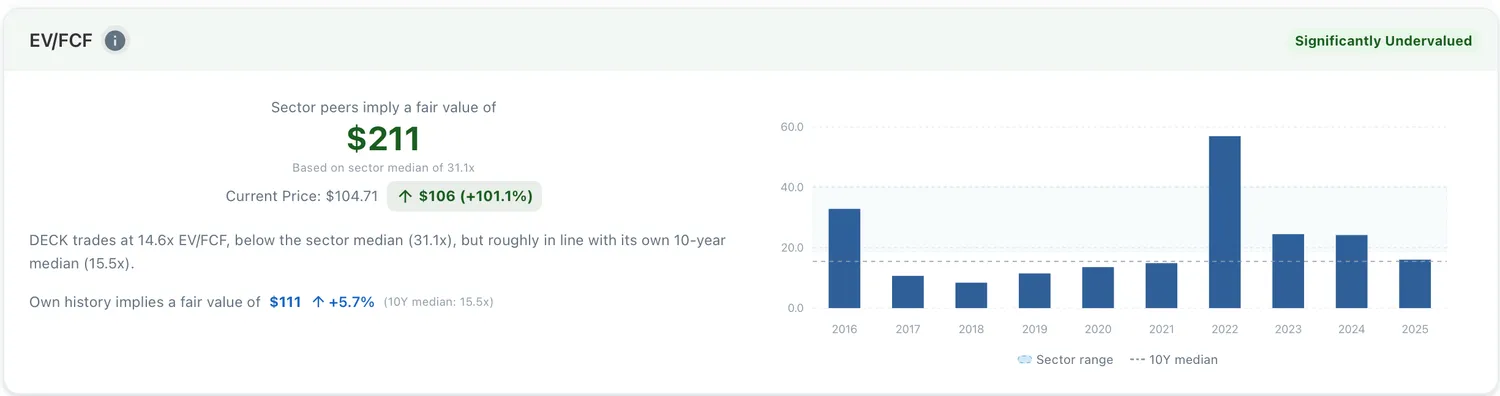
Figure 8: DECK's EV-to-Free Cash Flow Ratio
Additional Valuation Multiples
Five supplementary multiples provide further perspective. These are available on the platform in an expandable section for deeper analysis.
Price-to-Book Ratio: DECK shows P/B of 5.9x against a sector median of 5.8x, producing a peer-implied value of $103, roughly equal to the current price. This near-parity indicates DECK's price is close to the peer-implied value on a book value basis, though the historical median of 4.5x implies $80, below the current price.
Price-to-Sales Ratio: DECK trades at P/S of 2.8x against a sector median of 2.1x, implying a peer-implied value of $78, below the current price. On a revenue basis, DECK trades at a premium to its sector, reflecting its superior margins and profitability that justify paying more per dollar of revenue.
Price-to-Free Cash Flow: At 16.4x free cash flow, with a sector median of 22.4x, the peer-implied value is $143, representing 36% upside. The historical median of 17.1x implies $109, close to the current price.
EV-to-EBIT: DECK shows EV/EBIT of 10.0x against a sector median of 20.3x, producing a peer-implied value of $200, representing 91% upside. DECK ranks in the 96th percentile on this multiple within its sector on operating earnings.
EV-to-Sales: At EV/Sales of 2.5x versus a sector median of 2.9x, the peer-implied value is $119, a modest 13% above the current price. The historical median of 2.0x implies $87.
The Implied Value Summary
The overall valuation scorecard brings together all 10 multiples in a horizontal bar chart, showing the peer-implied value from each metric side by side. A vertical reference line marks the current price and a dashed line marks the median implied value across all multiples. This visualization immediately reveals whether the balance of evidence points toward the price sitting below or above the model estimates.
For DECK, the majority of peer-implied values sit above the current price, with the composite median of $151 indicating our model estimates the price is below its peer-implied value relative to the consumer cyclical sector. This aligns with the DCF intrinsic value estimate of $175.
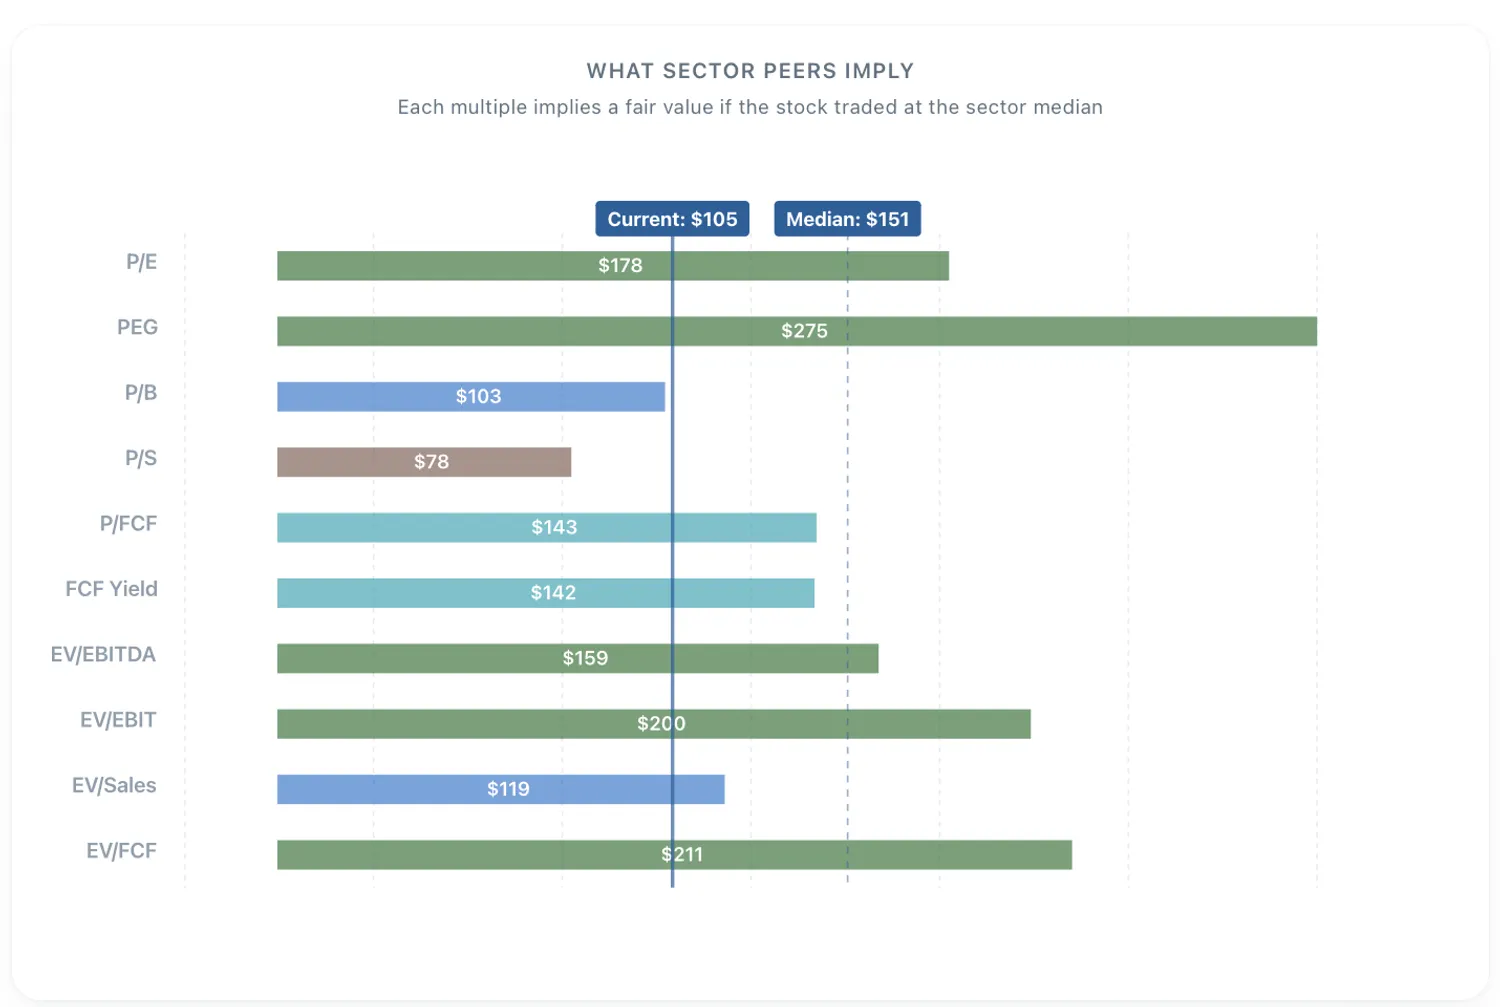
Figure 9: DECK's Valuation Summary showing peer-implied values from all 10 multiples, current price reference line, and median implied price.
Bringing It Together: DCF and Multiples Alignment
The overall valuation score blends DCF intrinsic value (50%) with the multiples composite implied price (50%). The gauge card displays three reference points: the DCF estimate, the multiples estimate (median across all peer-implied prices), and a blended estimate with overall upside percentage.
DECK shows DCF intrinsic value of $175 versus $105 market price (67% upside). The multiples composite of $151 adds 44% upside. The blended estimate of $163 (56% above the price) shows our model estimates the price is below its intrinsic-value estimate from both independent approaches. When DCF and peer-relative multiples align, as they do here, the signal strengthens.
When DCF and Multiples Diverge
Sometimes the two approaches tell different stories. These divergences reveal important tensions between fundamental value and market pricing.
Microsoft presents an instructive case. MSFT trades at $399 with DCF value of $545, indicating 37% upside. The model projects 22.9% revenue growth over five years based on analyst consensus, driven by Azure cloud and AI services expansion. Yet the multiples analysis tells a different story: peer-implied values from the composite sit at $283, suggesting 29% downside relative to sector peers.
DCF, which explicitly models Microsoft's growth trajectory over 10 years, sees significant value in the ability to compound revenue at 20%+ rates. Peer multiples, which compare current-year ratios against technology sector competitors, see a premium. The divergence frames the question: if you believe Microsoft's AI-driven growth will sustain, the DCF case is compelling. If current multiples already price in that growth, the peer comparison suggests patience. The blended view ($414, roughly 4% upside) puts the price roughly in line with the blended estimate.
The platform provides the framework for asking the right questions, not definitive answers. Valuation provides the quantitative foundation. Investment decisions require combining this with quality, peer positioning, analyst sentiment, and ownership behavior.
Explore valuation for any S&P 1500 company with our Valuation tool. The page presents complete DCF modeling with assumptions visible, plus implied values from nine valuation multiples showing peer, historical, and forward perspectives. From there, examine Quality, Peers, Analysts, and Holdings to build the complete picture.
DCF valuations based on trailing twelve month data, 10-year historical financials, and consensus analyst estimates as of March 2026. WACC calculated using company-specific market data from FMP (Financial Modeling Prep): beta, risk-free rate, equity risk premium, cost of debt, and capital structure weights. Valuation multiples from TTM financial data. Data sourced from 10-K filings via Financial Modeling Prep API.
This article is for educational purposes only and does not constitute investment advice. Always conduct your own research and consider consulting with financial professionals before making investment decisions.