
Building a Professional-Grade DCF Valuation Engine for Retail Investors
How we built a transparent, interactive DCF valuation engine using analyst consensus growth, FMP market data, and exponential growth tapering.
TL;DR: Frustrated with black-box DCF calculators that break on realistic assumptions, we built a transparent, interactive valuation engine using analyst consensus growth analysis, market-based WACC from FMP data, and exponential growth tapering. This article breaks down the technical approach and demonstrates why methodology matters in financial modeling.
Why Most DCF Tools Fail Investors
We've always been frustrated by the poor quality of online DCF calculators. These tools are supposed to help investors estimate a company's value, but they consistently fall short in four critical areas.
Problem 1: Technical Oversimplification
Most online DCF calculators are overly simplistic from a technical standpoint. They typically use a single growth rate with an abrupt drop to terminal growth, hardcoded discount rates that don't reflect company-specific risk, and provide no mechanism for realistic growth transitions. This isn't just an academic concern. These technical limitations make the tools essentially useless for the purpose for which DCF analysis is done.
Problem 2: No User Control
Most tools offer no user control over the analysis. You can't adjust growth rates, discount rates, or test different scenarios. You're stuck with whatever defaults the calculator uses, with no way to incorporate your own research or market views. This is particularly frustrating as you might have spent weeks researching a company's competitive position and growth prospects, only to have a calculator ignore your insights entirely.
Problem 3: Opaque Methodology
The methodology used by most calculators is completely opaque. You're left guessing whether they used analyst estimates, historical data, or arbitrary defaults, with no visibility into calculations or assumptions. This black-box approach is antithetical to good investing. Warren Buffett famously said he only invests in businesses he understands. The same principle should apply to the valuation tools we use.
Problem 4: Uninterpretable Results
Results are uninterpretable. You get a single number with no explanations or component breakdown. It's impossible to understand if the result is reliable or how much weight to give it in your investment decision. Without understanding which assumptions drive the result, you can't stress-test your analysis or build conviction in your investment thesis.
The Solution: Professional-Grade Methodology Made Accessible
We wanted to create something that actually reflects how institutional analysts approach valuations while giving users full transparency and control. We also wanted to make sophisticated DCF analysis accessible and interpretable for retail investors who deserve the same quality tools as professionals. Our approach addresses each problem systematically, using robust techniques implemented in an intuitive, educational interface.
1. Analyst-Driven Growth Analysis
The Problem: Simple calculators assume constant growth rates based on arbitrary defaults or historical averages that miss forward-looking shifts in a company's trajectory.
Our Solution: We use an analyst-consensus-first approach that prioritizes forward-looking data over backward-looking extrapolation.
The growth rate is the single most impactful assumption in any DCF model, and getting it right matters enormously. Our engine uses a two-tier approach:
-
Primary: Forward Analyst CAGR. When sufficient analyst coverage exists (3+ analysts covering 2+ forward years), we calculate the compound annual growth rate implied by analyst revenue consensus from the last reported fiscal year to the furthest forward estimate. This captures analysts' collective view of the company's growth trajectory, incorporating competitive dynamics, addressable market expansion, and management guidance that historical data alone cannot reflect.
-
Fallback: Historical Revenue CAGR. When analyst coverage is insufficient, we calculate the 5-year (preferred) or 3-year (minimum) compound annual growth rate from historical revenue data. This provides a data-driven baseline when forward-looking estimates aren't available.
Each growth estimate includes:
- Confidence Scoring: Based on analyst coverage depth, helping users understand the reliability of projections.
- Source Attribution: Clear labeling of whether growth derives from analyst consensus or historical patterns.
- Coverage Score: Proportion of forecast years covered by analyst estimates.
2. Realistic Growth Transitions Instead of Cliff Effects
The Problem: Unrealistic instant transitions from high growth to terminal rates.
Our Solution: Two-phase growth model with exponential tapering that mathematically ensures smooth, realistic transitions.
Rather than dropping from 20% growth to 3% overnight (a common flaw in simple DCF models), our approach uses a two-phase structure:
- Phase 1: High-Growth Period. Uses analyst consensus or historical growth rates during the initial forecast years (typically 3-5 years).
- Phase 2: Exponential Tapering Period. Mathematically controlled decay toward terminal growth using exponential functions.
The exponential decay function creates realistic growth transitions:
Growth Rate at Time t = Terminal Growth + (Initial Gap x e^(-lambda x t))
Where:
- Initial Gap = Phase 1 Final Growth - Terminal Growth
- lambda = Decay constant calculated to reduce the gap to ~1% of its original size by the end of the tapering period
- t = Time elapsed in the tapering phase
The algorithm calculates lambda such that by the end of the tapering period, 99% of the original growth gap has been eliminated. This prevents both unrealistic cliff effects and eternal high-growth assumptions.
Why this matters for valuation:
- Eliminates artificial volatility in terminal value calculations
- Reflects business reality as companies don't instantly mature overnight
- Reduces model sensitivity to the specific choice of terminal growth rate
- Creates smoother cash flow projections that better represent actual business transitions
This exponential tapering approach transforms DCF from a crude two-stage model (high growth to terminal) into a two-phase framework with exponential tapering, capturing the gradual maturation process that characterizes real business lifecycles. Our DCF walkthrough of Meta shows both phases running on a real company.
3. Market-Based WACC from FMP Data
The Problem: Static discount rates that don't reflect company-specific risk or prevent mathematical errors.
Our Solution: Company-specific WACC calculation using Financial Modeling Prep (FMP) market data with automatic safeguards and proper risk adjustments.
The discount rate is arguably the most critical input in any DCF model, yet most online calculators treat it as an afterthought. We use FMP's CustomDCF data to build company-specific WACC calculations:
Beta: We use FMP's company-specific beta directly. This is the regression beta calculated from the company's actual stock price movements against the market. Using company-specific beta avoids the distortions that come from industry-average approaches, which can inflate beta for large, stable companies and deflate it for small, illiquid ones.
Risk-Free Rate and Equity Risk Premium: Both sourced from FMP's current market data, ensuring our discount rates reflect current market conditions rather than static assumptions.
Capital Structure: FMP provides current debt and equity weightings based on market values. For financial sector companies, we use a standardized 15/85 debt/equity split since their debt represents operational capacity rather than financing leverage.
Country Risk Premium: For ADR stocks, we automatically apply country-specific risk premiums to account for additional risk from operating in emerging or frontier markets.
Safeguards: The engine enforces a minimum 2% spread between WACC and terminal growth to prevent mathematically extreme terminal value multiples. WACC floors of 6% (general) and 8% (financial sector) prevent unrealistically low discount rates.
Every WACC calculation includes complete documentation of data sources and calculation methodology. This transparency allows users to understand exactly how their discount rate was derived.
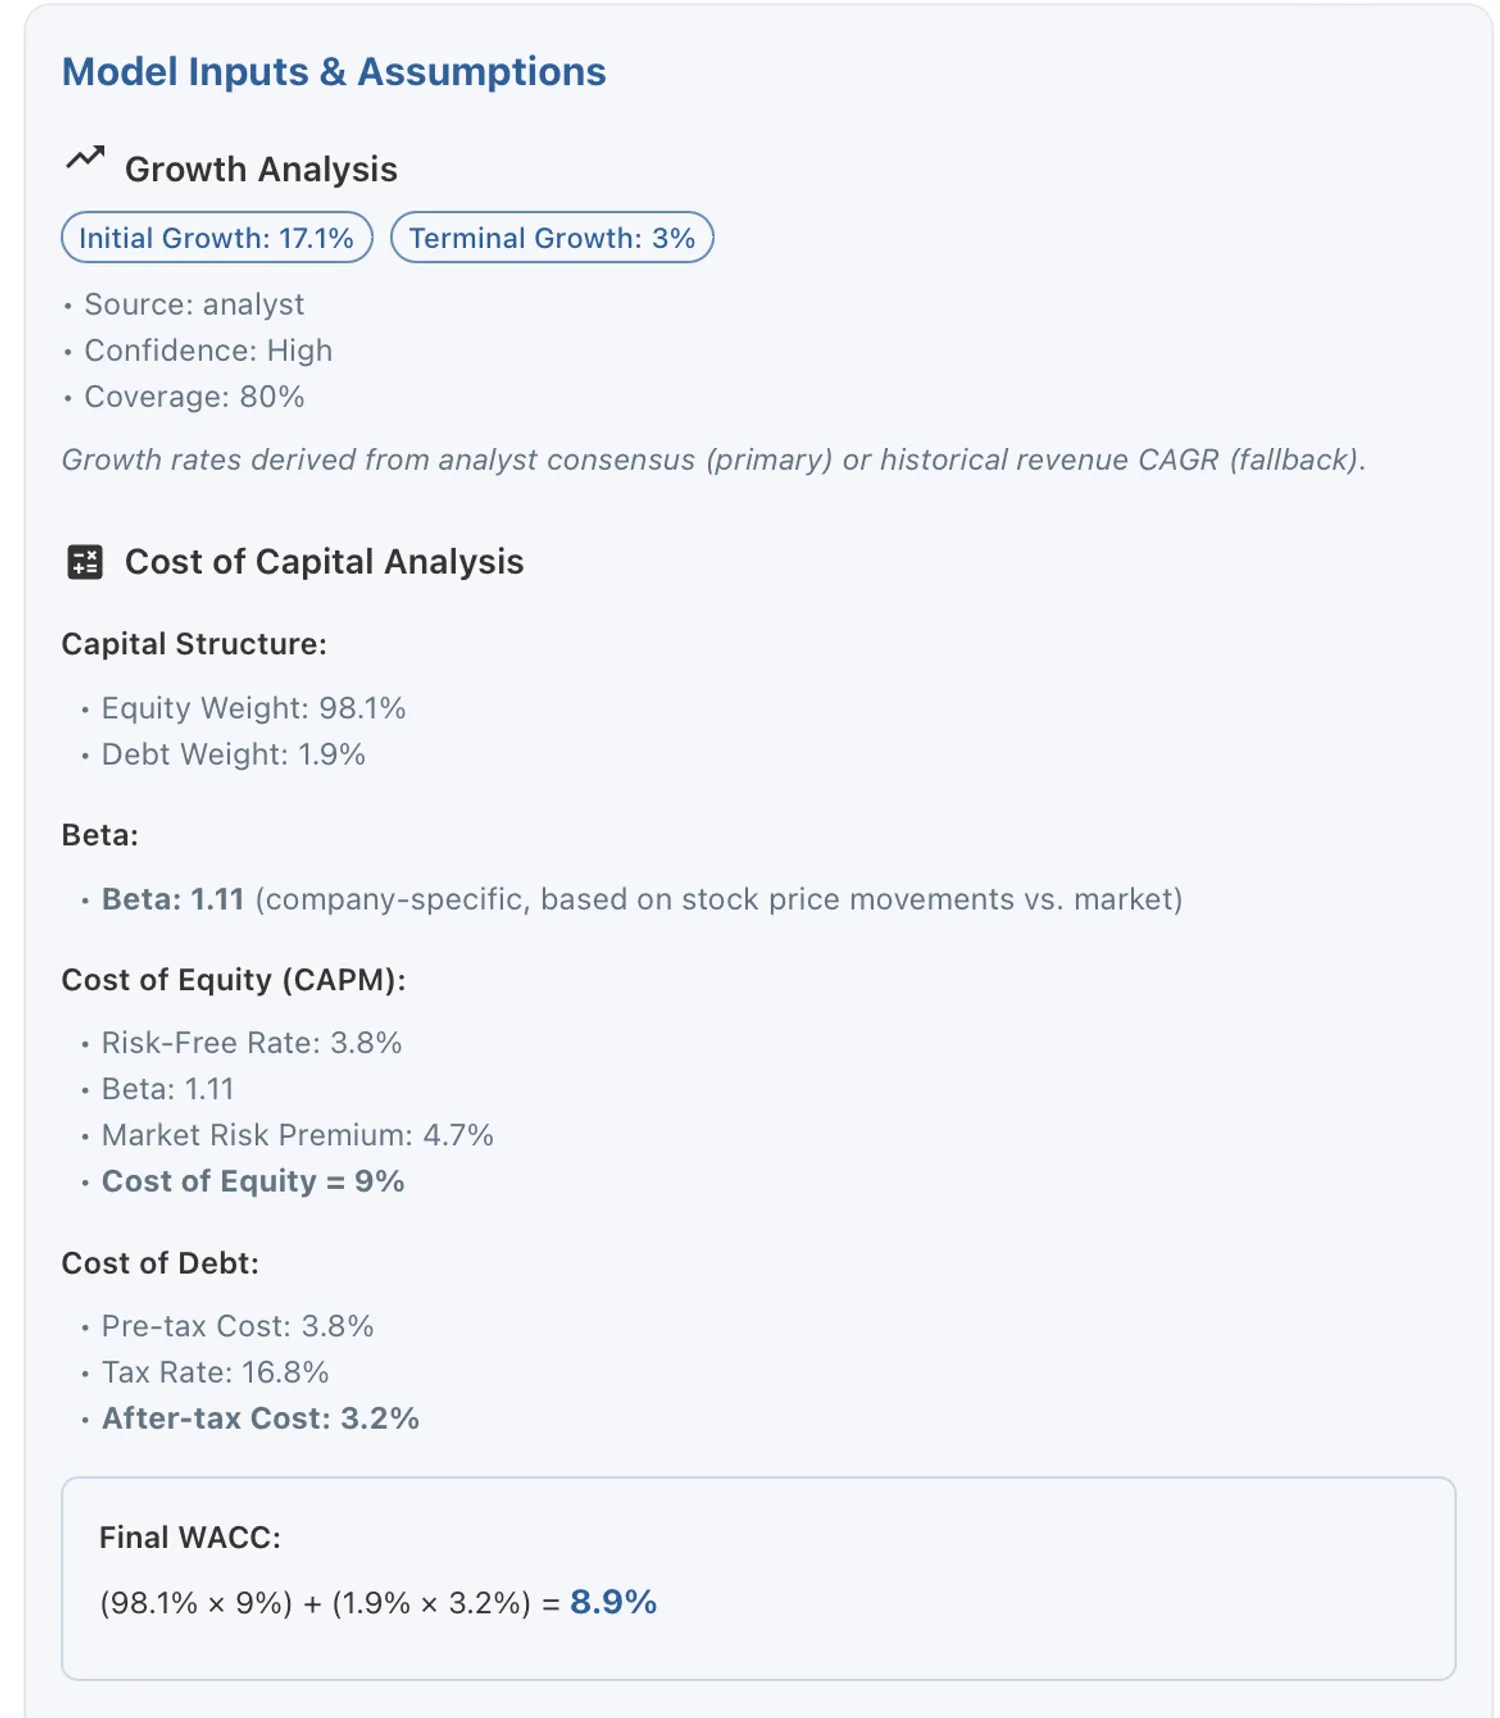
Figure 1: Complete WACC interface displaying all calculation components including capital structure, beta, cost of equity, cost of debt, and final rate, with clear distinction between model values and user customizations.
4. Interactive Parameter Control Instead of Black Box Results
The Problem: No ability to adjust assumptions or test scenarios.
Our Solution: Real-time parameter adjustment with educational context and automatic validation.
Our interface puts users in control through:
- Responsive sliders and inputs that immediately show valuation impact
- Contextual tooltips explaining each parameter's significance and typical ranges
- Automatic validation that prevents common mathematical errors (like terminal growth exceeding WACC)
- Clear indicators in the output showing whether you're using model-calculated or custom assumptions
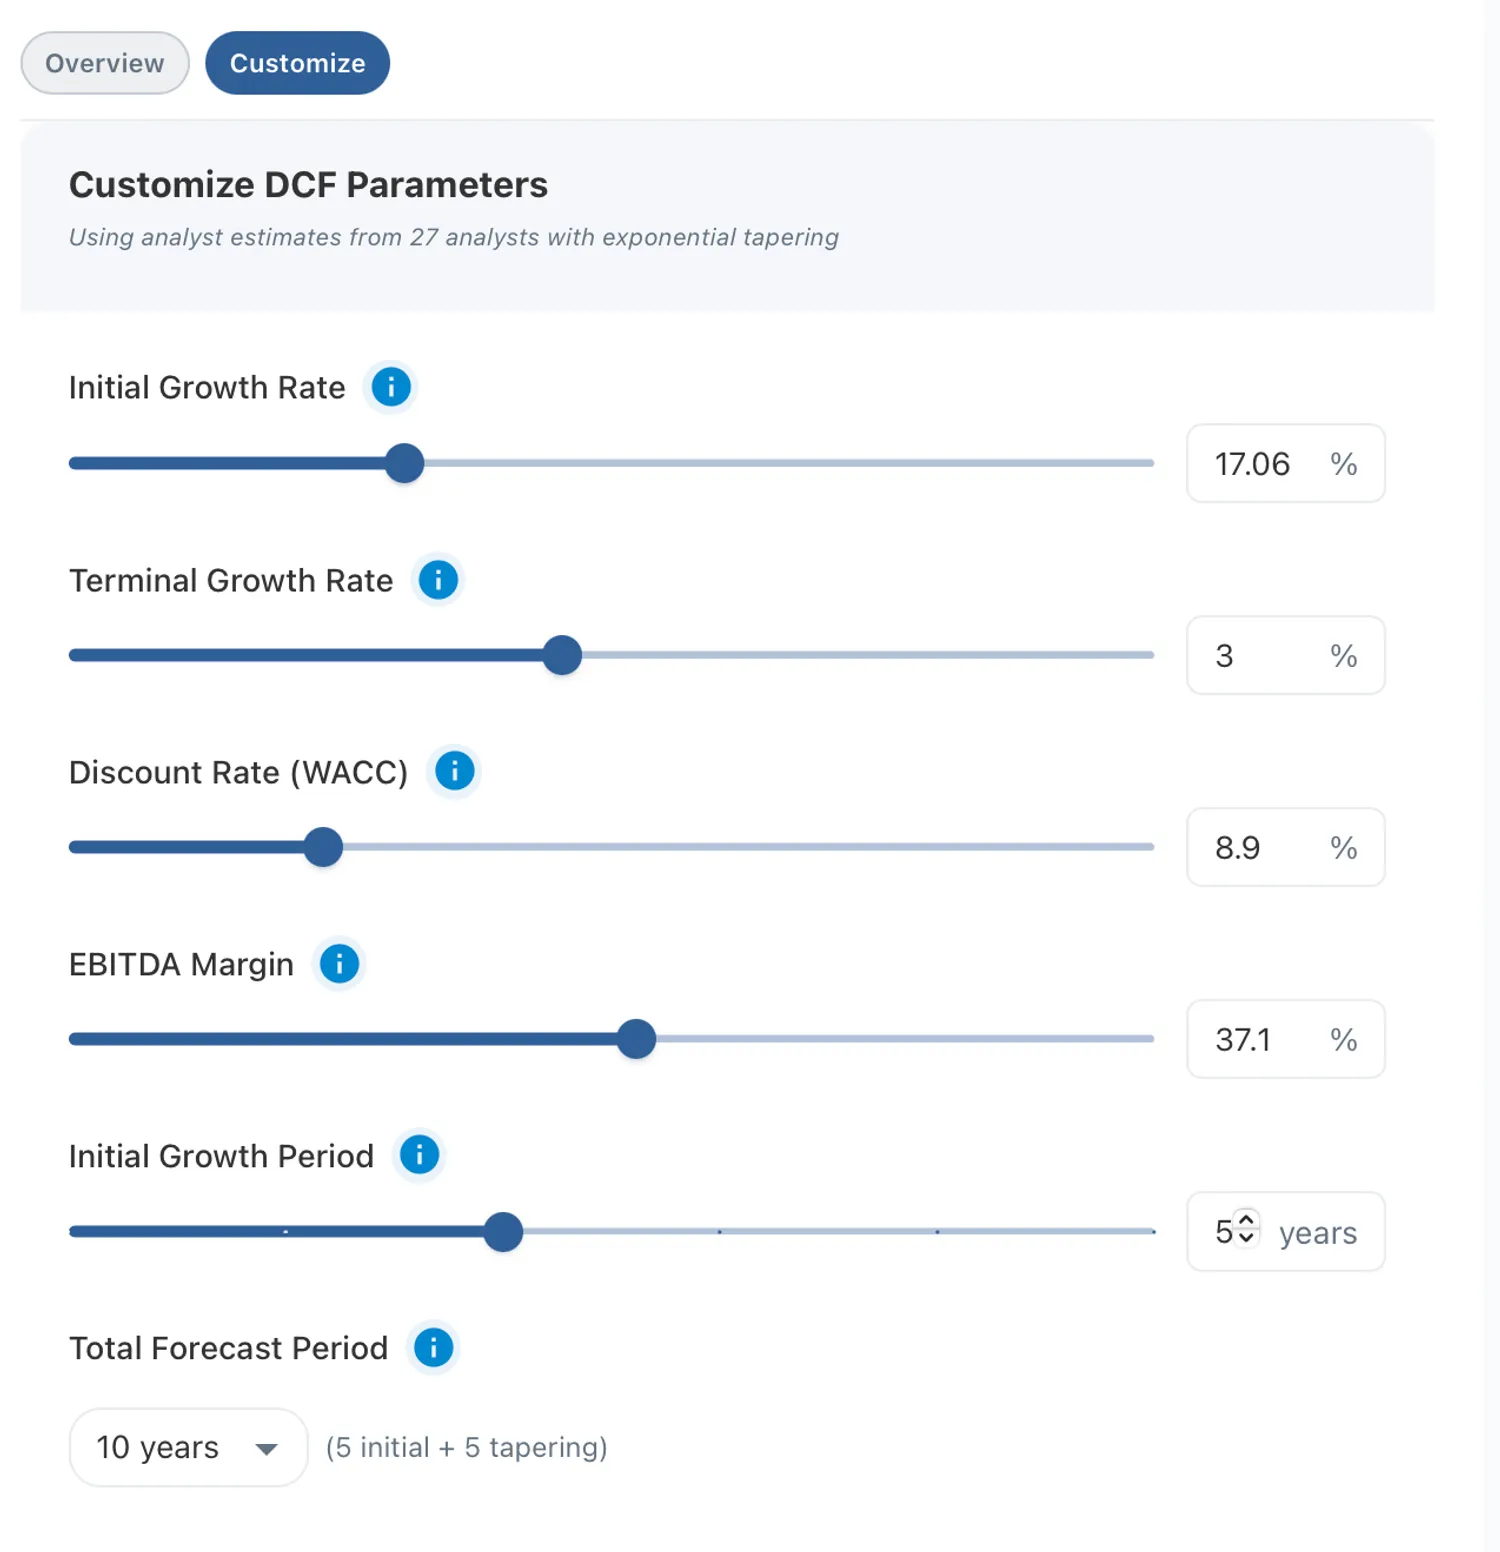
Figure 2: Interactive parameter controls. Users can adjust growth rates, discount rates, and other assumptions in real-time to see immediate impact on valuation results.
Educational value: Users learn DCF sensitivity and build intuition about which assumptions matter most. For example, adjusting WACC from 6% to 7% might change valuation by 20%, while tweaking growth by 5% might only have a little impact.
5. Interpretable Results Instead of Single Numbers
The Problem: Results showing single numbers without any information about how to interpret them.
Our Solution: Our interface assumes users want to learn, not just get an answer. Rather than just showing "$251.46 per share," we describe the results in plain English, showing:
- Current price vs. intrinsic value with percentage difference
- Confidence level (High/Medium/Low) based on data quality
- Key assumptions that drive the result
- Comparison context indicating how the result compares to the current market price
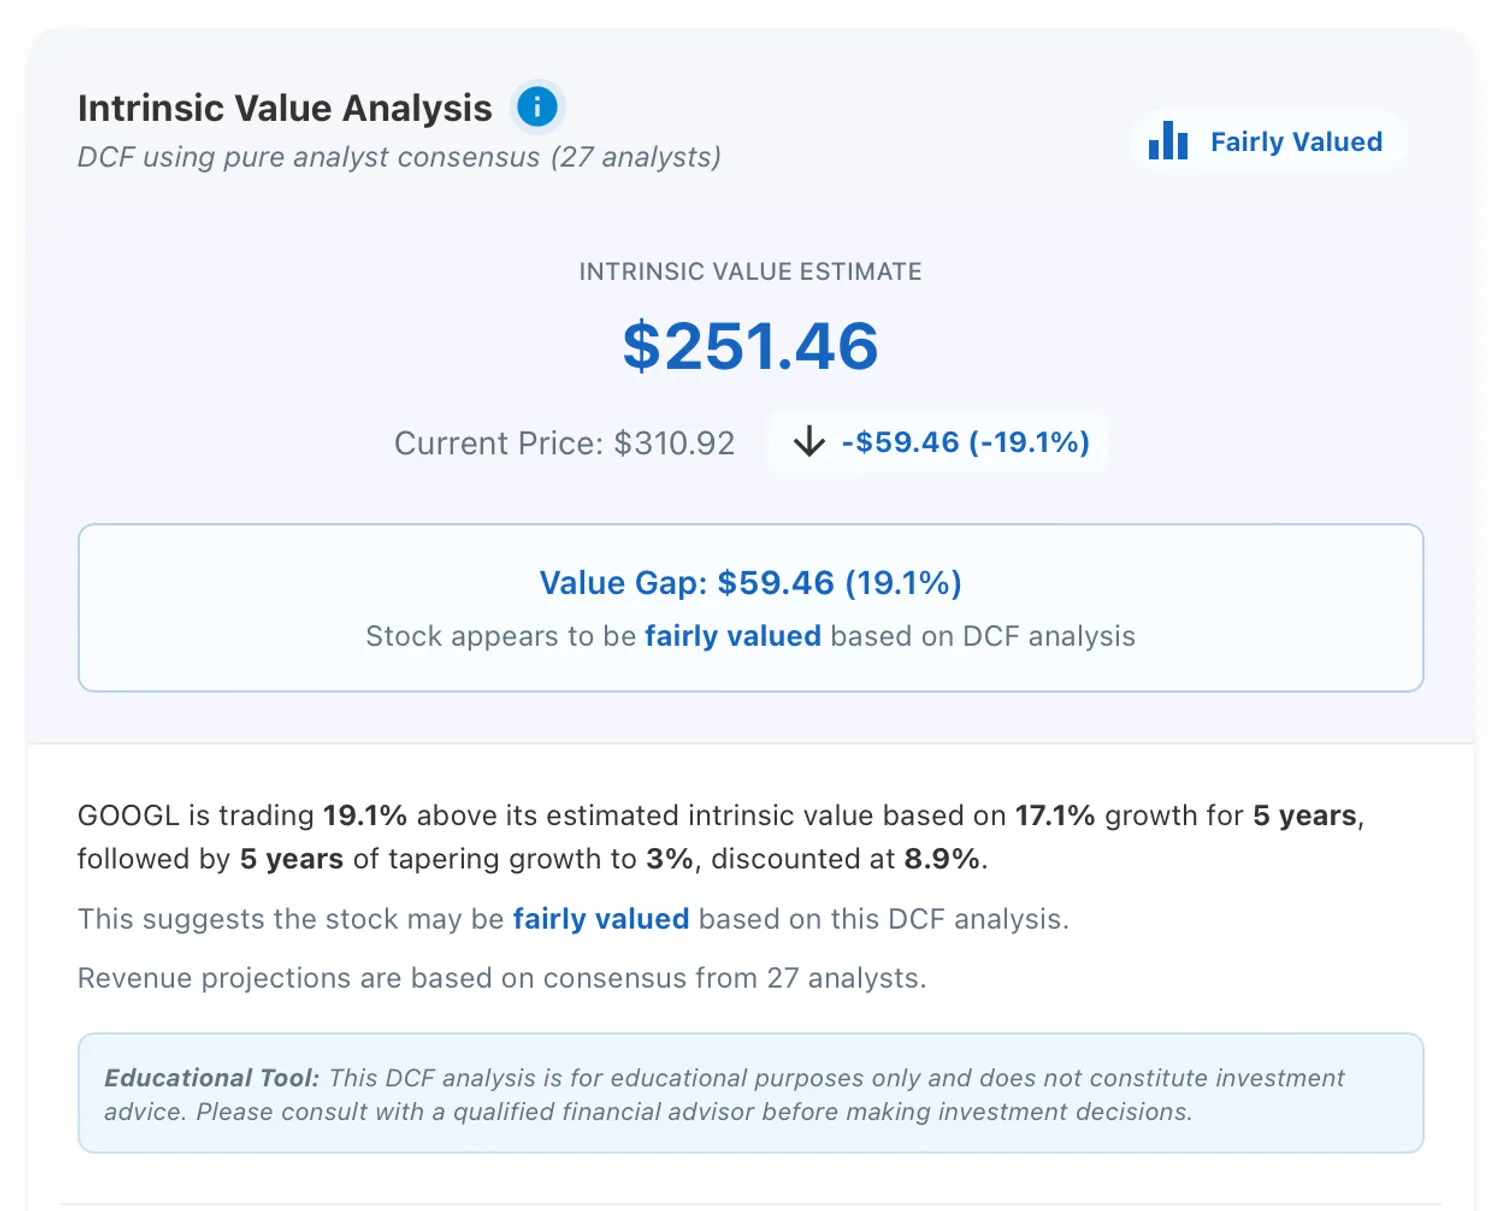
Figure 3: Valuation results card displaying intrinsic value estimate, current market price, percentage gap, and plain English interpretation of the results.
6. Full Methodology Transparency Instead of Hidden Calculations
The Problem: Black-box calculations with no visibility into assumptions or methodology.
Our Solution: Comprehensive transparency with expandable calculation breakdowns. Results are presented with multiple levels of detail.
Every component is documented:
- Quick Summary: Current price vs. intrinsic value.
- Growth Analysis: Shows growth rates, confidence levels, and data source (analyst consensus or historical CAGR).
- WACC Breakdown: Details the capital structure, beta, cost of equity, cost of debt, and WACC breakdown with FMP data sources.
- Operational Assumptions: Shows EBITDA margin and forecast periods.
- Cash Flow Projections: Year-by-year revenue, growth rates, free cash flow, and present values.
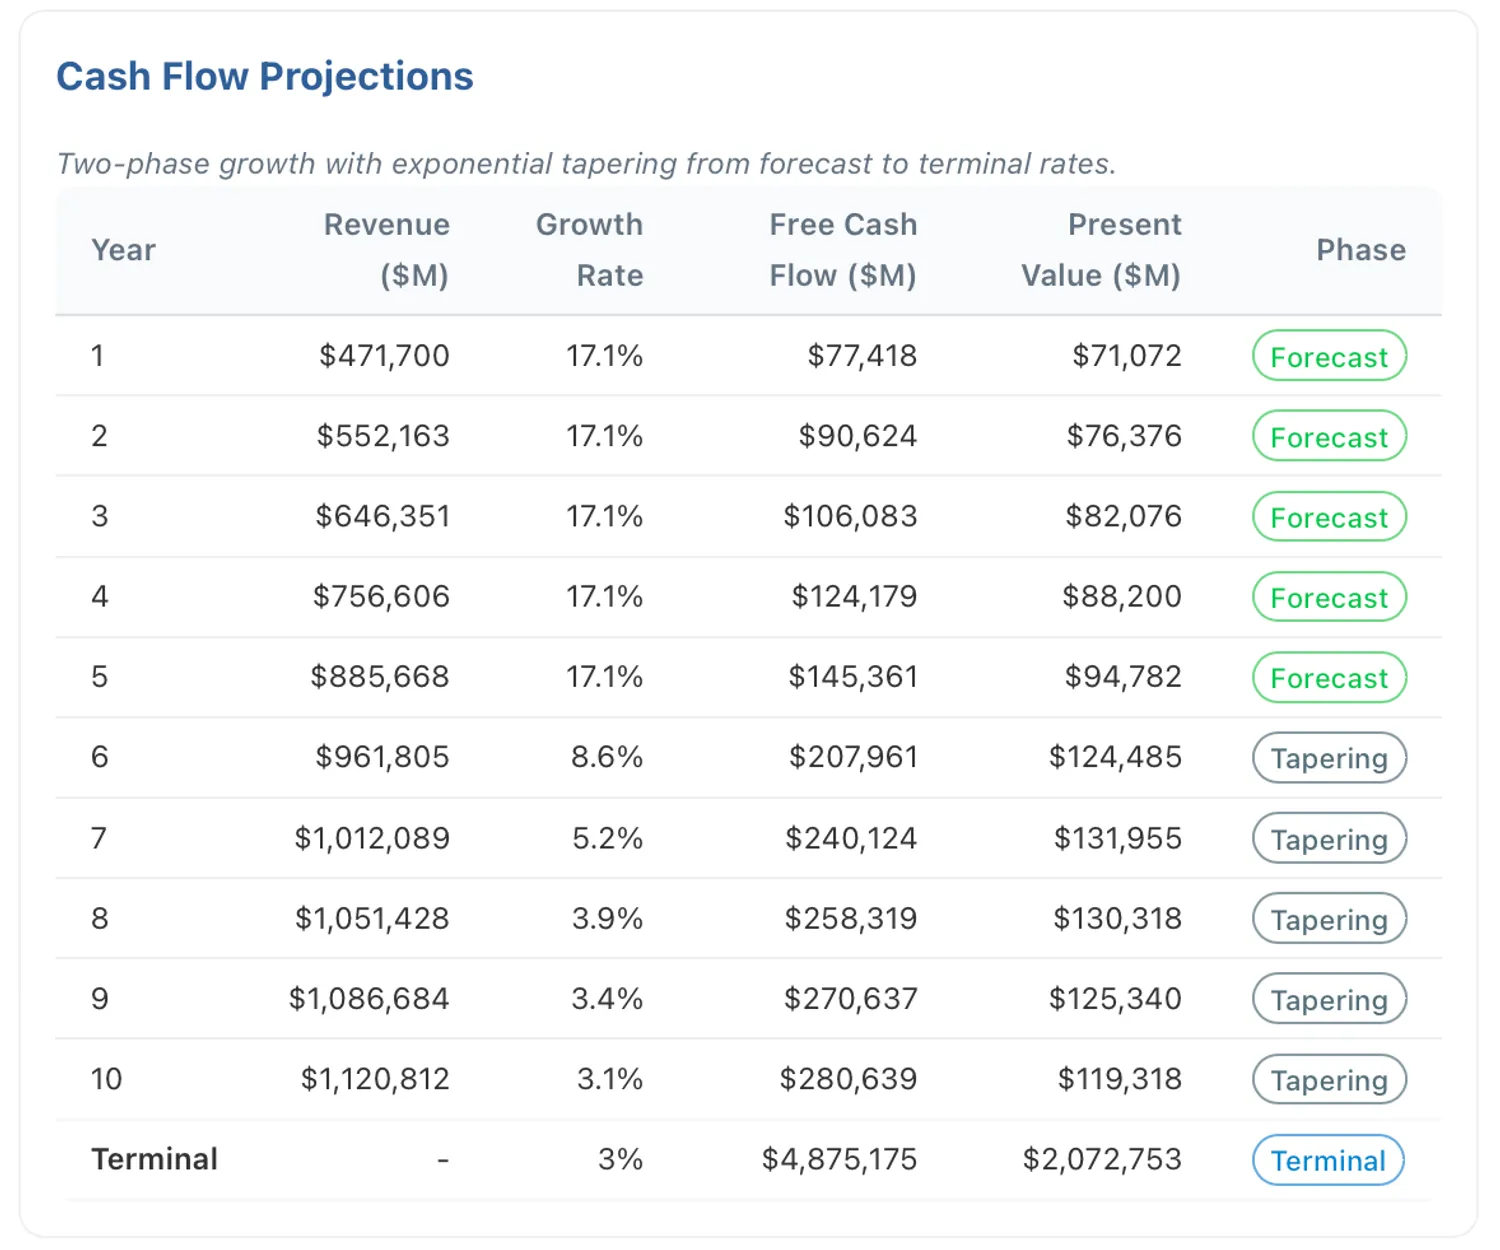
Figure 4: Cash flow projections showing detailed annual projections of revenue growth, free cash flow generation, and present value calculations.
- Valuation Summary: Present values, enterprise value, equity value, and value per share.
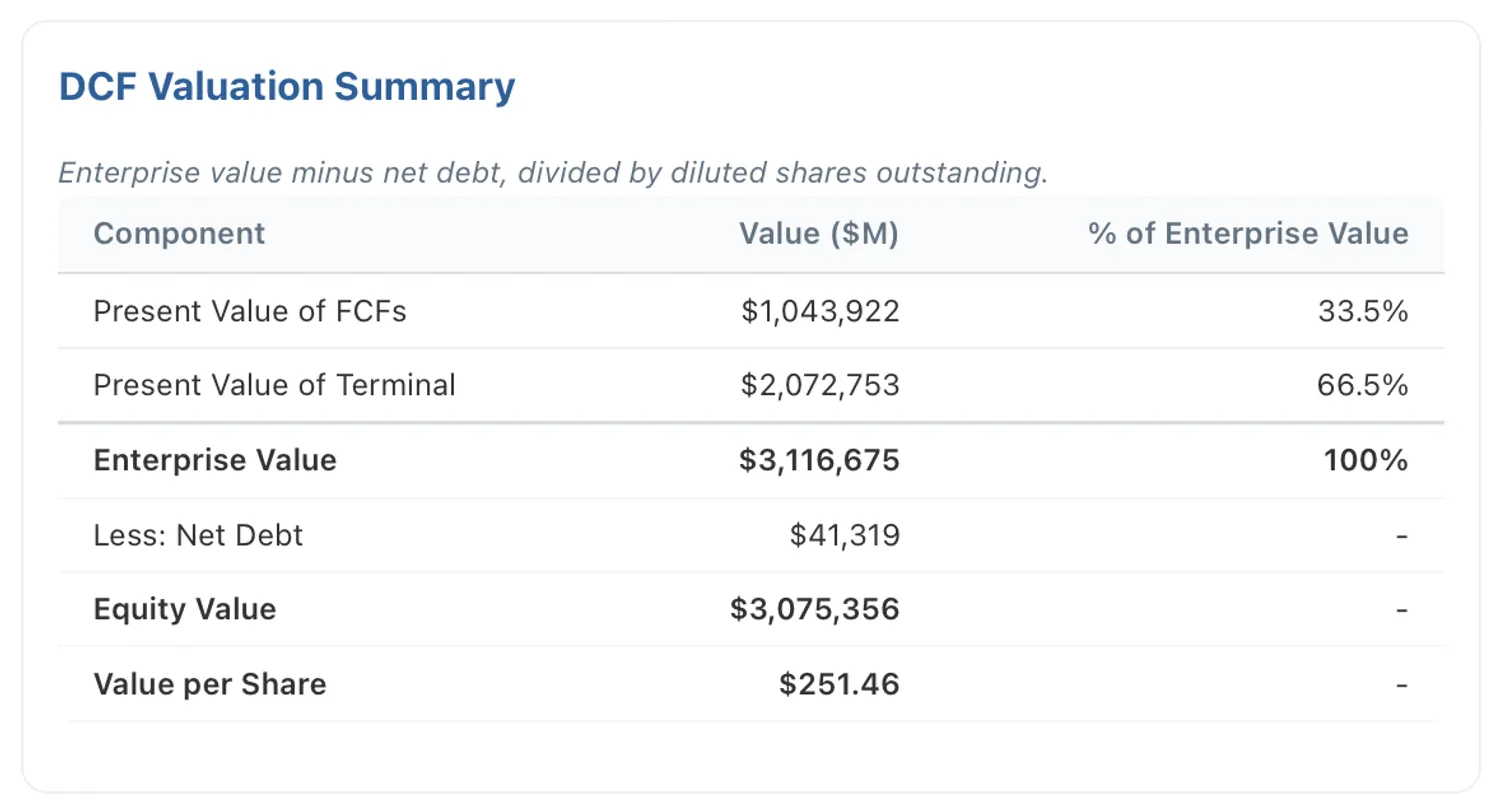
Figure 5: Valuation summary showing aggregated present values leading to enterprise value, equity value, and resulting value per share.
7. Industry-Specific Modeling: Beyond One-Size-Fits-All DCF
The Problem: Forcing every company into the same DCF framework, regardless of industry characteristics.
This approach fails for financial institutions, where traditional "free cash flow" concepts break down entirely. For banks and financial services companies, cash flow is really lending capacity regulated by capital requirements, making standard DCF analysis inappropriate.
Our Solution: Our engine automatically detects financial institutions and switches to a Dividend Discount Model (DDM) approach. This methodology focuses on the bank's ability to generate sustainable dividends rather than traditional operating cash flows. By using industry-appropriate models, we provide more accurate valuations while maintaining the same user-friendly interface and transparent methodology that characterizes our DCF implementation.
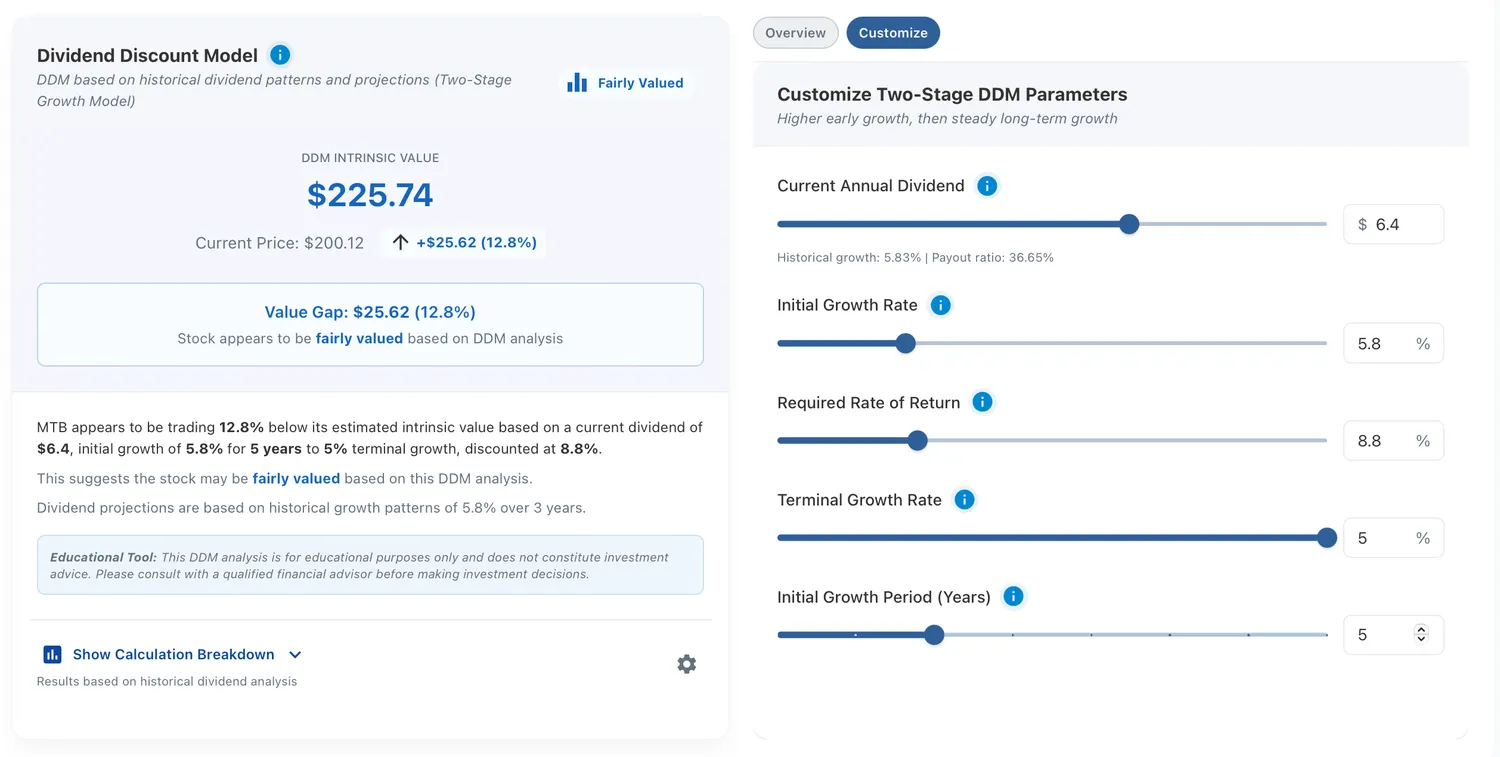
Figure 6: Automatic model selection. The tool detects financial institutions and defaults to DDM analysis, displaying one of three DDM models with user options to switch between alternatives.
This industry-specific approach represents a fundamental shift from the "one model fits all" mentality of existing tools toward a more sophisticated, context-aware valuation platform that adapts its methodology to match the economic reality of different business models.
Making Sophisticated Financial Analysis More Accessible
Building this DCF engine taught us that the gap between institutional-quality tools and retail investor resources is largely artificial. The mathematical techniques used by hedge funds and investment banks aren't inherently complex, but they're generally hidden behind expensive platforms and proprietary interfaces.
Our approach proves that sophisticated financial modeling can be both accessible and educational. By providing transparency, interactivity, and proper validation, we can give individual investors the same analytical capabilities that professionals take for granted.
The democratization of sophisticated financial analysis isn't just about building better tools. It's about empowering individual investors to make more informed decisions and level the playing field between retail and institutional players.
Explore the valuation engine for any S&P 1500 stock on the Valuation Analysis page.
This article is for educational purposes only and does not constitute investment advice. Please consult with a qualified financial advisor before making investment decisions. All financial data and analysis are based on publicly available information and third-party data sources, which may contain errors or omissions. Past performance does not guarantee future results.