
Nine Tools Grade Business Quality. None of Them Means the Same Thing.
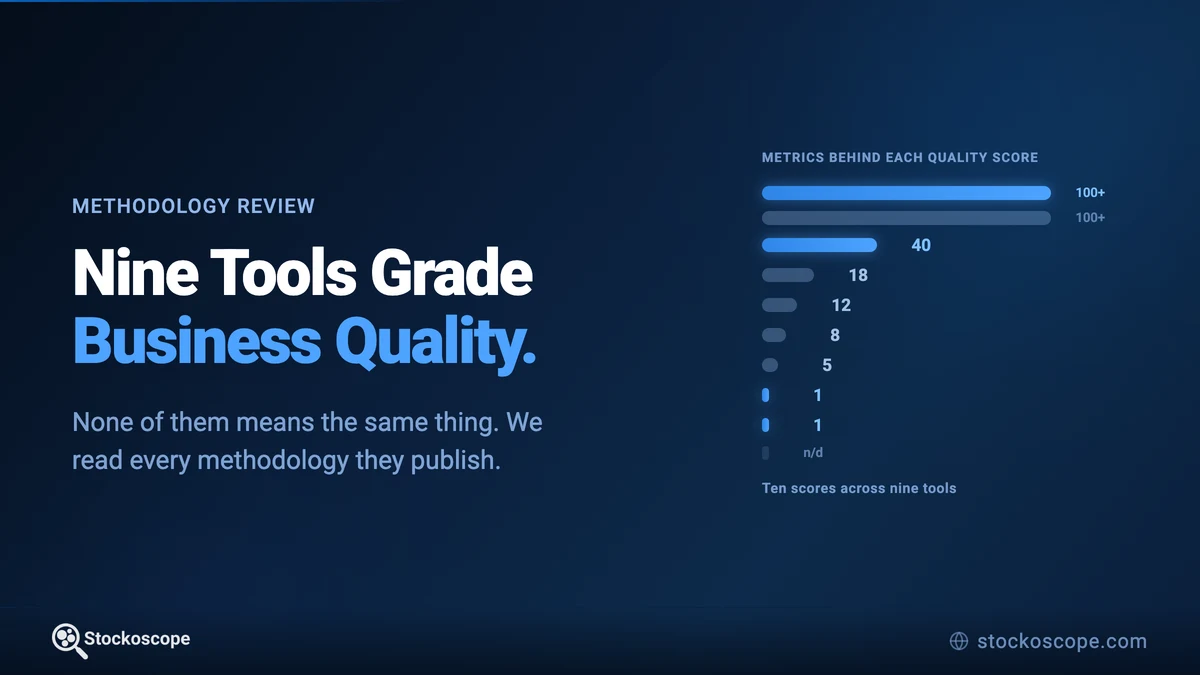
One tool scores quality on a single metric. Another says it uses over a hundred. Five of the nine put the share price inside the score. We read every published methodology to find out what these numbers actually measure.
Open almost any stock analysis tool and something will tell you whether a company is any good. A 71 out of 100. A B. A five-pointed shape. Four stars.
Put nine of them side by side and the numbers turn out to be answering different questions. Not slightly different: one tool grades quality on a single financial metric, another on more than a hundred. Five of the nine include the share price inside the score, so a company can become higher quality because its stock fell. One grade moves daily on price volatility with nothing in the accounts having changed.
We read every published methodology to work out what each number is actually counting.
Disclosure: we make one of the nine tools. It is described on exactly the same criteria as the rest, including where it falls short. We have no affiliate or commercial relationship with any tool named and earn nothing if you use them. intrinsiqq and Stockoscope have agreed to reference each other's methodology; no payment is involved.
Even the experts can't agree
The disagreement starts well above the software.
Warren Buffett's version is about durability:
"The key to investing is not assessing how much an industry is going to affect society, or how much it will grow, but rather determining the competitive advantage of any given company and, above all, the durability of that advantage." Fortune, 22 November 1999
Clear enough as an idea. Now turn it into a number.
Robert Novy-Marx argues for one metric, gross profits over total assets, because "the farther down the income statement one goes, the more polluted profitability measures become". Asness, Frazzini and Pedersen use three composites, Profitability, Growth and Safety, built from sixteen measures. Joseph Piotroski uses nine binary signals, and says plainly they are not the optimal set.
The index providers are no better. MSCI builds Quality from return on equity, debt to equity and earnings variability. S&P uses return on equity, an accruals ratio and a leverage ratio. Two of the world's largest index providers, both selling something called Quality, agree on only one of their three named inputs, return on equity, though both also carry a leverage measure under different names. The two big quality ETFs that result overlapped on under half their holdings when last measured in January 2020.
Novy-Marx put it best: quality, unlike value, has no universally accepted definition, and quality strategies get identified by something closer to "you know it when you see it".
This is documented for index providers. Hsu, Kalesnik and Kose surveyed six of them in the Financial Analysts Journal and found that the correlations between those variables show no common underlying factor. Nobody, as far as we could find, has done the same for the tools ordinary investors actually use. So we did.
What we did
We started with fourteen retail platforms and kept the nine that compute their own quality-bearing score. Five compute nothing of the kind and were dropped: Finviz, Koyfin, StockAnalysis.com, TIKR and TradingView.
Everything below comes from the vendors' own methodology pages, help centres and published models, read in September 2026. No review sites. Every claim was then checked a second time against the live source by someone looking for errors rather than confirmation, which corrected six statements in an earlier draft.
Here is the whole field on one screen. Each tool links to the methodology page the claims were read from.
| Tool | What it calls it | Metrics | Valuation in? | Momentum in? | Benchmark | Weights published |
|---|---|---|---|---|---|---|
| Alpha Spread | Profitability, Solvency Scores | Not fully disclosed | No | No | Not stated | No |
| Finbox | Financial Health | "over 100", account required | Yes | Yes | Sector, developed markets | No |
| GuruFocus | GF Score | 18 across five ranks | Yes | Yes | Not stated | No |
| intrinsiqq | Quality Score | 8 | Yes, 25% | No | None, absolute | Yes, in full |
| Morningstar | Growth, Profitability, Financial Health Grades | 1, 1, and a structural model | No | Yes, in Financial Health | Universe | Distribution only |
| Seeking Alpha | Factor Grades, Quant Rating | "over 100" | Yes | Yes | Sector | No |
| Simply Wall St | Past Performance, Health | 12 checks | No | No | Thresholds and industry | Yes, equal weight |
| Stock Rover | Quality Score | 5 | No | No | Whole market; its Ratings use industry peers | Numeric, one score only |
| Stockoscope | Business Quality Score | 40 | Yes, 8% | No | None, absolute | Yes, in full |
One row needs a caveat. Finbox has no methodology page: the whole explanation of its score is a single sentence on the company page, and that page requires an account. Everything described here comes from a signed-in view dated 18 September 2026. A reader following that link while signed out will see a login prompt, not the score.
One metric, or a hundred and four
The spread is the first surprise.
Morningstar's Growth Grade rests on one metric: revenue per share over five years. Its Profitability Grade rests on one too, return on equity. Stock Rover's Quality Score uses five. intrinsiqq uses eight. Simply Wall St runs twelve binary checks. Stockoscope uses forty, as ten pillars of four. Finbox says "over 100 factors" and shows each one with a value and a percentile, though only to signed-in users. Seeking Alpha also says "over 100" and lists none of them.
Lookback windows vary as much. GuruFocus reads a ten-year mean operating margin. Morningstar's Financial Health Grade reads one year of daily market data. intrinsiqq uses five-year growth and a three-year margin trend.
One metric is easy to audit and narrow. A hundred is thorough and impossible to audit when no weights come with it.
Is being cheap part of being good?
This is where the field genuinely splits, and it has consequences.
Five of the nine put valuation inside the quality score. intrinsiqq is the most explicit: P/E carries 10% and price-to-free-cash-flow 15%, so a quarter of the score moves with the share price. GuruFocus, Finbox and Seeking Alpha all fold a valuation component in. Stockoscope includes a valuation-multiples pillar at 8%.
Four keep it out. Simply Wall St puts valuation on its own axis. Stock Rover's Quality Score has no price term. Morningstar grades the business and rates the price separately. Alpha Spread keeps profitability and solvency away from its valuation tools.
The effect is not theoretical. Finbox's Apple page, viewed signed in on 18 September 2026, showed overall Financial Health as GREAT with its Relative Value component graded D. That is the design working, and a good reason to look underneath any headline score.
Howard Marks makes the case for keeping them apart:
"But high-quality assets can be risky, and low-quality assets can be safe. It's just a matter of the price paid for them." Oaktree memo, Everyone Knows, April 2007
On that view, blending the two answers neither question cleanly. We take a middle position and would not claim it settles the argument: our quality score includes valuation at 8%, while our quality strategy builder zeroes that pillar by default, along with the dividend pillar, so ranking companies on quality ranks on the business alone unless you add either back. That builder also blends the absolute score with the peer-relative one, 70/30 by default.
Does the share price count as a fundamental?
Four of the nine include price performance in a score that reads as fundamental.
GuruFocus publishes the formula: the momentum ratio is the average of 12-month-minus-1-month and 6-month-minus-1-month performance, divided by beta. The mapping is deliberately non-monotonic, with the top rank going to stocks around the 70th percentile of momentum rather than the highest. Finbox's Price Momentum component uses ten price-return windows from one week to five years, plus the share price as a percentage of its 52-week high. Seeking Alpha grades Momentum as one of five factors.
Morningstar is the subtle one. Its Financial Health Grade is not built from accounting ratios at all. It is a distance-to-default option model taking daily share price, equity volatility, an asset beta and the one-year Treasury yield, adopted deliberately "instead of using accounting-based ratios" and recalculated daily. Balance-sheet liabilities still enter it, but the moving parts are market ones. A company's financial health grade can change without a single figure in its accounts moving.
Simply Wall St is the clean counter-example, stating that four of its five axes only change when new company or analyst data arrives.
Momentum has real evidence behind it. The point is narrower: a fundamental-sounding grade often contains a year of share price movement, and nobody tells you.
Graded on a bar, or on a curve?
Some tools measure you against a fixed standard. intrinsiqq says so outright: ROIC above 20% is good, regardless of industry. Simply Wall St uses fixed cut-offs, ROE above 20%, debt to equity below 40%. Our own metrics score against published tier tables.
Others grade on a curve. Seeking Alpha ranks each metric against the stock's sector. Finbox ranks against sector within developed markets. Morningstar goes furthest and publishes the curve: for its Financial Health Grade, 10% of the universe gets an A, 20% a B, 40% a C, 20% a D and the bottom 10% an F. A C is not a verdict about the company. It means the company sits in the middle four-tenths.
Both fail differently. Fixed bars are stable and comparable over time but flatter asset-light businesses and punish capital-intensive ones. Curves fix that automatically, but a company can improve while its grade falls because its peers improved faster, and in a weak sector the best of a bad set still scores well.
Two tools refuse to choose and run both. Stock Rover pairs market-wide Scores with industry-relative Ratings. We pair the absolute quality score with a separate peer score that ranks the same ten pillars, on a trailing-twelve-month basis, as percentiles inside sector and industry cohorts, with the cohort switchable and its size shown, and never merge the two. A single blended number would answer neither question.
One tool never says what the cohort is: Alpha Spread describes its metrics as "normalized and weighted" without stating against what. Stock Rover takes some finding out, since its metric definition names no cohort and two of its pages appear to disagree, but a support page settles it: the Ratings compare a stock against its peers, the Scores against the entire universe.
How much can you actually see?
Naming the ingredients is where most tools stop. Finbox lists every metric with its value and percentile, and publishes no weight at any level, but all of it sits behind a login, so none of it is checkable without an account.
Publishing the weights as numbers is rarer. intrinsiqq publishes a full eight-line table. We publish ten pillar weights. Simply Wall St publishes them trivially but completely, since every check is worth one point. Morningstar publishes its grade distribution but withholds the component weights inside its Profitability Grade. GuruFocus offers only that profitability and growth "are weighted fully. The other parameters have less weight". Seeking Alpha offers only that "some factors are weighted higher than others". Stock Rover states flatly that the exact formulas are proprietary.
Keeping a dated log of scoring changes is rarest of all. intrinsiqq does, with a rationale worth borrowing: a scoring method that quietly changes is not a method you can check past work against. GuruFocus publishes a changelog too, though it is a general product and data log in which scoring changes appear only occasionally. We do not, and reading theirs has convinced us we should.
Published methodologies also rot. Simply Wall St's public model documents two checks its live product no longer runs, and the live product runs two the model never mentions.
Can you argue with it?
Almost never. Two of the nine let you change the weights: intrinsiqq on its Premium tier, and Stockoscope across its ten quality pillars, with the same component re-weighting on its peers, analysts and holdings scores. Its valuation score exposes a single blend slider rather than component weights. Everywhere else the score arrives finished.
Some tools offer custom metrics instead, which is a different thing: Stock Rover, Finbox and Koyfin let you build a new measure alongside theirs, not adjust theirs.
Seeking Alpha constrains things in its own way. A poor grade on one factor caps the overall rating, so a highly profitable company with weak price momentum cannot be rated Buy no matter how good the business is.
Three questions worth asking
None of this makes any tool wrong. These are legitimate design choices, and several are better documented than ours.
But a score is only interpretable if you know three things.
What is in it? If the share price is an ingredient, the number will move with the market, and some of what looks like deteriorating quality is just a re-rating.
What is it compared against? A B means something different as a fixed bar, a sector percentile, and a fixed slice of the whole universe.
Can you see the weights? Four of the nine confirm that differential weights exist while declining to publish them. Every ingredient is named and the recipe is still hidden.
When two tools rate the same company very differently, that is usually not one of them being wrong. They are measuring different things, and the gap is telling you which question is still open.
A fully referenced version of this review, with the complete extraction criteria and source list, is available on request. Methodologies were read between 4 and 18 September 2026 and change over time; check the current version before relying on any description here.
This article is for educational purposes only and does not constitute investment advice. Scores and grades are analytical tools, not recommendations. Always conduct your own research and consider consulting with a licensed financial professional before making investment decisions.