
The Capex Switch: How We Model AI Capital Spending in a DCF
Capital spending at the AI hyperscalers has exploded, and for a heavy reinvestor the long-run capex assumption can move a DCF more than everything else combined. Here is the problem that creates, how our model handles it, and the one switch that lets you set the assumption yourself.

In a discounted-cash-flow model of a company that reinvests heavily, one assumption can be worth more than everything else combined: how much capital the business keeps spending in the long run. For the AI hyperscalers, that single number has become the whole argument. Are they in a temporary build-out that will normalize, or have they signed up for permanently elevated capital spending because GPUs wear out, economically, far faster than they depreciate on the books?
We did not want to answer that question for you inside a black box. So we built one control that puts the assumption in your hands: a "Hold Capex Elevated" switch on every DCF page. This note explains the problem it solves, how our model treats capex, and how to read the switch. It is the methodology companion to our worked examples on Microsoft, Alphabet and Meta, which show the switch changing the answer in real time.
The AI spending boom
Capital spending at the big technology companies has erupted. Across 2026 the four largest hyperscalers (Microsoft, Alphabet, Amazon and Meta) have collectively guided to roughly $725 billion of capital spending, up about 77% year over year, almost all of it going into AI infrastructure. The effect on cash is stark: operating cash flow has surged, but free cash flow has gone sideways, because the entire difference is being poured into capex.
That gap is exactly what makes these companies hard to value. A DCF values free cash flow, and capex is the largest, most variable claim on that cash for a company building physical infrastructure. Earnings do not feel the full cost right away: a dollar of capex lands on the balance sheet and reaches the income statement only slowly, as depreciation. Free cash flow feels it immediately. That is why a hyperscaler can look cheap on earnings and expensive on cash flow at the same time. They are two views of the same spending, one that defers the bill and one that does not.
The problem: what happens after the build-out?
To value any of these companies you have to answer one question: what does capex do over the next decade, and forever after? That single choice dominates the result, because most of a DCF's value sits in the terminal value, the perpetuity beyond the explicit forecast. Get the long-run capex rate wrong and nothing else in the model can rescue it.
The conventional shortcut is to hold today's capital intensity flat: whatever a company spends now as a share of revenue, assume it keeps spending at that pace forever. For a hyperscaler currently sinking a fifth of its revenue into capex, that is not conservative, it is simply unrealistic. A business growing a few percent a year cannot reinvest at build-out intensity in perpetuity; at a long-run growth rate near 3%, an asset base compounding at 20% of revenue would eventually outgrow the entire economy. Once the build-out is done, a mature company does not keep building. It only replaces what wears out.
Our approach: taper, then maintenance
So we model capex in two stages. (For the full engine, the growth model, WACC and tapering, see our companion piece on building the DCF engine.)
- Across the explicit forecast, capex glides down from the company's recent normalized rate toward maintenance, rather than sitting flat at today's level. Maintenance capex is roughly equal to depreciation: it is what replacing worn-out assets actually costs, as opposed to building brand-new capacity.
- In the terminal value, capex is set to maintenance, the steady-state level a perpetuity can actually sustain.
We start from a normalized capex rate, a smoothed historical figure rather than one noisy year, and glide it down over a 10-year forecast (years 1 to 5 anchored to analyst consensus, years 6 to 10 tapering) before the perpetuity takes over. For Microsoft, whose normalized capex sits near 20% of revenue and whose depreciation runs near 10%, the default modeled path is: 20%, 19%, 18%, 17%, 16%, 15%, 14%, 13%, 12%, 11%, 10%, then 10% (maintenance) in perpetuity. Hot today, settling toward replacement as the company matures.
Here is the part worth being honest about: this glide-down is the generous assumption, not the harsh one. It lifts the modeled value precisely because it stops treating today's elevated AI spend as permanent. We think normalization is the right base case for most companies. But it is a choice, not a fact, and it is the choice the whole valuation hinges on. That is exactly why we did not want to bury it in a default.
The switch: you hold the controls
Because this one assumption swings the answer so much, and because reasonable investors genuinely disagree on it, we did not want to force our view. Every DCF page carries a "Hold Capex Elevated" switch.
- Off (default): capex glides to maintenance, as above. This is the "the build-out normalizes" world.
- On: capex is held flat at the normalized rate across every explicit year and the terminal. No glide-down, no terminal normalization. This is the "AI spending never normalizes" world, where replacement capex stays permanently high because the hardware keeps needing to be replaced.
Exactly one input changes between the two positions: the sustained (and terminal) capex rate moves from maintenance to the normalized actual. Growth, margins, discount rate and share count are all untouched, so the switch isolates this single assumption cleanly, and the panel recomputes the whole model in your browser the instant you flip it.
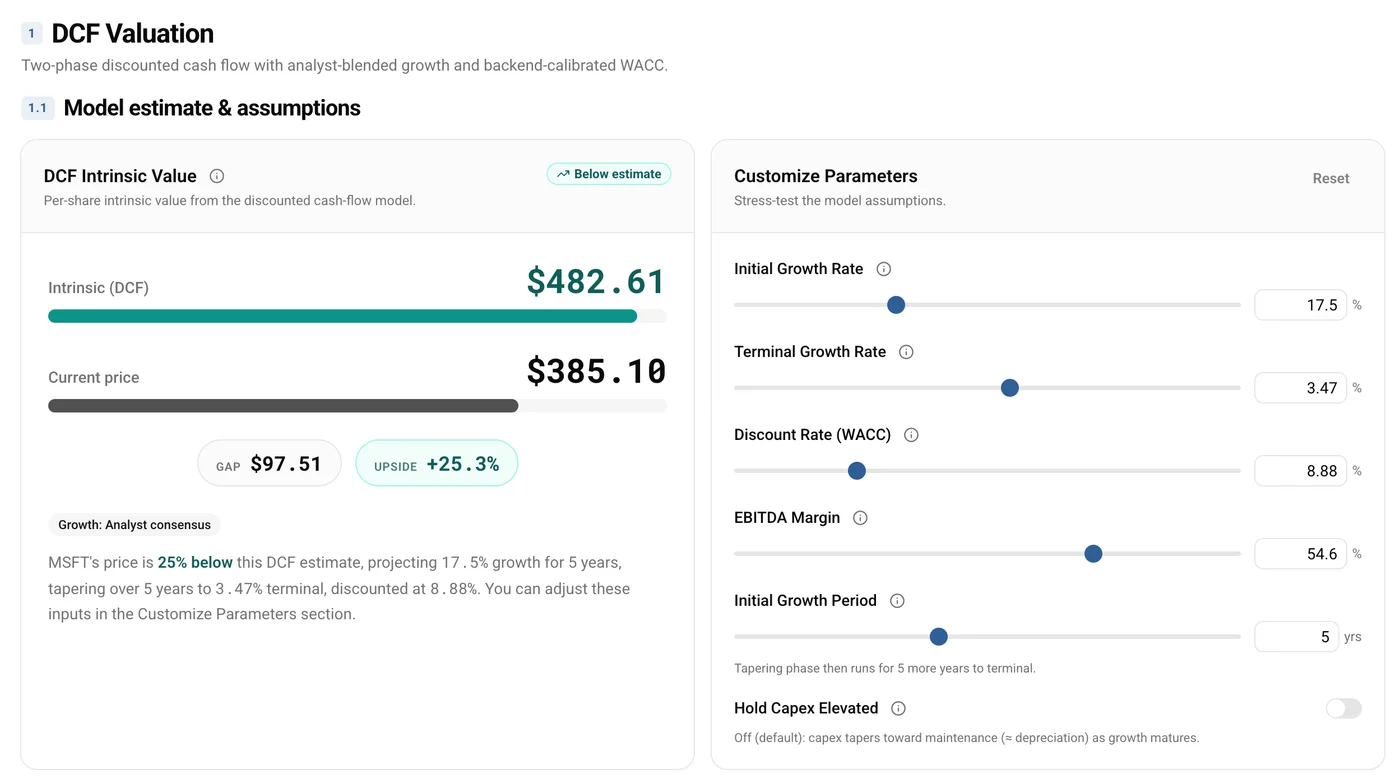
Figure 1. The switch off, its default position. Microsoft's capex tapers toward maintenance, and the model's intrinsic value is $482.61, about 25% above the $385.10 price.
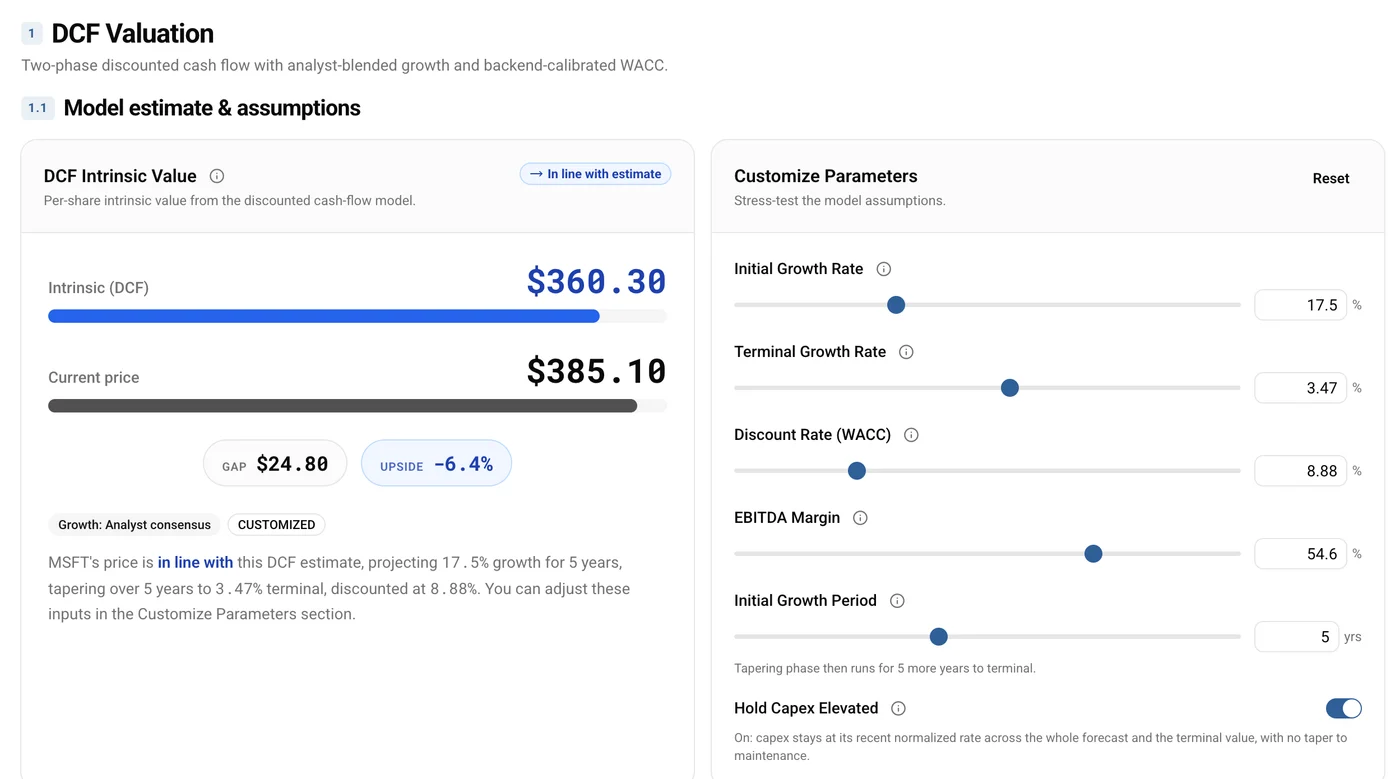
Figure 2. The same panel with the switch on. Capex is held at its recent normalized rate across the whole forecast and the terminal value, with no taper, and the model returns $360.30, roughly in line with the price. Nothing else was touched. (These are live figures and will keep moving as data updates.)
As far as we are aware, this control is unique to Stockoscope. Plenty of tools let you edit a growth or discount-rate assumption and re-run a sensitivity table; we have not found another retail valuation platform that turns the long-run capex question into a single, purpose-built switch the way this one does. That reflects the philosophy behind the whole tool. A DCF is one lens, not a verdict, and the honest thing a model can do is make its biggest assumption visible and adjustable rather than hide it inside a single number.
The switch in action
The point of a methodology is what it does to real numbers. Across the hyperscalers, the two switch positions bracket the entire debate. (All figures below are from the live model on 12 July 2026, the same run as the Microsoft screenshots above; they move as markets and filings update, and the panel always recomputes from current data.)
Table 1. Fair value with capex normalizing (switch off) versus held elevated (switch on).
| Company | Capex normalizes (default) | Capex held elevated | Current price |
|---|---|---|---|
| Microsoft | $483 | $360 | $385 |
| Alphabet | $252 | $160 | $357 |
| Meta | $649 | $327 | $669 |
Read the gap between the two columns as the size of the capex bet the market is making. For Microsoft, the stock trades close to the held-elevated value, not the normalized one, which is another way of saying the market has already re-priced it for permanently high capex rather than for any deterioration in profits. For Alphabet, every capex path we ran sits below the price, so the disagreement is only about how expensive it is. For Meta, the same one assumption is the difference between roughly fair value and an estimate worth less than half the price. These are not three different stories. They are one methodology applied to three companies caught in the same industry-wide capex surge.
How to use it
Off, you get our base case: the AI build-out eventually normalizes toward replacement spending. On, you get the bear case: it never does. Flip it, watch the fair value move between the two worlds, and choose the one you can actually defend. Whether AI capital spending converts into durable free cash flow or just keeps compounding is a genuine open question, and the switch lets you price both answers instead of taking ours. If you would rather start from the price and work backwards, our reverse DCF on the hyperscalers solves for the growth and margin each stock already has to deliver.
Every DCF page on the platform carries the switch, including Microsoft's. Any stock the model produces is a candidate for your own research, not a recommendation.