
Beyond Gut Feelings: Build Your Own Quality Score
What business quality actually means, the traps to avoid, and how to weight the 10 quality pillars into your own score on the Strategies page - your definition of quality, not ours.
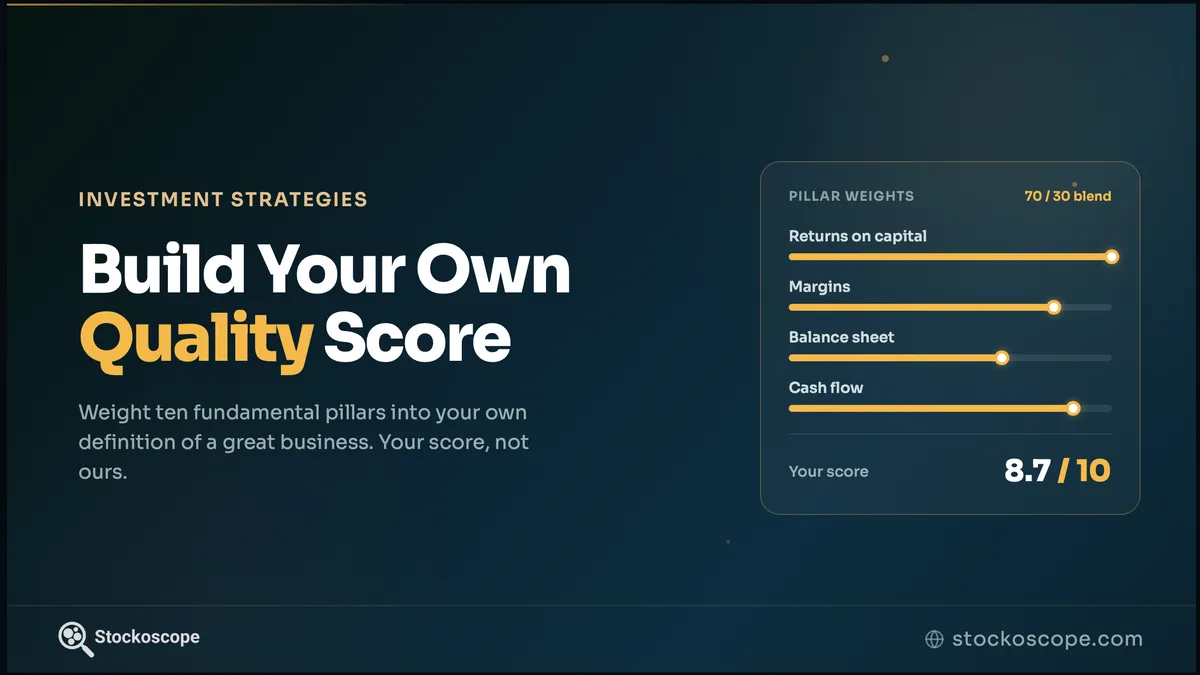
Most investors judge a company on intuition, recent news, or an emotional reaction to the share price. Hot tips, fear of missing out, panic selling in a downturn: these behaviours plague even experienced investors and lead to inconsistent decisions.
The alternative is a systematic, transparent measure of business quality, applied the same way to every company. But here is the part that matters: the goal is not to hand you a quality verdict. The Quality tool on Stockoscope ships a transparent default, then lets you re-weight it into your own. You decide what "quality" means and the ranking recomputes to match. Your definition, not ours.
This article explains what business quality looks like, the traps to watch for, and how to run the method yourself on the Strategies page.
What "quality" actually means
Four characteristics describe a genuinely good business. They are the backbone of the method.
- High, durable returns on capital. The engine of compounding. A business that earns far more than its cost of capital, year after year, builds value without needing constant new investment.
- Strong margins and real cash. Wide, stable margins and free cash flow that backs up reported earnings. Cash generation is the hardest thing to fake and the clearest sign of pricing power.
- A fortress balance sheet. Low debt, comfortable interest coverage, healthy liquidity, so the business controls its own destiny through a downturn instead of depending on lenders.
- Good for its sector, not just on paper. Strong relative to peers, not flattered by an easy industry. A 15% profit margin might be strong for a retailer but ordinary for a software company, so the method reads each company against its own sector.
What to watch for
A high score is a starting point, not a conclusion. Three traps:
- Quality at any price. Even a wonderful business is a poor investment if you overpay. A high quality score is not a reason to ignore valuation.
- Yesterday's moat. Scores reflect the track record, and competitive advantages erode. A strong history is necessary but not a guarantee that the next decade looks like the last.
- Size mistaken for quality. The biggest or most famous company is not automatically the highest quality. The pillars judge the economics of the business, not its popularity.
How the method works: two transparent layers
The method reads each company on two complementary layers, then blends them.
- Absolute quality measures a company's fundamental strength on its own terms, independent of the market or its peers: returns on capital, profitability, debt management, and cash generation. It rewards companies that consistently earn good returns, manage their balance sheets well, and convert profit into cash.
- Peer quality measures how a company ranks against its sector on those same pillars. A metric that looks impressive in isolation can be ordinary within a specific industry, so peer ranking puts every company in the context of its competitive arena.
Under the hood there are 10 quality pillars, each built from its own underlying metrics, each scored, then combined into a single reading on a 1-10 scale. Stockoscope publishes a disclosed default weighting and a default 70/30 split favouring the absolute layer over the peer layer (backtesting favoured absolute). That default is the published starting point, not a fixed verdict.
Build it yourself on the Strategies page
This is the part that makes the score yours rather than ours. On the Quality tab, you assemble the ranking from three sets of controls.
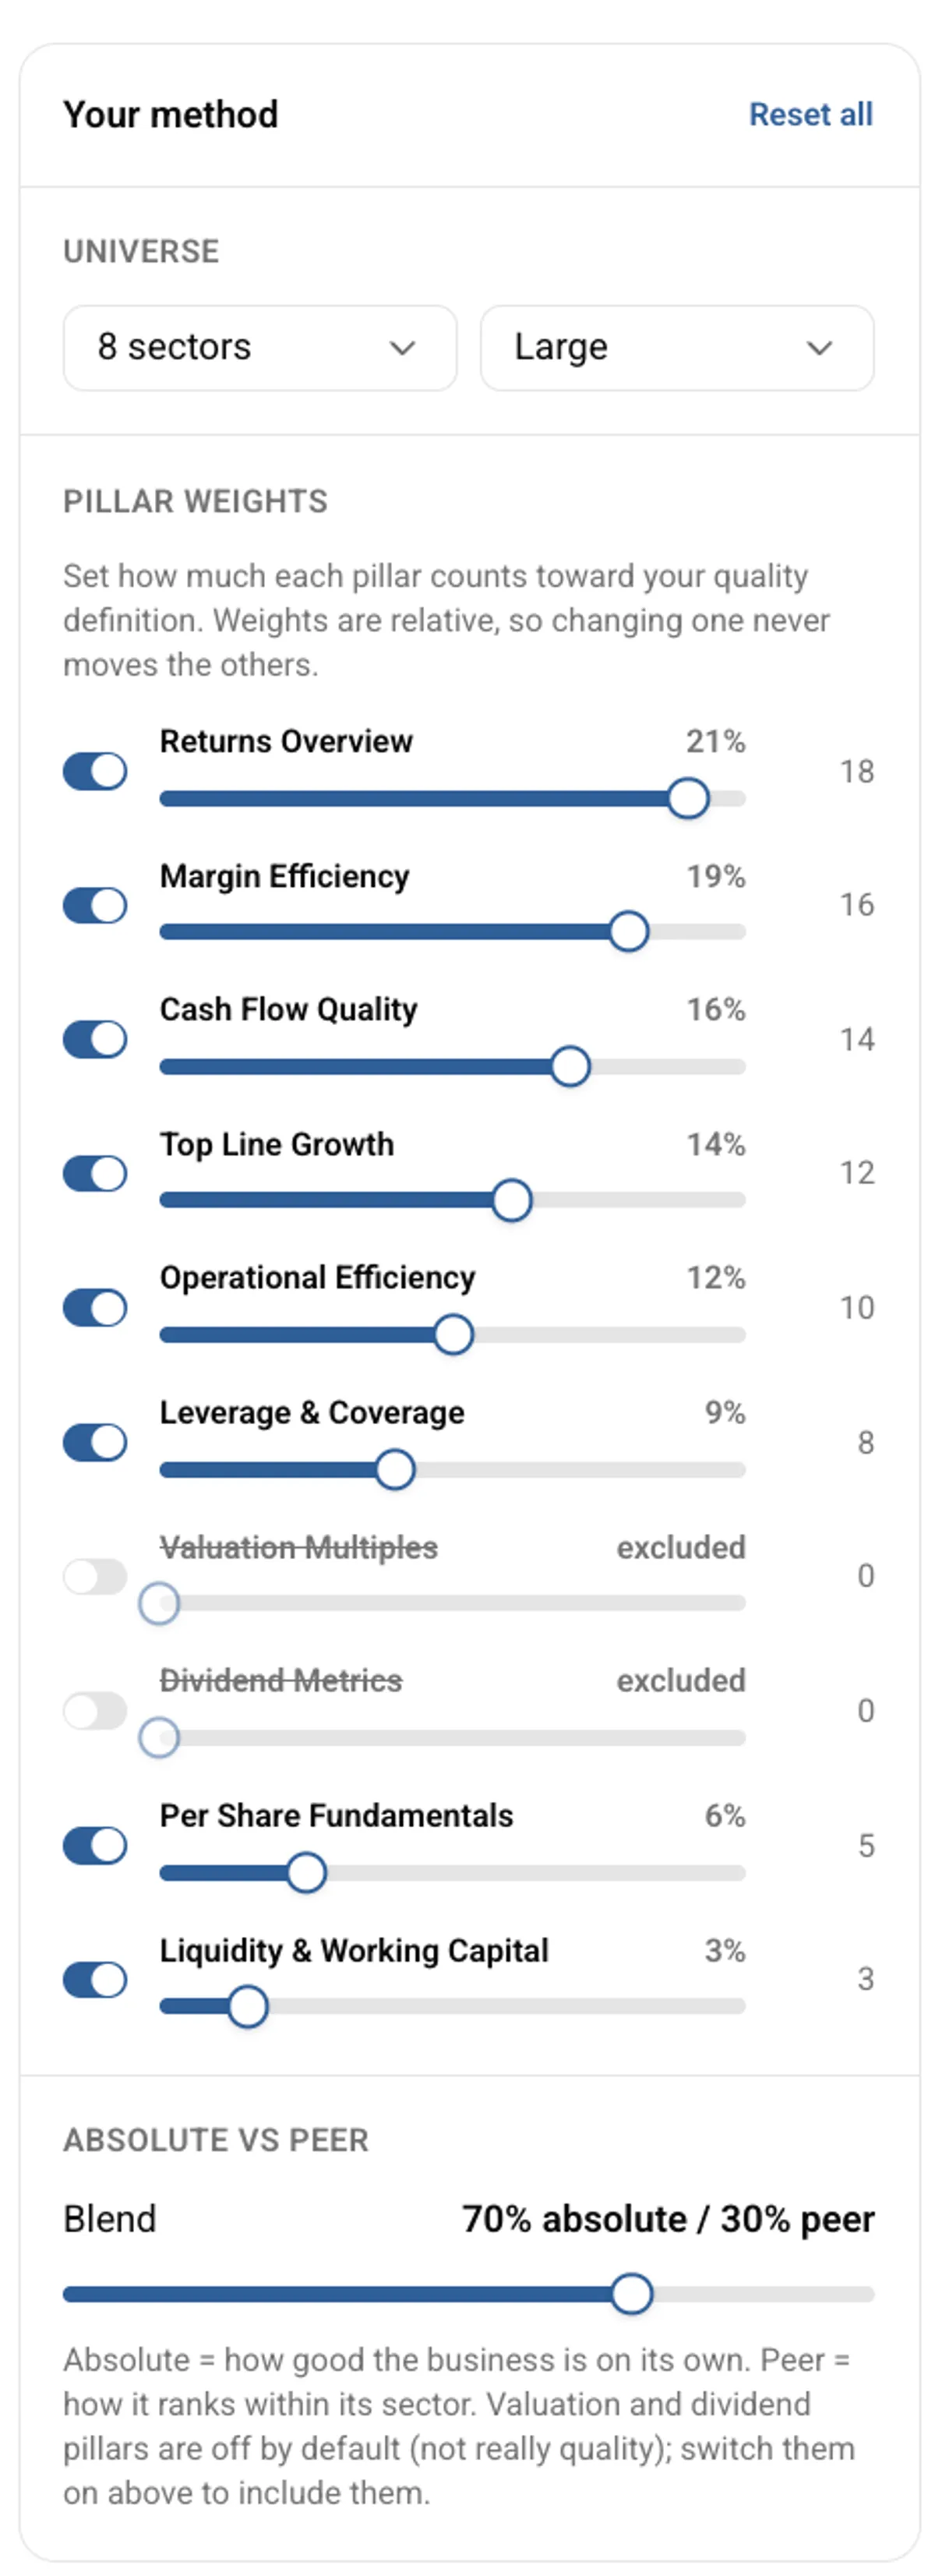
Figure 1: The Quality tab's control panel. Set the universe, weight or switch off any of the ten pillars, and set the absolute-vs-peer blend. The market re-ranks live the moment you move a lever.
- Universe. Choose the sectors and company sizes you want to rank. The default starts with larger companies; widen it whenever you like.
- Pillar weights. Re-weight or switch off any of the 10 pillars. The weights are relative, so changing one never moves the others. If you do not think a pillar belongs in your definition of quality, turn it off and watch the ranking move.
- Absolute vs peer blend. Decide how much "good on its own" matters versus "good for its sector," anywhere from all-absolute to all-peer.
There is no black box and no hidden judgement: the pillars, the weights, and the blend are all on the page, and the result re-ranks live as you change them.
Read the live ranking
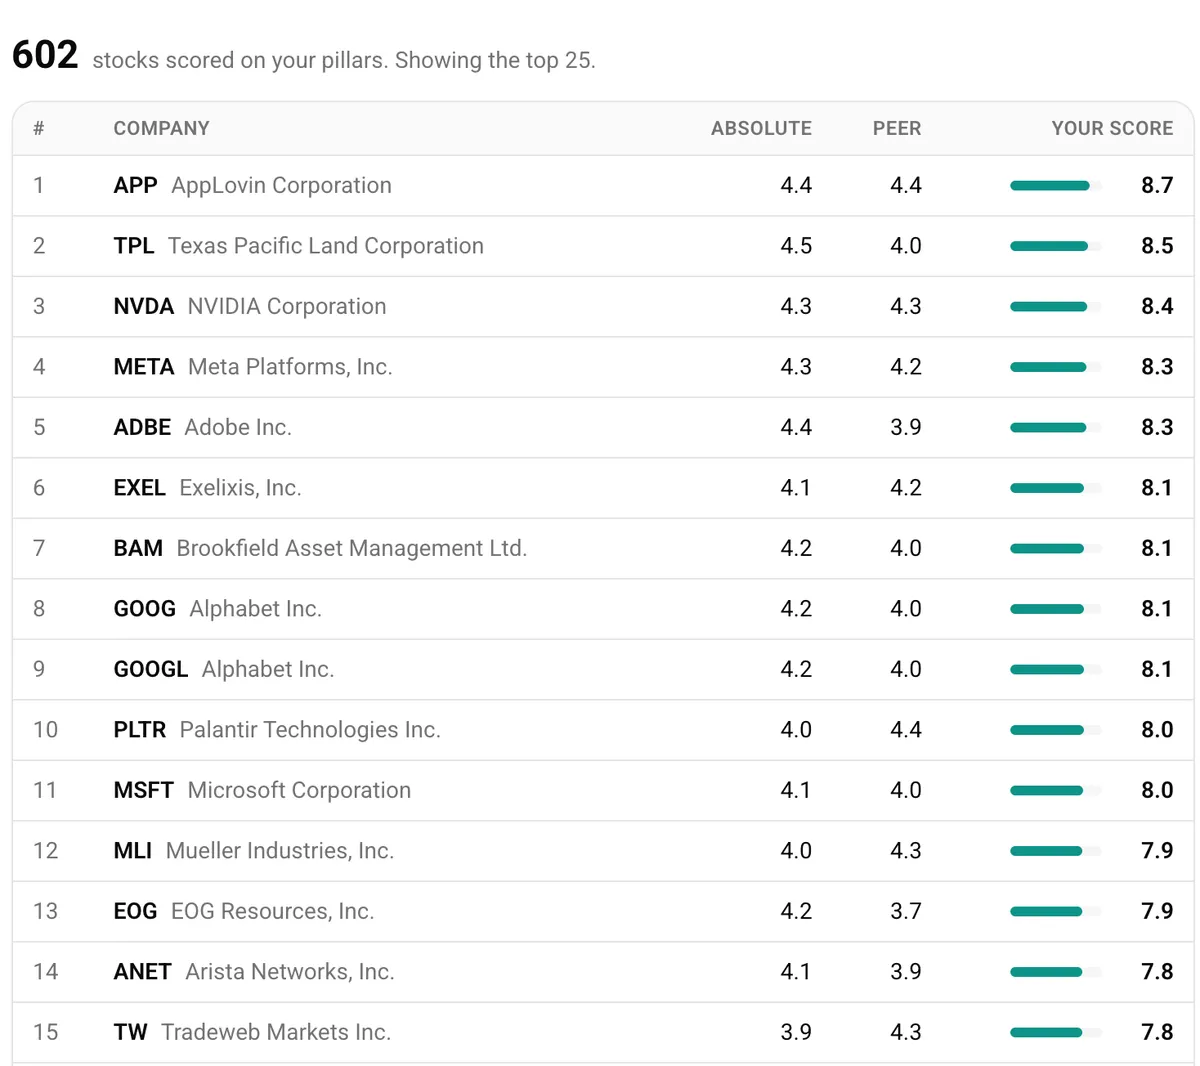
Figure 2: The live ranking. Every eligible company scored on the pillar weighting you chose, shown as your score - a research starting point, not a verdict on any stock.
The table is the output of your method, not a buy list. It ranks the universe by the definition of quality you just built, and every company links through to its full breakdown so you can see exactly why it scored where it did. Change a weight and the order rearranges in front of you.
The same re-weighting works on any single company too: open a stock's Quality page and the default composite is just the opening view, with the same pillar and blend controls to make it your own.
Strengths and limits of a systematic quality score
Strengths:
- It removes emotion from the measurement. The same inputs always produce the same reading; it cannot panic sell or chase momentum.
- It is scalable and consistent, applying the identical method to thousands of companies at once rather than a handful you happen to follow.
- It is transparent and reproducible. Because every input is visible, you can see exactly why a company reads the way it does, and change it.
- It is configurable. The score adapts to your definition of quality instead of forcing one view on you.
Limits:
- A score is not a timing tool. It measures business quality, not what the price will do next; a high-quality company can still fall in a broad sell-off.
- It is backward-looking. It reads historical fundamentals and may not yet reflect a rapid change in the business or an emerging competitive threat.
- It leans on reported data, which biases toward larger, well-followed companies and can overlook smaller firms with strong fundamentals but thin coverage.
- Quality is only one lens. It says nothing on its own about valuation, sentiment, or ownership, which is why it sits alongside the other dimensions rather than standing in for them.
Putting it to work
Systematic does not have to mean someone else's system. The point of a transparent quality score is that you can inspect it, disagree with it, and rebuild it to match how you think about good businesses.
Open the Quality tab on the Strategies page, weight the pillars, and see which companies rise under your definition. The principle is simple: a consistent, transparent, configurable measure beats gut feelings and emotional decisions, precisely because you can see what is in it and make it your own.
This article is for educational purposes only and does not constitute investment advice or recommendations to buy or sell securities. The systematic approach described represents one methodology among many and does not guarantee returns or protection against losses. Past data does not predict future outcomes. All investments carry risk, including potential loss of principal. Any companies shown are examples used to illustrate the scoring, not purchase recommendations. Market conditions and company fundamentals can change rapidly. Always conduct your own research and consult qualified financial professionals before making investment decisions.