
Build Your Own Dividend Score: 4 Pillars Every Income Investor Should Know
A transparent 100-point dividend score that weighs not just what a company pays today, but whether it can sustain and grow those payments - run on the Strategies page with every pillar weight under your control.

Most investors chase yield. A better approach scores the complete dividend picture: not just what a company pays today, but whether it can sustain and grow those payments tomorrow. This article explains the four pillars behind a transparent dividend score, and how you set the weight of each one on the Strategies page so the score reflects your definition of dividend quality, not ours.
The dividend trap most investors fall into
When most investors screen for dividend stocks, they start with one question: "What's the yield?" It is understandable; if you are investing for income, surely you want the highest return.
But yield-first thinking creates a dangerous blind spot. High yields often signal distress, not opportunity. Companies sporting 8%, 10%, or 12% yields frequently cut or eliminate those payments within months, leaving income investors with both capital losses and a vanishing income stream.
The traditional approach leans on outdated metrics, simple payout ratios, and sector stereotypes that funnel investors toward utilities, REITs, and consumer staples. A method that reads yield quality, dividend growth, payment sustainability, and historical consistency tends to find dividend strength in places a yield screen never looks, including healthcare, technology, and communication services.
The four pillars: a 100-point dividend score
The score reads every dividend payer across four pillars, each weighted by its importance to long-term dividend success. The weights below are the disclosed default, not a fixed rule.
- Yield quality (20 points). Rather than chasing the highest yield, the pillar targets an optimal 2-6% range: high enough to matter, sustainable over time. Sector-relative context rewards a yield that exceeds peers while staying stable.
- Growth (35 points). The heaviest pillar by default. It rewards how fast the dividend itself has grown (a multi-year growth rate), because a steadily rising payout is the clearest sign management is confident, and a growing income stream is what compounds wealth over time.
- Sustainability (30 points). Close behind, and the anti-cut safeguard. It assesses payout ratios with sector-specific adjustments, free-cash-flow coverage, and balance-sheet strength (current ratio, debt-to-equity, interest coverage).
- Consistency (15 points). Track record of consecutive increases and the absence of cuts.
Growth carries the most weight by default, with sustainability close behind, and that pairing is deliberate: a rising dividend is what builds real income over time, but it only counts if the company can keep paying it through a cycle. A high yield the business cannot fund, or growth without the cash flow to back it, is exactly how income investors get hurt.
Under the hood
A few techniques distinguish this from a basic dividend screen:
- Linear interpolation curves, so yields are scored smoothly across ranges rather than jumping between buckets.
- Sector-specific adjustments for payout ratios, yield expectations, and financial-health benchmarks.
- An uncapped increase-streak record, so a 25-year-plus history (dividend aristocrats) scores on its full merit rather than being capped at a ceiling.
- Fallback methodologies when primary data is missing (for example, earnings coverage when free-cash-flow data is unavailable).
- A recent-cut check that disqualifies the consistency pillar outright when a company has cut its dividend.
The result is a score on a 1-10 scale, reflecting both what a company pays today and its capacity to sustain and grow it. A high score is a starting point for research, not a verdict.
Build it yourself on the Strategies page
This is what makes the score yours. On the Dividend tab, the method runs live over every dividend payer and you drive it with three sets of controls.
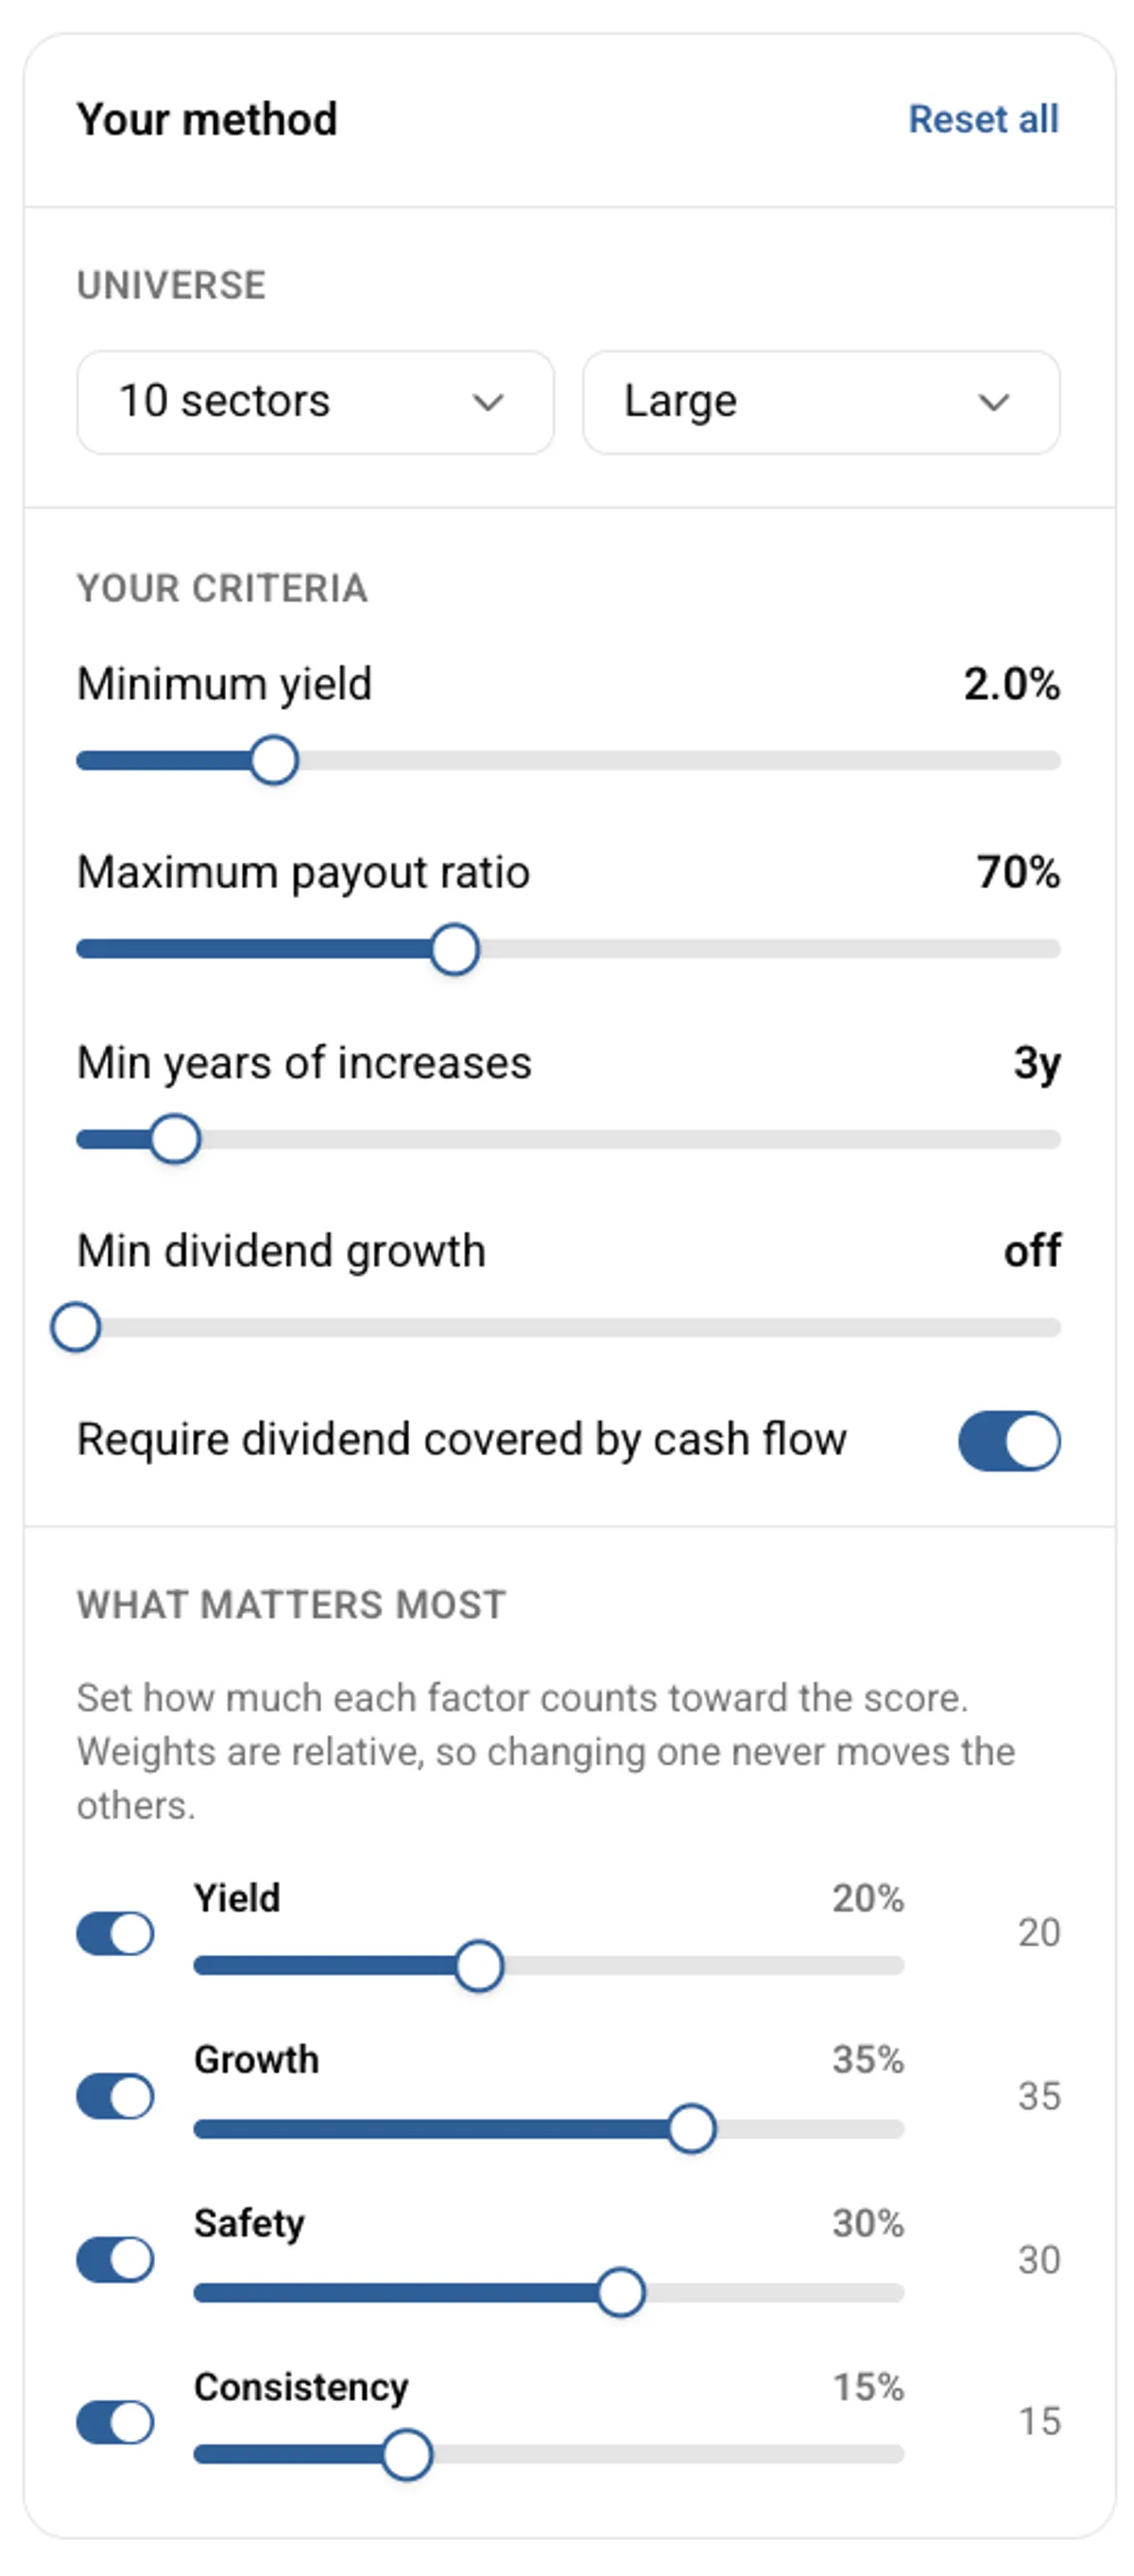
Figure 1: The Dividend tab's control panel. Set the universe, move the filters that decide what qualifies (minimum yield, maximum payout, minimum years of increases, cash-cover requirement), and weight the four pillars. The list re-ranks live as you move a lever.
- Universe. Choose the sectors and company sizes to rank.
- Filters (what qualifies). Move plain-English levers: a minimum yield, a payout-ratio ceiling, a minimum streak of consecutive increases, a minimum dividend growth rate, and a switch to require the dividend be covered by cash flow. These decide which payers make the list.
- Pillar weights (what counts most). If sustainability matters most to you, lean into it; if you weight a long record of increases more heavily, raise consistency; if you want more yield and will accept more risk, adjust accordingly. The weights are relative, so changing one never moves the others.
Every pillar, weight, filter, and underlying metric is visible on the page. The platform states the relationships and shows the maths; what counts as dividend quality is yours to decide.
Read the live ranking
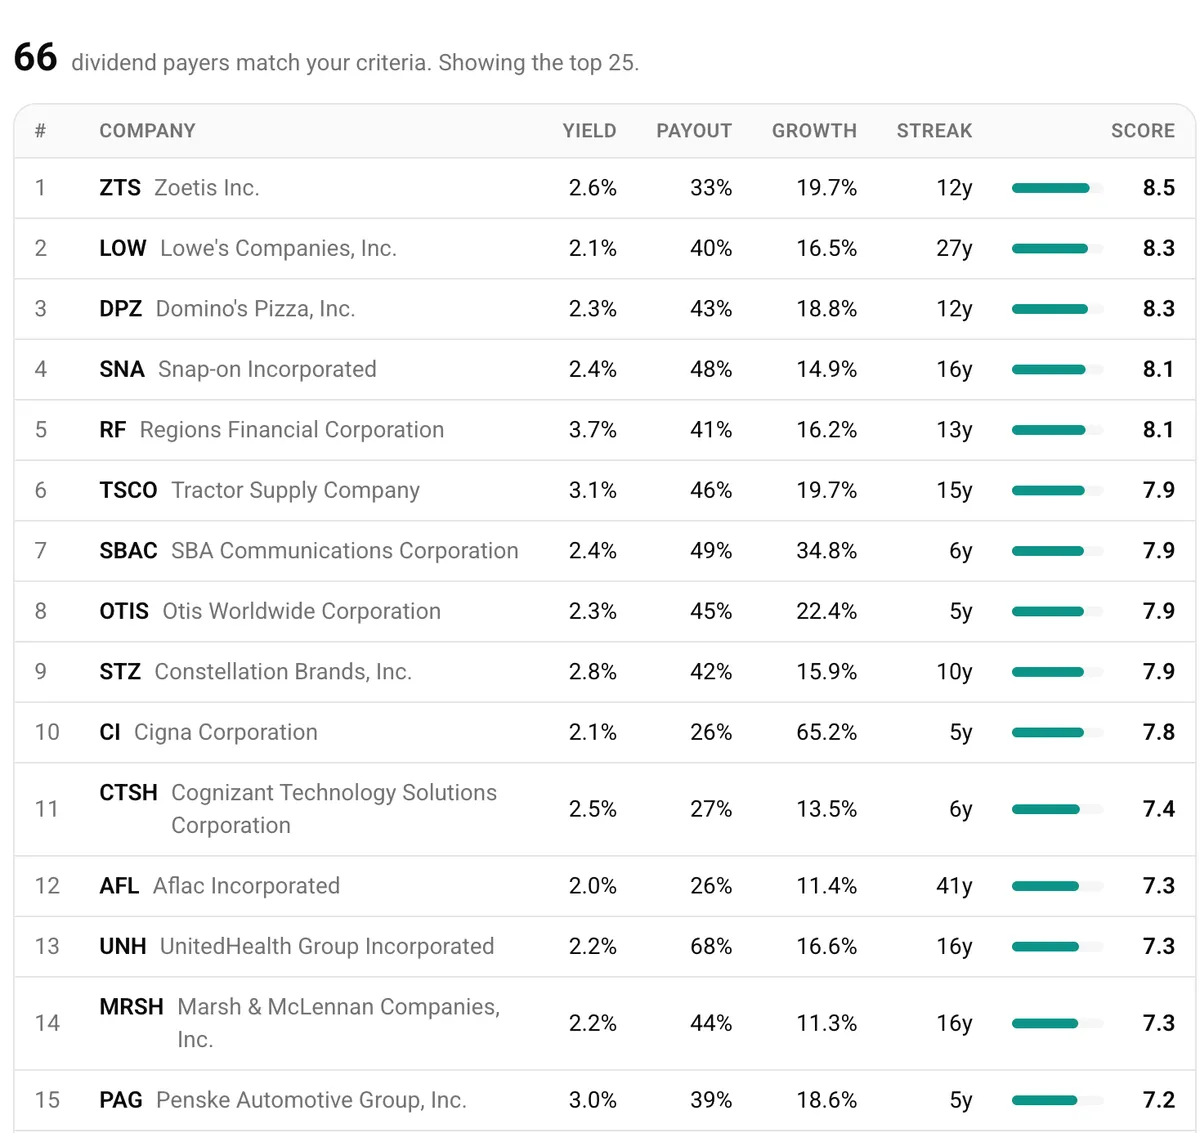
Figure 2: The live ranking. Every dividend payer that clears your filters, scored on the weighting you chose and shown with its yield, payout, growth and streak - a shortlist for your own research, not a buy list.
The table is the output of your method. It ranks the payers that pass your filters by your definition of a quality dividend, with the strongest dividends often turning up outside the traditional "income sectors," and each company links through to its full breakdown. Change a weight and the order rearranges in front of you.
Strengths and limits
Strengths:
- Comprehensive scope. Weighing four pillars instead of yield alone captures a more complete picture of dividend quality.
- Growth-led. By weighting dividend growth most heavily, the score favours rising income streams set to compound, rather than the highest yield on offer today.
- Bias removal. Systematic scoring strips out the emotional and sector prejudices that lead investors to overlook strong dividends outside the usual sectors.
- Risk identification. The heavy sustainability weighting helps flag a payout under strain before a cut.
Limits:
- Historical-data dependency. A multi-year window may miss longer cyclical patterns or very recent fundamental changes.
- Not a valuation check. The score measures dividend quality, not whether the stock is cheap; a strong dividend can still sit in an overpriced share, so weigh it alongside the other lenses.
- Sector evolution. Rapid business-model change (especially in tech and communications) may not be fully captured in historical metrics.
- Black swans. No score can predict an unprecedented shock, regulatory change, or company-specific crisis that forces a cut.
Conclusions
The strongest dividend opportunities are not confined to the traditional "income sectors." Reasonable, well-covered, growing dividends turn up across technology, healthcare, and other growth-oriented industries (QUALCOMM through the dividend lens is one worked example), and a systematic, transparent score is how you find them without sector prejudice.
The point of making that score configurable is that dividend quality means different things to different investors. Open the Dividend tab on the Strategies page, set the four pillar weights to match what you care about, and rank the market by your own definition of a quality dividend.
This analysis is for educational purposes only and should not be considered investment advice. Dividend payments are not guaranteed, and companies can reduce or eliminate dividends at any time regardless of historical track records or analytical scores. Past performance does not predict future results. Always conduct your own research and consider consulting with financial professionals before making investment decisions.