
QUALCOMM Through the Dividend Lens: Why a 2.09% Yield Scored Highly
A semiconductor company scored highest on our systematic dividend lens for October. Here's what that reveals about finding quality in unexpected places.
When QUALCOMM scored highest on our October dividend lens, it challenged everything traditional income investors believe about dividend stocks. At just a 2.09% yield, how did a semiconductor company score higher than every utility, REIT, and consumer staples stock on dividend quality? And more importantly, what does it reveal that traditional dividend screens, which never considered it at all, miss entirely?
The answer exposes fundamental flaws in how most investors approach dividend investing. Traditional screening starts by filtering sectors (utilities, REITs, consumer staples), then sorts by yield from highest to lowest. This approach eliminated QUALCOMM before any fundamental analysis occurred. Wrong sector. "Low" yield. Never evaluated.
Our systematic framework takes the opposite approach: evaluate every S&P 500 dividend payer using identical criteria regardless of sector, then let the data reveal where quality actually exists. For three consecutive months, QUALCOMM scored 79/100 with near-perfect sustainability metrics while its price appreciated from $150.58 to $166.36 (hovering around $169 at the time of writing). The framework didn't predict this movement; it identified dividend quality that the market gradually recognized.
This case study examines what systematic analysis sees that intuition misses and why a 2.09% yield can represent superior quality compared to 5% alternatives.
The Framework That Found It: Breaking Down the 79/100 Score
Our comprehensive dividend scoring methodology evaluates every S&P 500 dividend-paying stock across four weighted dimensions totaling 100 points. We've published the complete methodology in our foundational piece on Build Your Own Dividend Score: 4 Pillars Every Income Investor Should Know, but understanding how QUALCOMM scored in each component reveals why this semiconductor company scored higher than traditional dividend names on our lens.
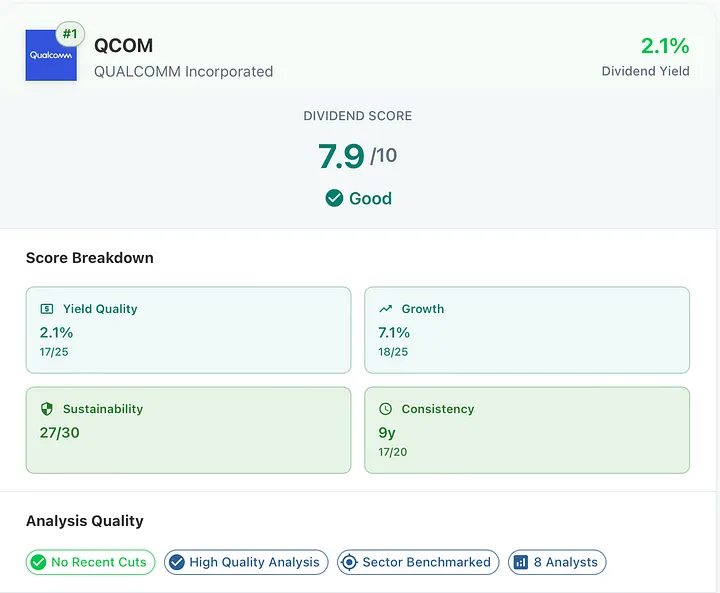
Figure 1. QUALCOMM's October dividend scorecard: 7.9/10 overall, led by near-perfect sustainability metrics (27/30) and a 9-year streak of uninterrupted dividend growth.
Yield Quality: 17/25 Points
This pillar evaluates whether the current dividend yield falls within an optimal range (not too high to signal distress, not too low to be meaningful). Our framework targets the 2-6% sweet spot where yields are sustainable enough to grow over time. We also apply sector-relative bonuses that reward companies whose yields exceed industry peers while maintaining stability.
QUALCOMM's 2.09% yield earned 17 points (not maximum, but strategically positioned). The yield sits at the lower end of our optimal range, but QUALCOMM gained sector-relative bonuses for exceeding technology peer dividend averages. More critically, the modest yield left enormous room for future growth.
Growth Potential: 18/25 Points
This pillar combines historical dividend growth rates with forward-looking business momentum. We analyze not just whether a company has increased its dividend, but whether that growth is sustainable based on revenue and earnings trends. The framework incorporates TTM (trailing twelve months) revenue and earnings growth metrics and integrates analyst estimates for 2027-2029 earnings projections, using business performance as a leading indicator of dividend sustainability. Sector-relative positioning reveals whether a company is outpacing or lagging its peers.
QUALCOMM scored 18/25 here, built on a 7.11% historical dividend growth rate sustained over 9+ years. The 18-point score signals strong but not exceptional growth (sustainable, steady dividend expansion rather than aggressive increases that might prove unsustainable). For perspective, a 7% dividend growth rate means QUALCOMM's current 2.09% yield becomes a 4.13% yield-on-cost in ten years, far exceeding most "high yield" stocks that don't grow their dividends at all.
Sustainability: 27/30 Points
This pillar receives the heaviest weighting at 30% of the total score because a cut dividend compounds investor losses through both capital decline and income elimination. We examine payout ratios with sector-specific adjustments, free cash flow coverage to ensure dividends come from actual cash generation, balance sheet strength through current ratio, debt-to-equity, and interest coverage metrics, and forward-looking sustainability by analyzing whether projected earnings will make today's payout ratio even more conservative.
QUALCOMM dominated here with 27/30 across all three months. This is where the semiconductor company separated itself from traditional dividend stocks. The score breakdown: perfect 8/8 on payout ratio (32.79% means QUALCOMM pays out less than one-third of earnings as dividends, leaving massive room for increases or economic downturns), perfect 8/8 on free cash flow coverage (cash generation substantially exceeds dividend obligations), strong 6/8 on financial health metrics (balance sheet, debt levels, interest coverage all comfortable), and full 3/3 on forward outlook (analyst EPS estimates show earnings growing faster than dividends, meaning the payout ratio will actually decrease over time). The 27/30 sustainability score means QUALCOMM's dividend isn't just safe; it's positioned to grow substantially without ever approaching dangerous payout levels.
Consistency: 17/20 Points
This pillar tracks the historical record of consecutive dividend increases and the absence of cuts, analyzing up to 10 years of dividend history and applying sector-relative bonuses for companies demonstrating profitability stability within their peer group. A 9-year streak that survived economic cycles scores higher than 9 years during only favorable conditions.
QUALCOMM earned 17/20 points for 9 consecutive years of dividend increases with zero cuts. The streak survived the 2020 pandemic, supply chain disruptions, and semiconductor industry volatility. The framework recognized that QUALCOMM maintained this consistency while growing the business, not by refusing to invest in the future. Many dividend aristocrats maintain streaks by essentially liquidating themselves (paying out ever-higher percentages of shrinking earnings). QUALCOMM's growing earnings base, combined with a consistent payout ratio and increasing dividends, signals sustainable quality rather than manufactured consistency.
The Three-Month Validation: August to October
On August 1, 2025, our framework scored QUALCOMM at $150.58 with a 2.35% yield 81/100, ranking it second on the dividend lens that month. Traditional dividend investors filtered it out entirely (wrong sector, yield too low to bother analyzing). But the framework saw something different: a 27/30 sustainability score, a conservative 32.79% payout ratio, and a solid 7.11% dividend growth rate. These fundamentals signaled a quality that the market hadn't yet fully recognized.
By September 1, QUALCOMM had appreciated to $160.73, compressing the yield to 2.14% as the price rose faster than the dividend. The score held at 79/100 (unchanged fundamentals, just reflected at a higher price point). The consistency was consistent with the August reading: this wasn't temporary arbitrage or a one-month anomaly, but sustainable dividend quality that the market was beginning to price in.
October 1 brought QUALCOMM to $166.36, with the price up 10.5% from the August level. The yield compressed further to 2.09%, but the score remained rock-solid at 79/100. More significantly, QUALCOMM moved from second to first on the dividend lens. Whether this three-month period represents genuine quality recognition or temporary market momentum remains to be seen across longer timeframes. Three months represents an extremely short timeframe for validating any investment methodology, particularly for dividend investing, where quality reveals itself across economic cycles spanning years. The consistency and returns demonstrated here illustrate how the framework operates, not proof of long-term outperformance.
Framework Strengths and Limitations
What This Approach Does Well
- Provides comprehensive dividend evaluation across sustainability, growth, yield quality, and consistency that yield-first screening misses
- Weighs sustainability at 30% of the total score, identifying quality before market pricing fully reflects it
- Incorporates forward-looking metrics from analyst estimates rather than relying solely on historical data
- Prevents systematic exclusion of entire industries through sector-agnostic evaluation
- Maintains a transparent, repeatable methodology where every stock receives identical evaluation regardless of size, sector, or market popularity
What This Approach Cannot Do
- Predict black swan events, company-specific crises, or industry disruptions that force dividend cuts despite strong historical metrics
- Overcome limitations of analyst estimate quality and availability (companies with minimal coverage receive less forward-looking context)
- Capture cyclical patterns longer than the 10-year historical data window
- Account for management changes, regulatory shifts, or competitive disruptions that haven't yet appeared in financial data
- Provide intraday timing signals or predict short-term price movements
Conclusion
When a 2.09%-yielding semiconductor company scores highest on a dividend lens, it signals either a flawed methodology or a broken assumption about where dividend quality exists. Three months of data can't prove which. But QUALCOMM's consistent 79/100 score across changing market conditions demonstrates what the framework measures: payout sustainability, growth capacity, financial strength, and dividend reliability regardless of sector labels.
Traditional dividend screening eliminates entire industries before evaluating a single financial metric. This approach worked when dividend excellence concentrated in regulated utilities and consumer staples monopolies. It fails when business model evolution creates stable cash flows in unexpected places. Technology licensing revenue, healthcare patent portfolios, and platform subscription economics now generate returns more predictable than many legacy dividend sectors. The framework doesn't predict where quality will emerge; it measures whether quality exists today using identical criteria across all companies.
The practical implication is straightforward: investors who filter by sector before analyzing fundamentals will find some dividend opportunities and miss others. Those who evaluate payout ratios, cash flow coverage, balance sheet strength, and growth consistency across all sectors will find more. QUALCOMM at $150.58 was available to anyone willing to look beyond "Technology / 2.09% yield." The framework looked. Traditional screening didn't. That difference matters more than any three-month return.
Build and explore your own dividend score, and read the complete methodology, on the Strategies page of our platform.
This article was originally published on Medium on 23 October 2025. All data, prices, and results reflect information available at the time of publication. We have retained the original publication date on this platform for consistency
Disclaimer: This analysis is for educational purposes only and should not be considered investment advice. Dividend payments are not guaranteed, and companies can reduce or eliminate dividends at any time, regardless of historical track records or analytical scores. Past performance does not predict future results. Always conduct your own research and consider consulting with financial professionals before making investment decisions.