
Micron: A Cyclical Value Lesson From $50 to $366
Micron scored highest on the value lens in the S&P 500 for April, even after tripling. This is what happens when earnings outrun price in a cyclical business.
On April 1st, Micron Technology (MU) scored highest on the value lens in the S&P 500. That was unexpected. Micron had moved from roughly $50 in late 2023 to $338 by the time the model published its April rankings, and "stock that just tripled" is not the first description that comes to mind for a value candidate. Our first reaction was to check the inputs.
The inputs were correct. MU scored 81 out of 100, the top score in the S&P 500 universe for the month, with a perfect 35/35 on business quality and a perfect 20/20 on DCF margin of safety. The traditional valuation leg was reasonable rather than spectacular, but the underlying numbers said the same thing: the stock was not expensive on the cash flow base it was generating today, even after the run.
In the 35 days since, MU has moved from $337.84 to $640.20. This article works through how the framework arrived at the score, why the chart was not the signal, and what the case study reinforces about how price and value actually relate in cyclical businesses.
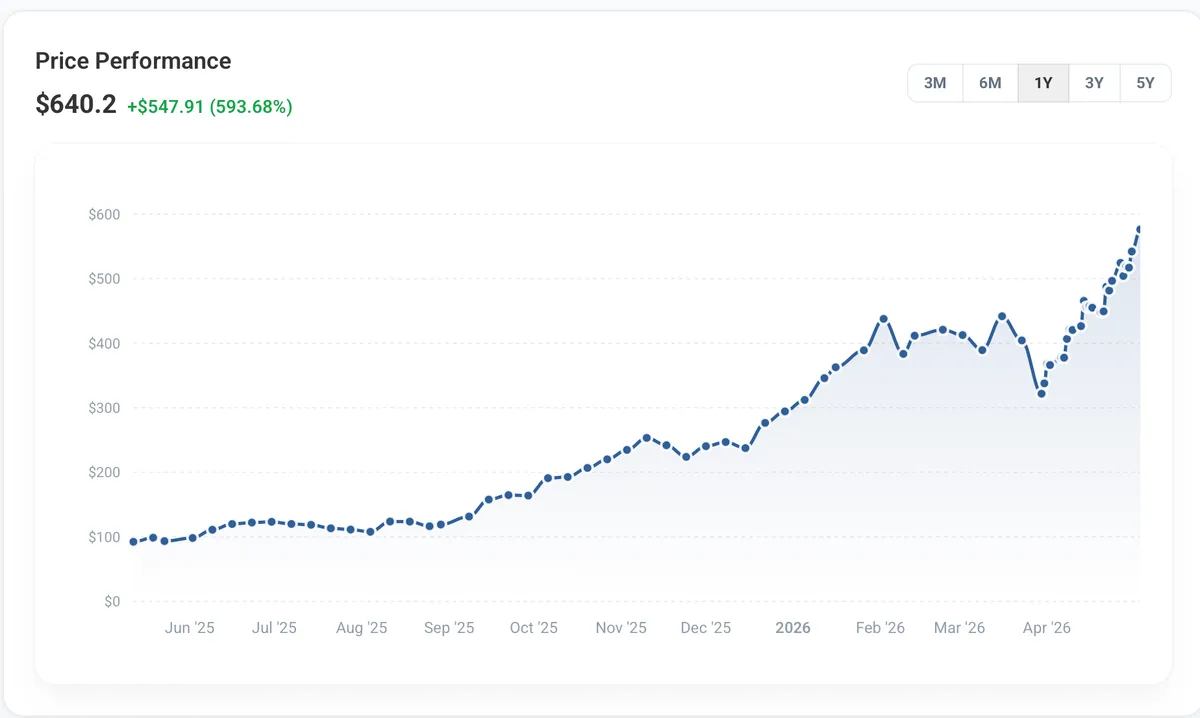 Figure 1. Micron's run from cycle-low to all-time-high. On April 1 it traded at $337.84; five weeks later it traded above $640.
The Framework, in One Paragraph
We've written about our value methodology in detail. Quick recap: every month we run the S&P 500, 400, and 600 through a 100-point scoring system across four dimensions. Traditional valuation gets 30 points (P/E, P/B, EV/EBITDA). DCF margin of safety gets 20. Business quality gets 35, the largest weight, because this is where value traps are exposed. Growth sustainability gets the final 15.
Every name has to clear a profitability gate before it gets scored. We exclude financial services, real estate, basic materials, and consumer cyclical. Sector concentration is capped at two names per sector. The top scorers from each universe surface for that month.
The algorithm doesn't know that Micron tripled. It looks at the financial statements, runs the math, and ranks. In April, it ranked MU first.
What the System Saw
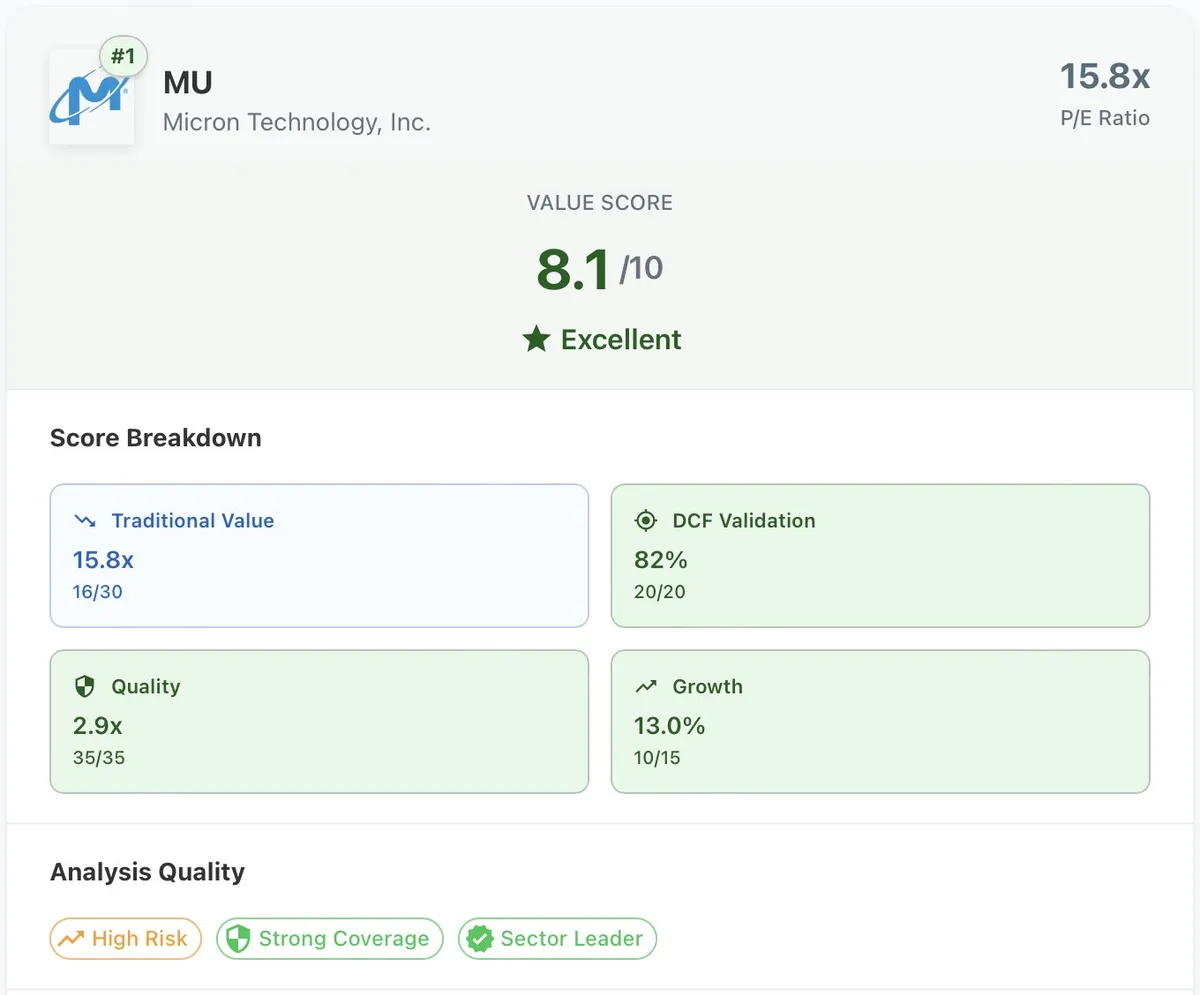 Figure 2. Micron's April value card: 8.1/10 overall, #1 in the S&P 500, with a perfect 35/35 quality score and 82% DCF margin of safety. Note the High Risk badge: the framework flags the cyclicality alongside the score.
Here's MU's full April scorecard:
Table 1. Micron's full April 2026 value scorecard across the four dimensions: traditional valuation, DCF margin of safety, business quality, and growth sustainability.
| Dimension | Score | Key Metrics |
|---|---|---|
| Traditional Value | 16/30 | P/E 15.76, P/B 5.25, EV/EBITDA 10.21 |
| DCF Valuation | 20/20 | Fair value $586.77, 82% margin of safety |
| Business Quality | 35/35 | ROE 40.8%, ROIC 27.7%, D/E 0.15, interest coverage 80x |
| Growth Sustainability | 10/15 | Revenue growth 13.0%, FCF yield 5.8% |
| Total | 81/100 | Scaled: 8.1/10, Rank #1 SP500 |
The traditional value bucket is where MU lost most of its points. A P/E of 15.76 isn't bargain-bin cheap, and the price-to-book of 5.25 reflects that the market is paying well above accounting equity. That's fair. The screen wasn't pretending MU looked like a 7x earnings homebuilder.
But everything else was off the charts.
Quality: A Perfect 35
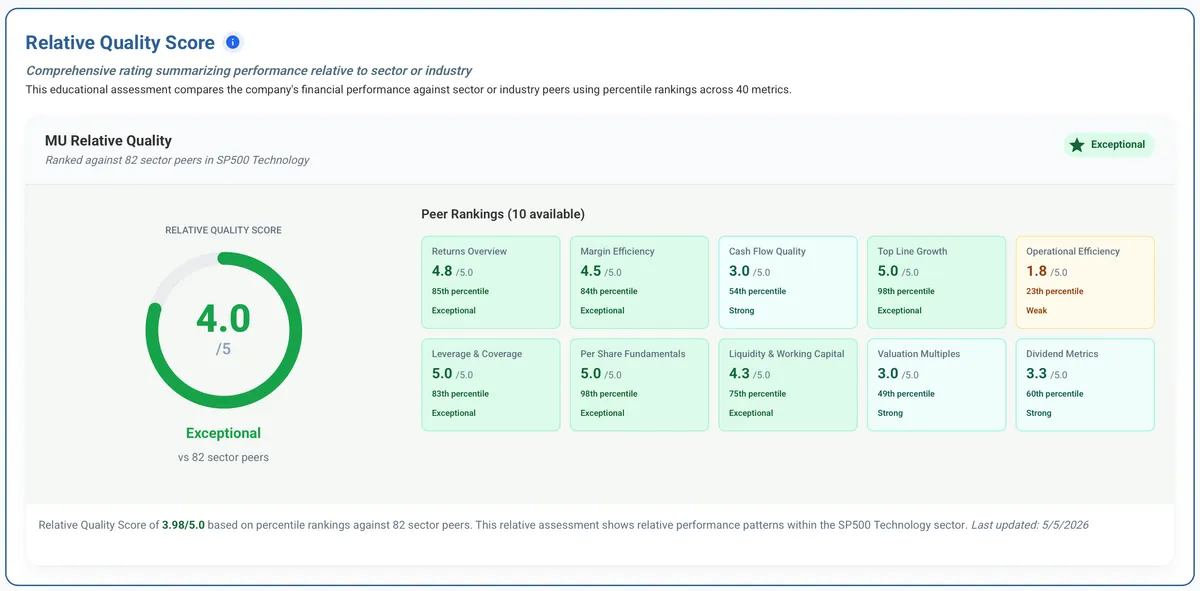 Figure 3. Micron rates 4/5 on our relative quality framework, which scores each company against its peer group. The relative view captures the cyclical lift: MU's returns and margins are far ahead of the median semiconductor name today. Full breakdown on our Peer Comparison page.
The quality dimension is where this whole thesis lives, and MU scored every available point.
A 40.8% return on equity. A 27.7% return on invested capital. On its current capital base, the company was generating returns most software businesses would be proud of.
A 41.5% net profit margin. Not a niche-software margin. Not a luxury-brand margin. This is a memory chip company, historically the textbook commodity business, running at the kind of profitability that screams pricing power.
A debt-to-equity of 0.15 with 80x interest coverage. Translation: the company generates eighty times more operating income than it needs to service its debt. The balance sheet is a fortress. There is essentially no financial risk in the equity story right now.
A company generating 40%+ return on equity while trading at a discount is fundamentally different from a company with 2% ROE at the same valuation. The former demonstrates pricing power, competitive advantages, and efficient capital allocation.
DCF: 82% Upside Despite the Run
The DCF leg of the score is what makes the cyclical-stock logic click. Our model estimated an intrinsic value of $586.77 per share against the $337.84 April price, an 82% margin of safety. The DCF read the same way the quality metrics did: even after the run from $50, the cash flow base was big enough that the model estimated the stock priced below its intrinsic-value estimate. You can explore MU's full DCF breakdown on our Valuation Analysis page.
Growth: Solid, Not Spectacular
13.0% revenue growth, 5.8% FCF yield. Maximum points on revenue trajectory but only one point on FCF trend (capex was running heavy as Micron built HBM capacity, exactly what you'd expect from a company harvesting a cyclical upturn). Total: 10/15. Good enough. The growth dimension exists to filter out melting ice cubes. MU is the opposite of a melting ice cube.
The Lesson Hidden in a Memory Stock
Here's the thing nobody tells you when they teach value investing. Most of the time, "value" just means a low multiple. A 7x P/E homebuilder. A 12x earnings industrial. The classic Graham screen.
But the multiple is just the numerator over the denominator. Price doesn't determine value. Earnings do.
Look at what actually happened at Micron over the last five fiscal years (annual diluted EPS, from the company's filings):
Table 2. Micron's reported revenue, net income, and diluted EPS over the last five fiscal years, plus current trailing-twelve-month EPS. The cycle low sits in FY2023; TTM EPS is now over four times the FY2025 level.
| Fiscal Year | Revenue | Net Income | Diluted EPS |
|---|---|---|---|
| FY2021 | $27.7B | $5.86B | $5.14 |
| FY2022 | $30.8B | $8.69B | $7.74 |
| FY2023 | $15.5B | -$5.83B | -$5.34 |
| FY2024 | $25.1B | $0.78B | $0.70 |
| FY2025 | $37.4B | $8.54B | $7.59 |
| TTM (current) | n/a | n/a | $21.44 |
When MU was trading around $50 in 2023, the company was losing nearly $6 per share. There was no meaningful P/E ratio, only losses and a market betting that the cycle would turn. By the time the stock reached $366, trailing-twelve-month EPS had reached $21.44. At the April price of $337.84, that's a 15.76x multiple, exactly what the scorecard showed.
Look at the trajectory again. EPS went from -$5.34 to $21.44 in roughly two years. The stock multiplied roughly seven-fold over the same period. But TTM earnings growth was running at over 400% year-on-year, faster than the stock could keep up with. Every quarter the chart looked more euphoric, the multiple actually got cheaper.
The algorithm doesn't have price-anchored intuition. It just runs the numbers.
The Cyclical Caveat
We need to be honest about one thing. MU is a cyclical, and our system has historically been cautious with deep cyclicals. This is why we exclude basic materials and consumer cyclical sectors entirely, since trailing multiples on commodity producers tend to look cheapest at the cycle peak.
Semiconductors live in the technology sector and don't trip that exclusion, but the same logic partially applies. If memory pricing rolls over, those 41% margins will compress, the DCF base case will shift, and the multiple that looks like 16x today could be 30x on next year's earnings.
That's a real risk. It's also why we publish the full scoring breakdown: every dimension, every metric, every weight. The system isn't telling you Micron is risk-free. It's showing you that on the data we can measure today, the model estimated the gap between price and its intrinsic-value estimate was the widest in the S&P 500.
What the system can't see is the next memory cycle. Investors have to make that call themselves. The framework surfaces the candidate. The differentiators (DCF, quality, growth) help you judge whether it's a trap. The cycle call is yours.
What Happened Next
In the 35 days after MU surfaced, the market did what the market eventually does when price and value diverge: it closed the gap.
- April 1, 2026: Trading at $337.84
- May 6, 2026: Trading at $640.20
The numbers the scorecard already reflected showed up in headlines, and the stock re-rated to match.
What This Reinforces
1. The denominator matters more than the numerator. A 16x multiple on a business compounding earnings at 30%+ is cheaper than a 10x multiple on a business going sideways. The screen isn't price. The screen is price relative to what the business is actually earning.
2. Quality is the moat against the trap. Strip out the 35-point quality block from our scoring and you'd own twice as many losers. ROE, ROIC, balance sheet strength, and margins are what separate a cheap stock from a cheap stock that gets cheaper.
3. Let the data, not the gut, do the screening. A gut read called Micron a momentum trap dressed up in value clothing. The data showed a different picture. This is the entire reason we built the framework: to get cognitive bias out of the way at the screening stage so candidates aren't filtered out before they're even examined.
Not every candidate the framework surfaces will move like this. Many won't. Some will lose money.
But occasionally the data describes a setup where price is sprinting and earnings are sprinting harder. The framework's job is to surface that setup with the full breakdown attached, so you can examine it yourself.
You can build and run your own scoring views, with the dimensions and weights you choose, on the Strategies page.
Disclaimer: This article is for informational and educational purposes only and does not constitute investment advice. The stocks and strategies discussed should not be considered recommendations to buy or sell any security. Past performance does not guarantee future results. All investing involves risk, including the loss of principal. Do your own research and consult with a financial advisor before making investment decisions. The authors may or may not hold positions in the securities mentioned.