
Oracle's $553 Billion Bet: AI Infrastructure Goldmine or Balance Sheet Time Bomb?
Oracle is down 60% from its peak with $162 billion in debt, negative free cash flow, and securities fraud lawsuits. But it also has a $553 billion backlog and 44% cloud revenue growth. The 5D Framework separates the noise from the signal.
Oracle Corporation (ORCL) spent decades as the enterprise database company. Reliable, profitable, and, if we are being honest, a bit boring. Then Larry Ellison decided to go all-in on AI infrastructure, and the stock became one of the most volatile names in large-cap tech.
From a peak near $346 in September 2025, ORCL fell roughly 60% to a recent low of $135.26 in February 2026. The Q2 FY2026 earnings report in December 2025 missed on revenue while revealing CapEx guidance far above expectations and deeply negative free cash flow. Blue Owl Capital pulled out of a $10 billion data centre deal intended to serve OpenAI. Securities fraud class action lawsuits followed. A Q3 FY2026 earnings beat in March 2026 (revenue up 22%, cloud revenue up 44%, EPS $1.79 vs. $1.70 expected) provided a partial recovery though the stock price has again returned to $138.
The quality score of 3.0/5.0 and analyst sentiment of 3.6/5.0 tell a more nuanced story than the crash suggests. FY2025 EBITDA margins of 41.7% are strong, and analyst estimates project revenue reaching $130 billion by FY2028. But total debt sits at $104 billion, free cash flow has turned negative, and the holdings score of 1.7/5.0 reflects widespread insider selling and institutional caution.
We applied the 5D Framework to separate what the operating data actually shows from the narrative.
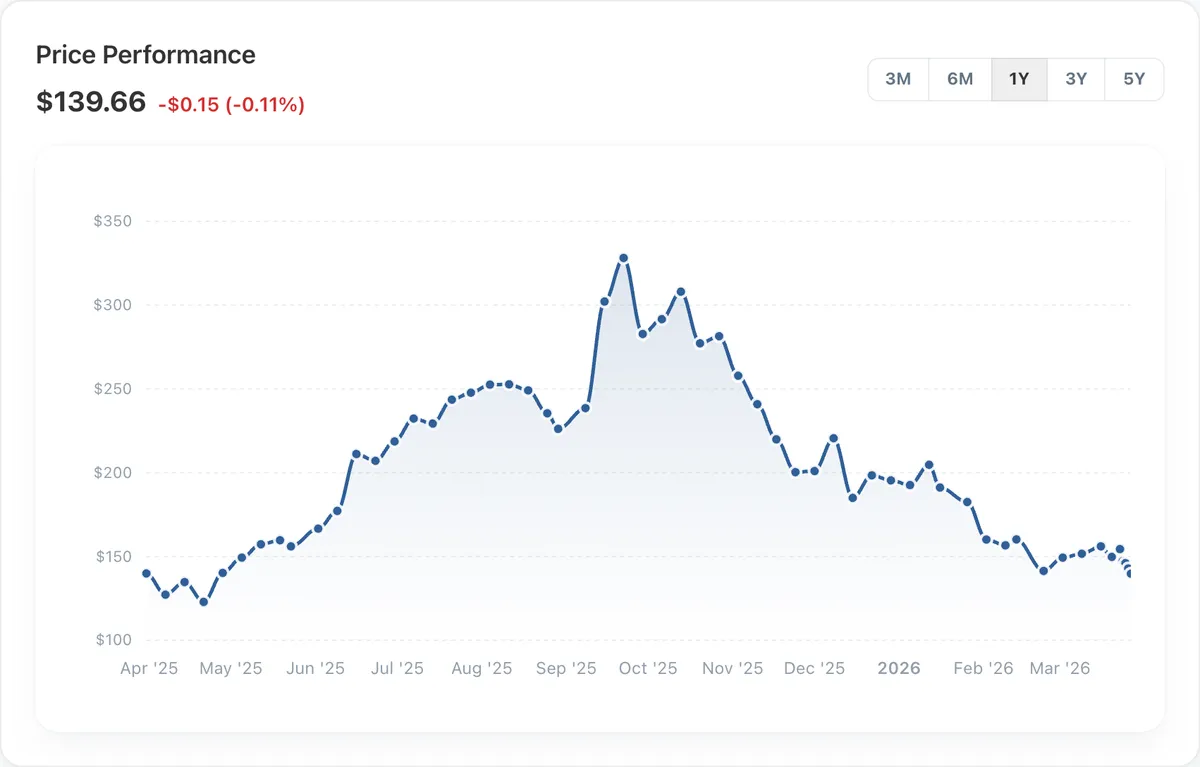 Figure 1. ORCL has fallen roughly 60% from its September 2025 peak near $346, with the steepest decline following the December 2025 earnings miss.
Dimension 1: Business Quality (2.995/5.0)
Oracle's financials present a business in the middle of a dramatic transformation. Revenue has grown from $37.0 billion (FY2016) to $57.4 billion (FY2025), a 9-year CAGR of roughly 5%. The cloud business has been the recent accelerant, with Q3 FY2026 showing 22% revenue growth and 44% cloud revenue growth.
Margins are strong in absolute terms but telling a mixed story on the trend. FY2025 EBITDA margins of 41.7% are healthy, and operating margins of 30.8% are solid. Net margins of 21.7% have recovered from the Cerner acquisition drag of 17% (FY2023). But gross margins have declined materially: from 80.3% in FY2017 to 70.5% in FY2025. This reflects the capital-intensive nature of building data centers compared to Oracle's historically asset-light licensing model.
Return metrics are difficult to read because Oracle's aggressive buybacks have compressed shareholder equity against $104 billion in debt. ROE of 60.8% (FY2025) is inflated by the thin equity base, with debt-to-equity at 5.09x. ROIC tells a cleaner story: 10.9% in FY2025, down from 12.9% in FY2019 when Oracle was a capital-light business.
The balance sheet is the most striking feature. Total debt has risen from $43.9 billion (FY2016) to $104.1 billion (FY2025). Interest coverage sits at 4.9x, down from 8.6x in FY2016. Free cash flow, which averaged $12 billion annually from FY2016 to FY2024, turned negative ($394 million) in FY2025. The pillar scores reflect this: leverage and coverage earns 1.5/5.0, the weakest component.
The dividend has grown steadily from $0.59 (FY2016) to $1.70 (FY2025), with a yield of 1% and a conservative 38% payout ratio. The dividend score of 4.25/5.0 is one of the strongest pillars, though the question is how sustainable dividend growth is amid massive CapEx commitments.
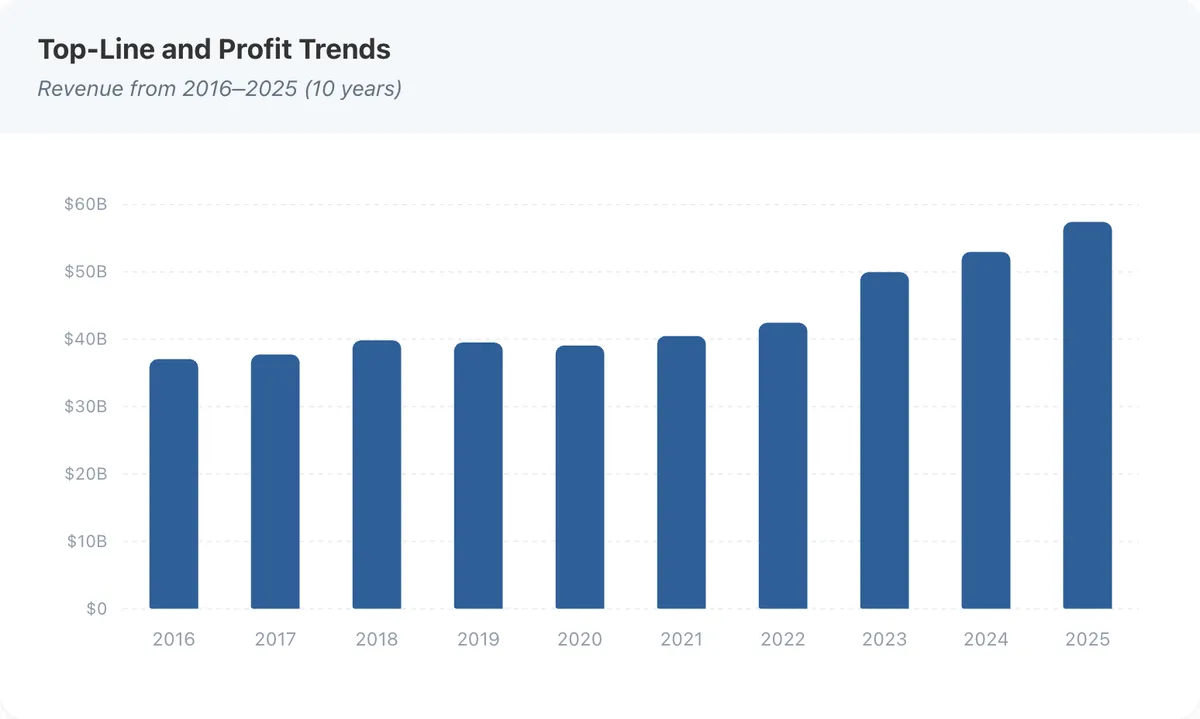 Figure 2. Revenue has accelerated in recent years, driven by cloud infrastructure growth, while net income has recovered from the FY2023 Cerner integration trough.
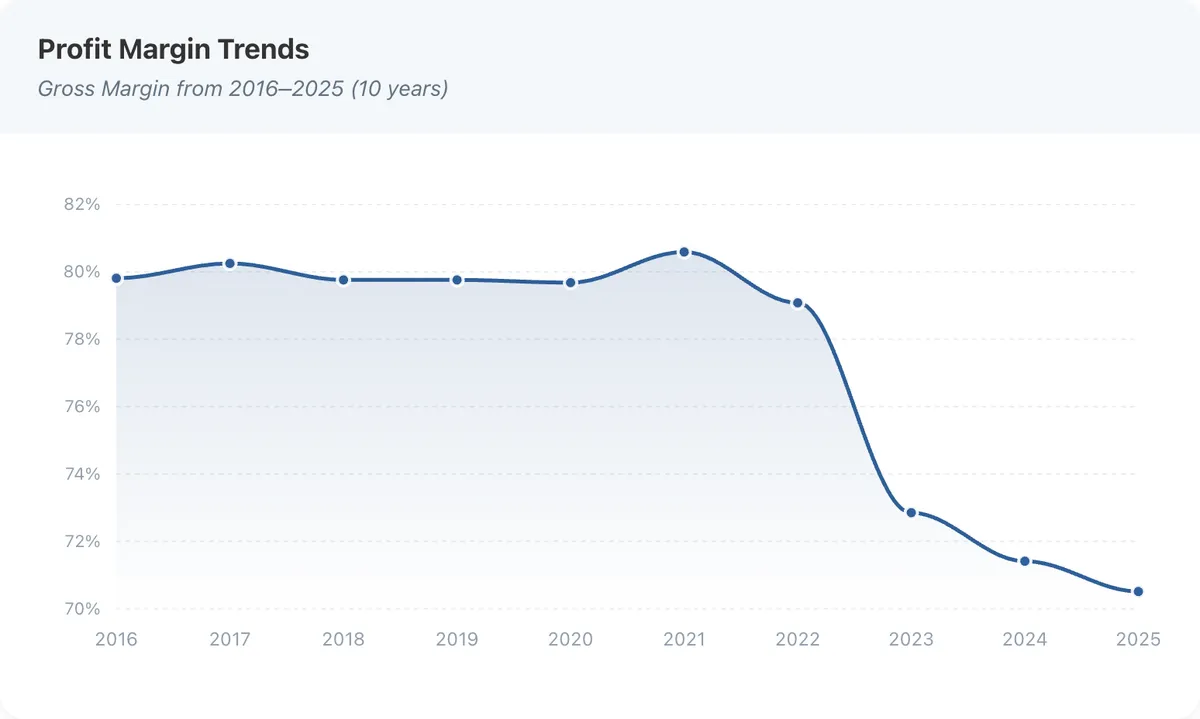 Figure 3. EBITDA margins sit at 41.7% in FY2025, but gross margins have declined from 80% to 70.5% as the business shifts from licensing to capital-intensive cloud infrastructure.
A 2.995 score accurately reflects a business with strong margins and improving revenue growth that is simultaneously loading its balance sheet with debt, burning through cash, and betting its future on infrastructure returns that have not yet materialized.
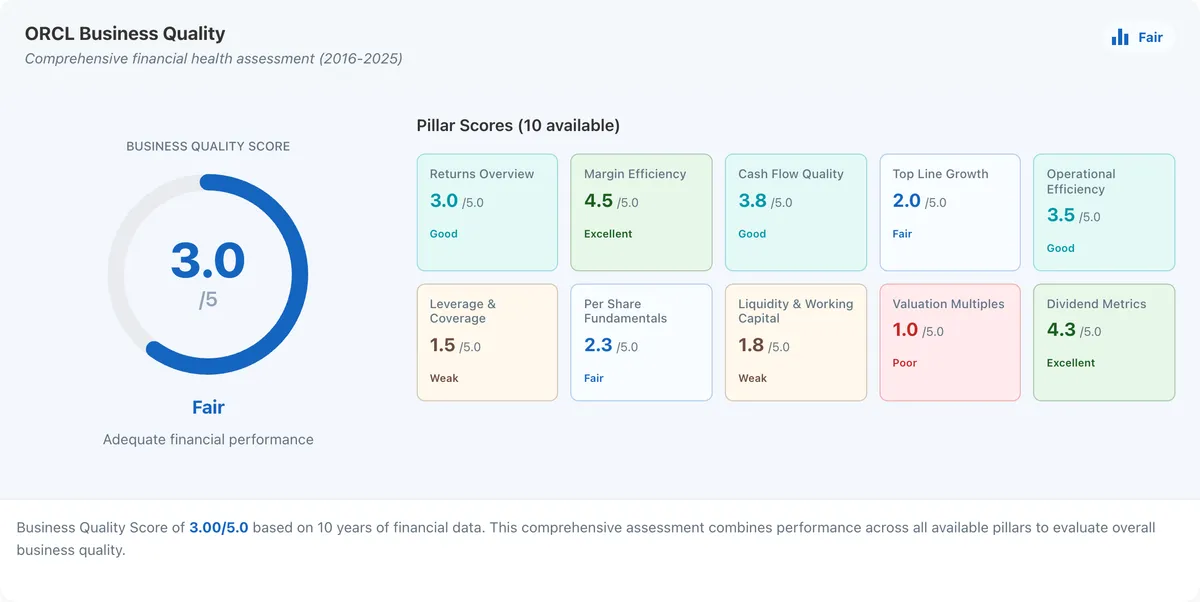 Figure 4. Oracle earns a 2.995/5.0 quality score. Strong margins (4.5/5.0) and dividends (4.25/5.0) are offset by leverage (1.5/5.0) and valuation multiples (1.0/5.0). Full breakdown on our Quality Analysis page.
Dimension 2: Peer Comparison (3.12/5.0 Sector | 2.89/5.0 Industry)
Among 80 Technology sector peers and 14 Software Infrastructure competitors, Oracle's profile splits clearly between margin strength and balance sheet weakness.
Oracle leads on profitability. EBITDA margins rank in the 85th percentile among tech sector peers, operating margins in the 77th, and net margins in the 77.5th percentile. ROE registers at the 83.5th percentile, though this is inflated by the leveraged equity base.
The leverage picture is stark. Debt-to-capital sits in the 5th percentile, meaning 95% of tech sector peers carry less debt. Net debt-to-EBITDA ranks in the 7th percentile. Interest coverage is in the 10th. Among the 14 direct Software Infrastructure peers, the picture is similar: debt-to-capital in the 8th percentile, interest coverage in the 18th. No other large-cap software company has taken on this level of financial leverage.
On growth, Oracle sits mid-pack. Revenue growth of 14.9% ranks in the 56th percentile, and EBIT growth of 30.4% ranks in the 65th. Respectable but not exceptional given the leverage deployed. Free cash flow yield is at the 0th percentile, and asset turnover sits in the 5th, reflecting the data center buildout.
The peer scores of 3.12 (sector) and 2.89 (industry) capture a company that generates best-in-class margins but has an outlier balance sheet in its peer group. The bet is that the infrastructure investment will translate into revenue growth that brings the leverage ratios back in line.
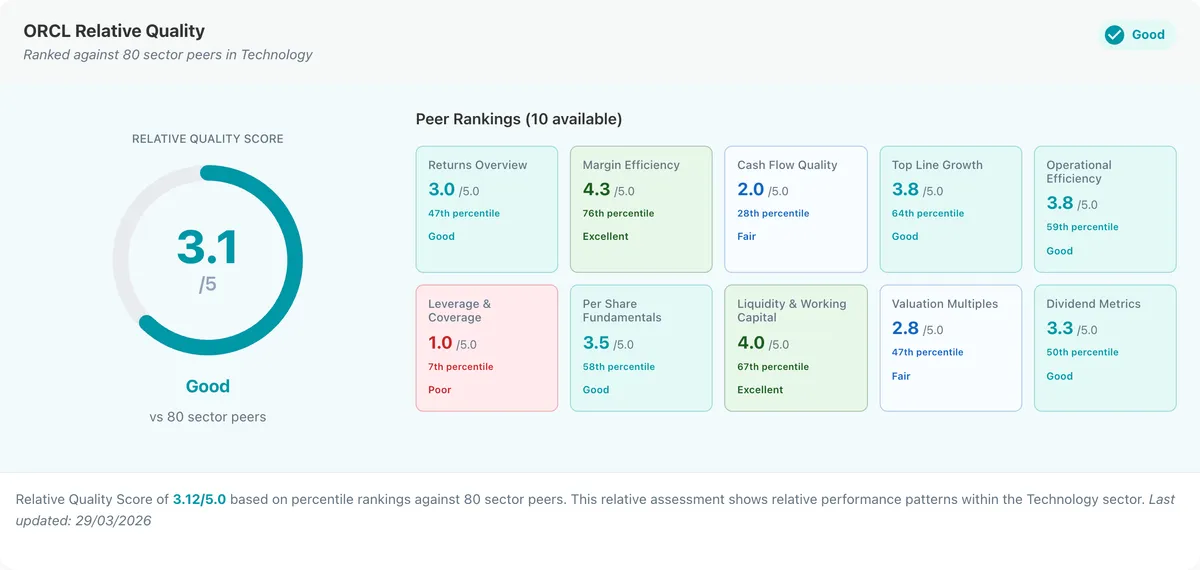 Figure 5. Oracle ranks above the 77th percentile on margins and profitability but sits in the bottom 10th percentile on leverage metrics. Full breakdown on our Peer Comparison page.
Dimension 3: Valuation (Multiple Angles, Wide Range)
Our DCF model produces an intrinsic value of $303.75, implying 117.5% upside from the current $139.66. This uses a 10.13% WACC, a beta of 1.648, and critically, analyst-consensus revenue growth of 40.5% CAGR over the forecast period.
That growth rate deserves scrutiny. Oracle's historical 9-year revenue CAGR is roughly 5%, and TTM revenue growth is 14.9%. The 40.5% figure comes from analyst estimates that project revenue reaching $67.2 billion in FY2026, $88.6 billion in FY2027, and $129.8 billion in FY2028. These projections are grounded in Oracle's reported remaining performance obligations of $553 billion, which represent contracted future revenue. If the backlog converts as projected, the growth rate is plausible. If it does not, the DCF significantly overstates intrinsic value. At the historical CAGR of 5%, the intrinsic value would be dramatically lower. The breakeven growth rate is 25% at which the intrinsic value is equal to the current price.
Forward P/E: At $139.66 and FY2026 estimated EPS of $7.48, Oracle trades at 18.7x forward earnings. This is below the Technology sector median P/E of 29.5x and below Oracle's own historical median of 24.3x. On a PEG basis, the 0.74x ratio (vs. sector median 1.11x) suggests the market is not fully pricing in the expected earnings acceleration.
Valuation multiples vs. peers: On trailing P/E of 24.6x, Oracle sits at the 61st percentile of the tech sector. On EV/EBITDA of 17.9x, it is slightly below the sector median of 19.9x. But on EV/Sales of 8.2x, Oracle trades above the sector median of 5.8x, reflecting the premium revenue multiple despite compressed earnings. The composite peer-implied price of $142.81 suggests roughly fair value on current multiples, while the blended implied price of $223.28 (incorporating the DCF) points to meaningful upside.
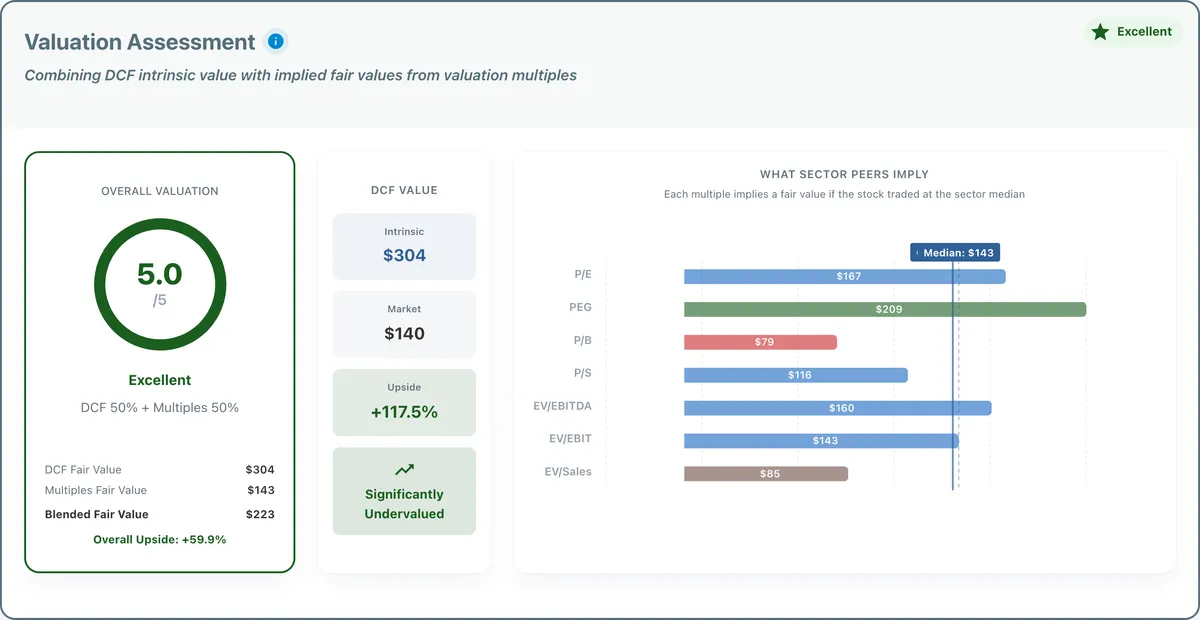 Figure 6. The DCF intrinsic value of $303.75 implies 117.5% upside, but this depends heavily on analyst-consensus growth rates that imply revenue more than doubling in three years. The peer-implied composite of $142.81 suggests near fair value on current multiples. Explore scenarios on our Valuation Analysis page.
Dimension 4: Analyst Sentiment (3.6/5.0)
Wall Street leans bullish. Of 86 analyst ratings, 55 are Buy, 27 are Hold, and 4 are Sell. The consensus price target of $285.39 (median $300) implies over 100% upside. The range spans from $160 to $400, reflecting genuine disagreement about the trajectory.
Earnings growth and analyst coverage both score a perfect 5.0/5.0. Analysts project EPS of $7.48 in FY2026 (up from $4.46 in FY2025), $7.98 in FY2027, and $10.78 in FY2028, with 21-34 analysts covering each period. Revenue estimates are even more aggressive: $67.2 billion (FY2026), $88.6 billion (FY2027), and $129.8 billion (FY2028), representing 17%, 32%, and 47% growth respectively.
Recent analyst activity reflects the post-earnings reassessment. Deutsche Bank analyst Brad Zelnick reiterated Buy with a $300 target following Q3 results, noting "plenty to like in this print." Jefferies' Brent Thill maintained Buy but lowered to $320, writing that "the market may be overlooking ORCL's upside potential." On the bearish side, Melius Research's Ben Reitzes downgraded from Buy to Hold with a $160 target in February, citing debt and equity concerns.
The financial health rating of B (3.0/5.0) is the weakest sentiment component, reflecting analyst awareness that the leverage picture is a genuine risk factor even as they remain bullish on the revenue opportunity.
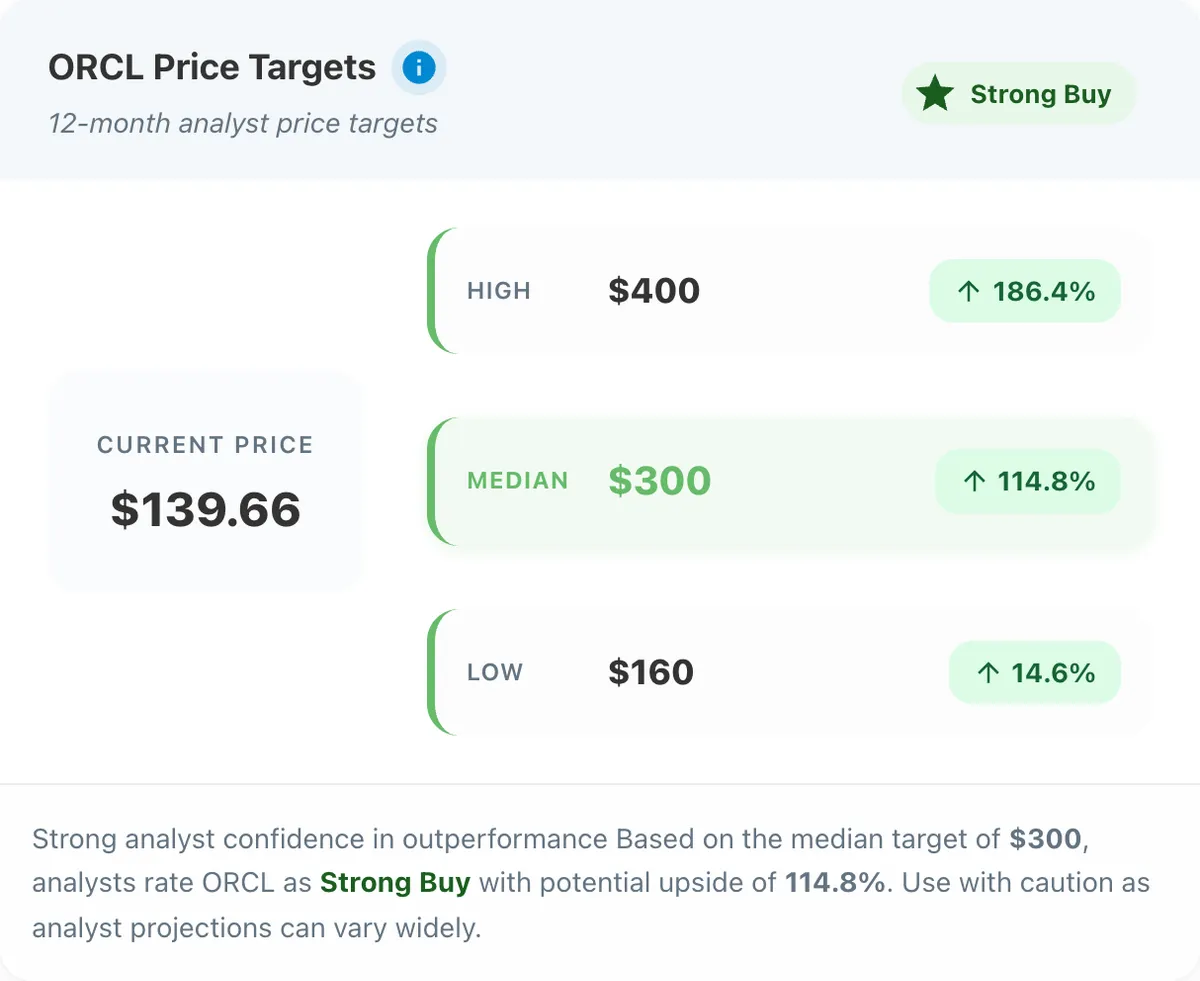 Figure 7. Analyst price targets range from $160 to $400, with a consensus of $285 implying over 100% upside from the current price.
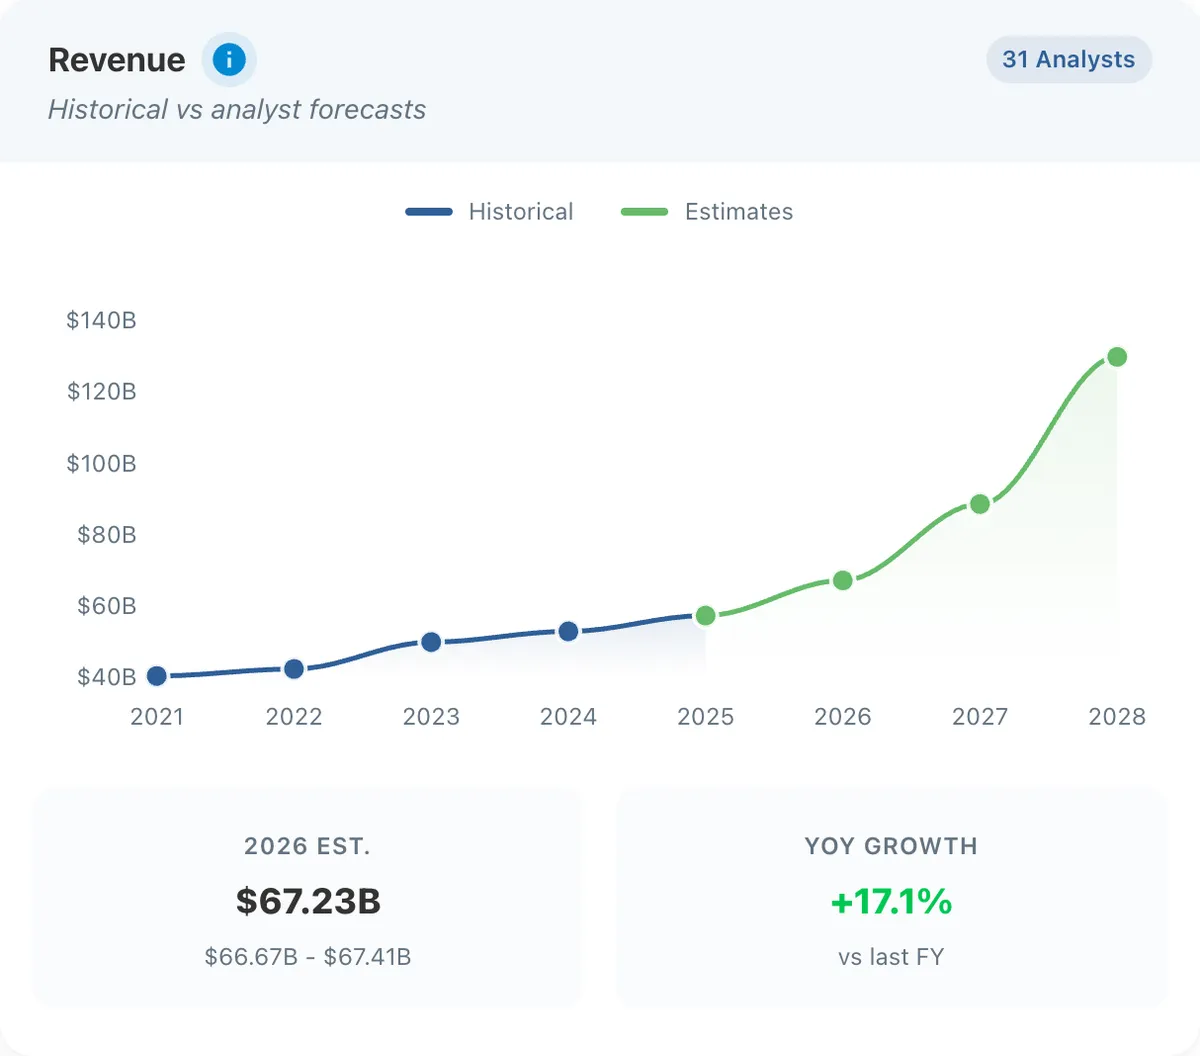 Figure 8. Analysts project revenue nearly doubling from $57 billion to over $129 billion by FY2028, driven by AI infrastructure contract conversions.
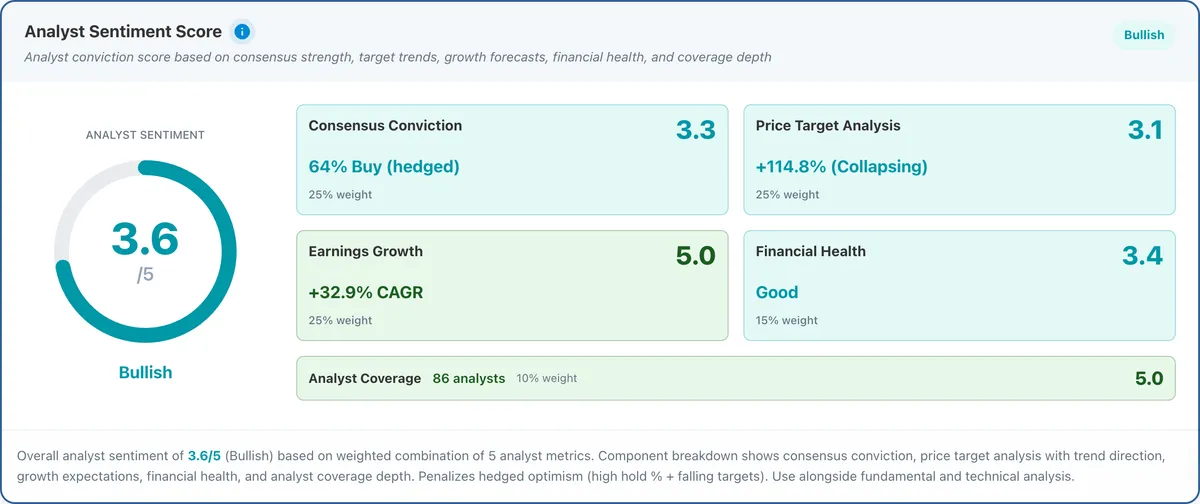 Figure 9. Analyst sentiment scores 3.6/5.0, with perfect marks on earnings growth and coverage. Consensus is Buy with a $285 target. Full estimates on our Analyst Estimates page.
Dimension 5: Holdings Analysis (1.7/5.0)
This is Oracle's weakest dimension, and the data paints a cautionary picture.
Insider selling has been heavy and one-directional. Over the past eight quarters, insiders disposed of over $3 billion in shares. The most concentrated selling came in Q2 2025 ($1.91 billion disposed across 39 transactions) and Q1 2025 ($705 million). Recent activity continued the pattern: CEO Clayton Magouyrk sold 10,000 shares at $155.23 in February 2026, CFO Douglas Kehring sold 35,000 shares at $194.89 in January 2026, and Mark Hura (President, Global Field Operations) sold 15,000 shares at $196.89 in December 2025. Director Jeffrey Berg sold 49,365 shares across multiple transactions near $282 in October 2025, and President Michael Sicilia sold 66,048 shares at prices ranging from $254 to $321 between August and September 2025. Insider purchases in the same period totaled just $1.1 million (5,980 shares), almost all from a single acquisition in Q3 2025.
Institutional flows are mixed with a bearish lean. In Q4 2025, there were 421 new positions and 1,861 increases, but also 505 closures and 1,564 reductions. The put-to-call ratio jumped to 1.53 from 1.03 in Q3, signaling rising hedging or downside bets. Total invested capital fell by $106 billion quarter-over-quarter, largely reflecting the stock price decline.
Among the top holders, there is one notable new entrant: Norges Bank (Norway's sovereign wealth fund) opened a brand new position of 22.2 million shares worth $4.34 billion in Q4 2025, a meaningful vote of confidence. Jane Street Group increased its stake by 76.8%, and Capital Research Global Investors increased by 27.6%. On the other side, JPMorgan Chase reduced by 17.9%, T. Rowe Price reduced by 12.7%, and Bank of America reduced by 8.6%.
The fund data reinforces the caution. In Q4 2025, 189 funds were net sellers versus 158 net buyers, with 29 million shares sold versus 24.5 million shares bought.
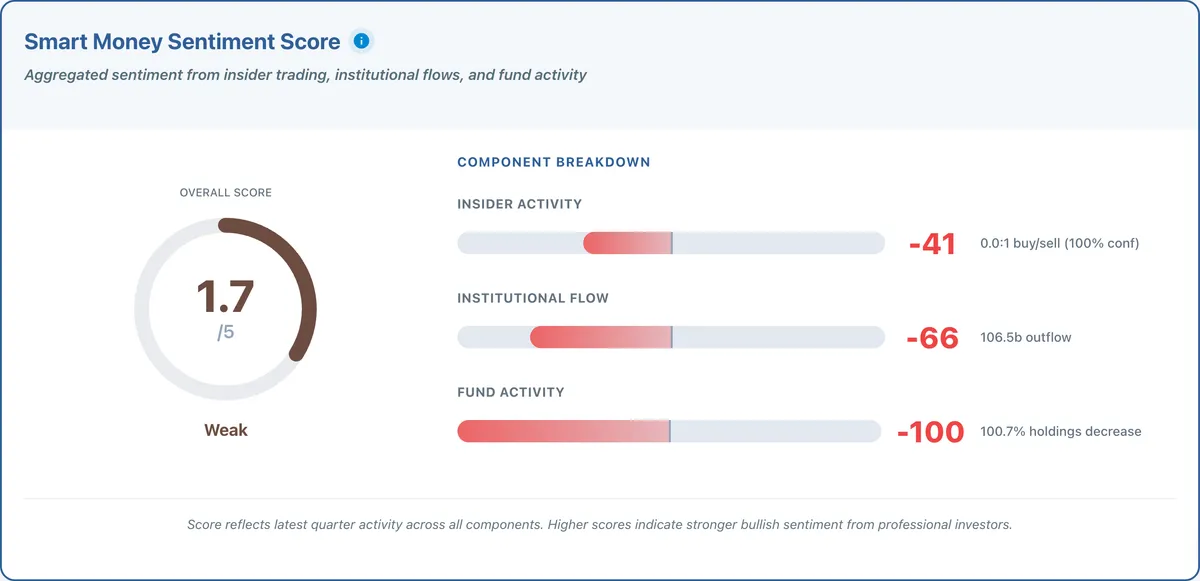 Figure 10. Holdings sentiment of 1.7/5.0 reflects persistent insider selling, rising put/call ratios, and net institutional outflows. Norges Bank's $4.3 billion new position is the standout contrarian signal. Full breakdown on our Holdings Analysis page.
What the Five Dimensions Tell Us
Oracle trades at 18.7x forward earnings, below its historical average and the tech sector median. Analysts project $130 billion in revenue by FY2028, backed by $553 billion in contracted backlog. On the surface, the stock looks cheap.
But every other dimension raises questions. Business quality and peer comparison both flag the same problem: $104 billion in debt, 5.09x debt-to-equity, negative free cash flow, and leverage worse than 95% of tech sector peers. The DCF model points to 117% upside, but only if you believe the analyst-consensus growth rate of 40.5%, a figure eight times Oracle's historical 5% CAGR. At the historical growth rate, the intrinsic value drops well below the current price.
Holdings is the most telling dimension. Insiders have sold over $3 billion in shares with virtually zero buying. The people closest to Oracle's execution are not betting on the backlog converting.
When the only dimension firmly in Oracle's favour is analyst sentiment, and the entire valuation case collapses without those same analysts' growth estimates, the discount looks less like opportunity and more like the market pricing in the risk correctly. The cloud growth is real, the revenue acceleration is real, but the balance sheet is stretched to historic levels and the margin of safety is razor-thin. Oracle is not a classic value play. It is a leveraged bet on AI infrastructure demand, and the data suggests the market understands that.
Explore the full analysis: Quality | Peers | Valuation | Analysts | Holdings
All financial data sourced from Stockoscope's database, powered by Financial Modeling Prep API. Market context informed by public reporting from CNBC, Futurum Group, Motley Fool, and Datacenter Knowledge. Prices and scores as of 30 March 2026.
This analysis is for informational purposes only and should not be considered personalised investment advice. Past performance does not guarantee future results.