
CLEAR Secure: A 42% Fall That Started on a Beat
CLEAR Secure beat on revenue, bookings, margins and cash flow, touched a 52-week high intraday, and closed the day flat. Six weeks later it was down 42% from that high. The 5D Framework separates what actually changed from what did not.

On 5 August 2026, before the market opened, CLEAR Secure (YOU) reported a quarter that beat on every line that mattered. Revenue of $277.8 million, up 26.6% against a consensus near $259 million. Total bookings up 32.8%. Adjusted EBITDA margin of 36.4%, a full 900 basis points better than a year earlier and past the company's own 35% long-term target. Free cash flow of $189 million, a record for a single quarter, with full-year cash flow guidance raised.
The stock opened sharply higher, printed a 52-week high of $69.07, and closed at $56.46. Against the previous close of $55.73, a quarter that beat on everything was worth about 1%.
Then it kept going. The shares fell in 14 of the next 17 sessions, and have carried on drifting since. At $40.11 they sit 42% below that August high, with no crash day and no bad news to point at.
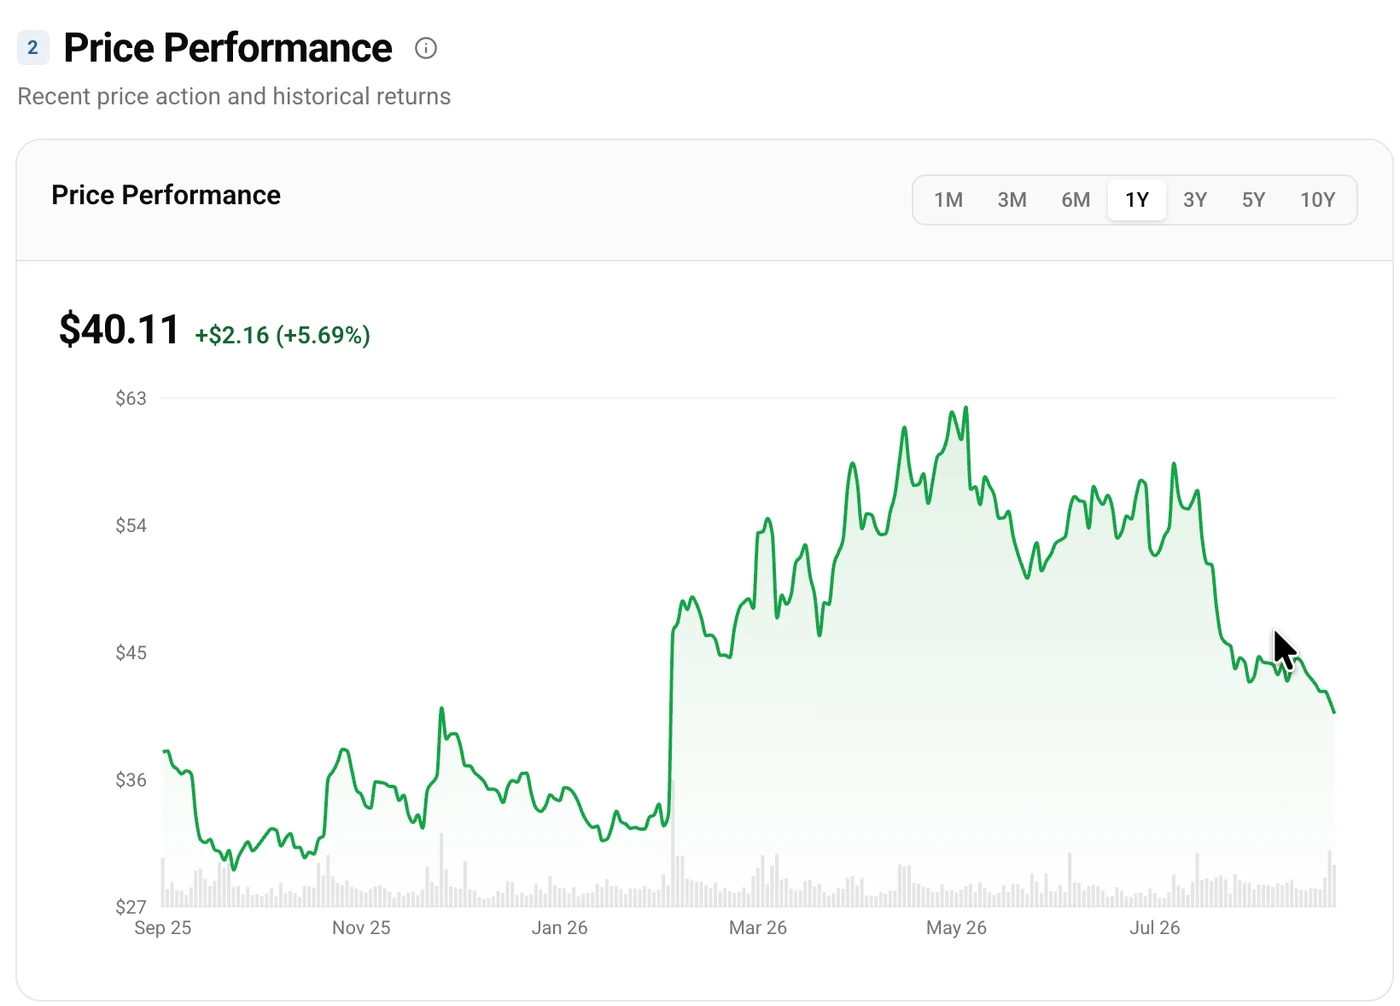 Figure 1. YOU is still up 15.9% for the calendar year, but down 19.9% over three months. The drawdown is recent and it is entirely post-earnings.
This is a useful case precisely because nothing broke. The business that reported on 5 August is the business that exists today. What changed was the price, and what the market decided that business was worth. We ran the 5D Framework across all five dimensions to separate the two.
What CLEAR actually sells
Most readers have walked past a CLEAR lane without knowing there is a listed company behind it.
CLEAR runs a biometric identity platform. Its consumer product, CLEAR Plus, is a subscription that lets members verify who they are with their eyes or fingerprints at a dedicated airport lane and skip the document check at the front of the security queue. It is not TSA PreCheck, which is a government programme that changes how you are screened. CLEAR changes how you are identified, and the two are commonly bought together.
Three things follow from that model, and they explain most of what the financial data shows.
It is a subscription with annual prepayment, so cash arrives long before the revenue is recognised. That produces a large deferred revenue balance, a negative working capital cycle, and cash generation that runs ahead of reported profit.
It is an asset-light network. Adding an airport means pods, staff and an agreement with the airport authority, not a factory. Once a lane is running, incremental members cost very little to serve, which is why gross margin sits above 85%.
And it is increasingly not just airports. CLEAR has been extending the same verified identity into stadiums, healthcare check-in and online age and identity verification for businesses, the last of these sold as CLEAR1. That is the growth story management is asking the market to buy, and it is the part with the least history behind it.
One quirk worth knowing before the numbers: CLEAR is classified under Technology, Software Application, so its peer set in the data below is enterprise software. A consumer subscription for skipping airport queues is an odd fit for that group, and it is worth keeping in mind when the comparisons look flattering.
Dimension 1: Business Quality, 4.01/5.0
The quality score is built on seven fiscal years, 2019 through 2025, and the operating record behind it is genuinely strong.
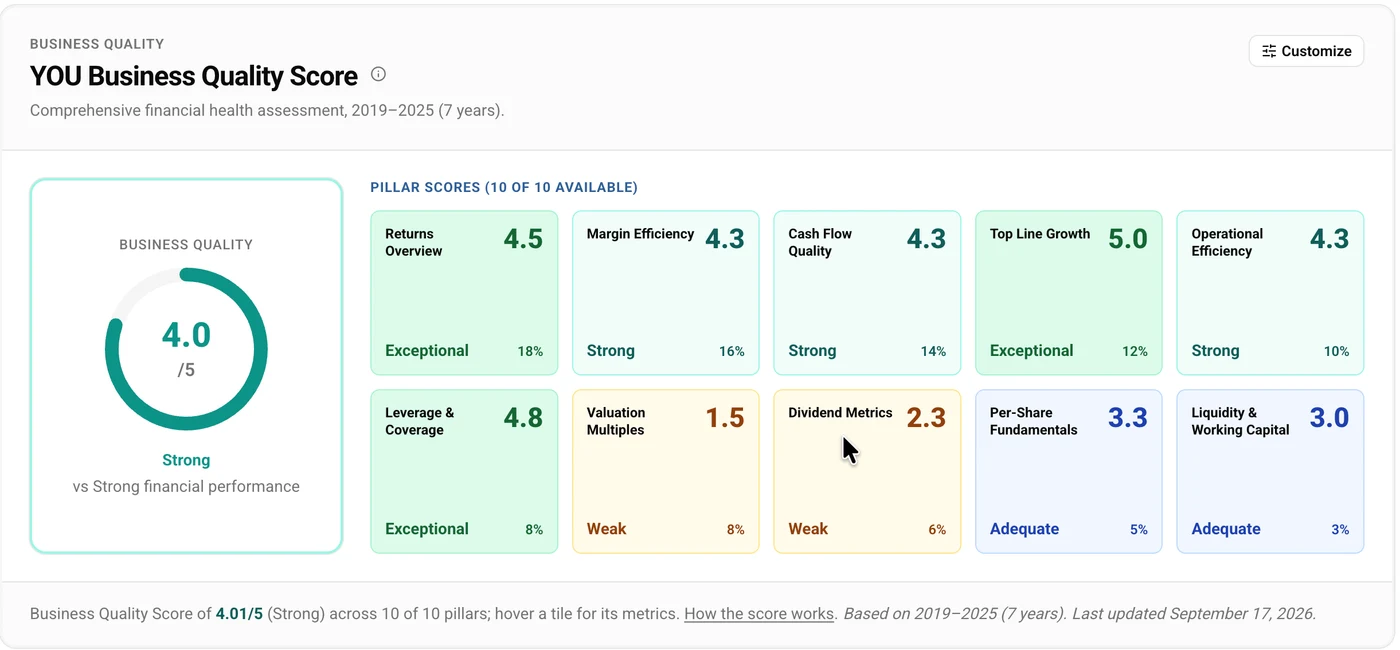 Figure 2. Top Line Growth scores a perfect 5.0 and Leverage and Coverage 4.8. The two weak tiles, Valuation Multiples at 1.5 and Dividend Metrics at 2.3, are the ones to read carefully. Full breakdown on the Quality Analysis page.
Revenue grew at 32.6% a year on the regression measure over that span, from $192 million to $901 million. More striking is what happened to profitability along the way.
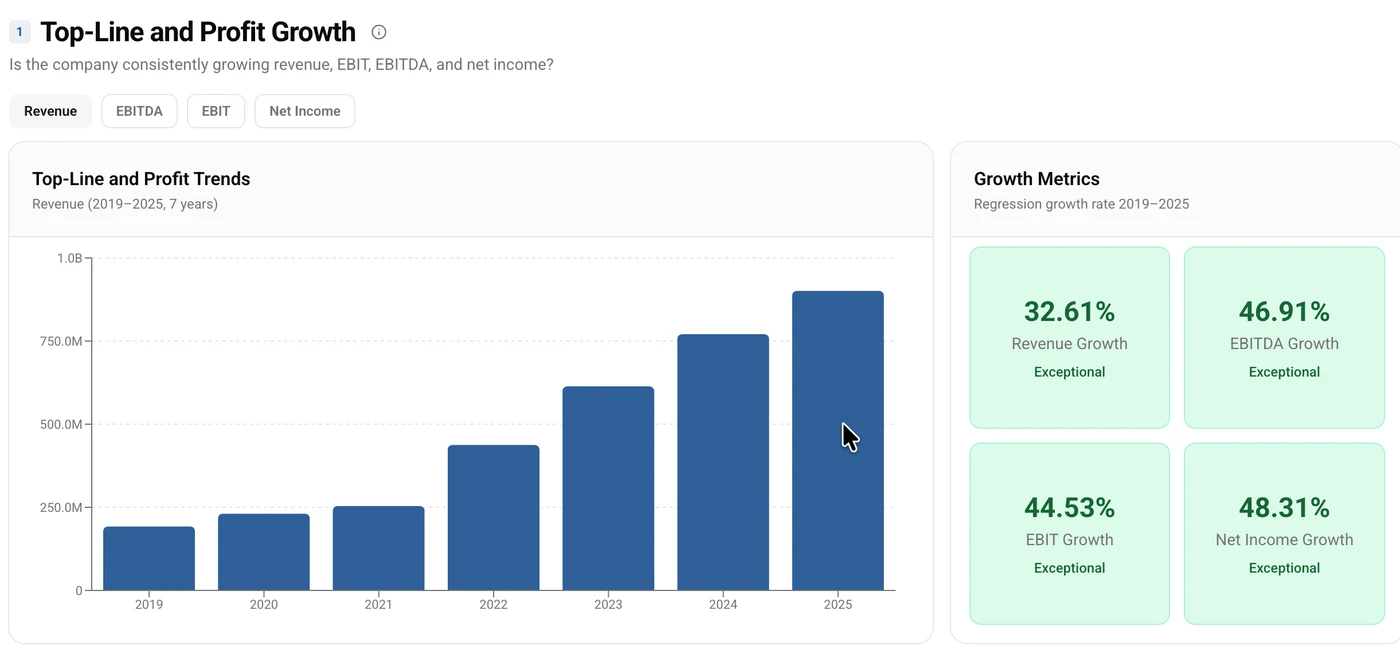 Figure 3. Revenue has never fallen in the period measured, and the growth pillar scores a perfect 5.0.
CLEAR ran an operating loss as recently as 2022, at negative $117 million. By 2025 it earned $206 million of operating profit on an 85.8% gross margin. That is not a company growing into profitability slowly; it is a step change across two years, driven by pricing and by lane economics improving as volume filled the network already built.
Cash followed the same path, only earlier.
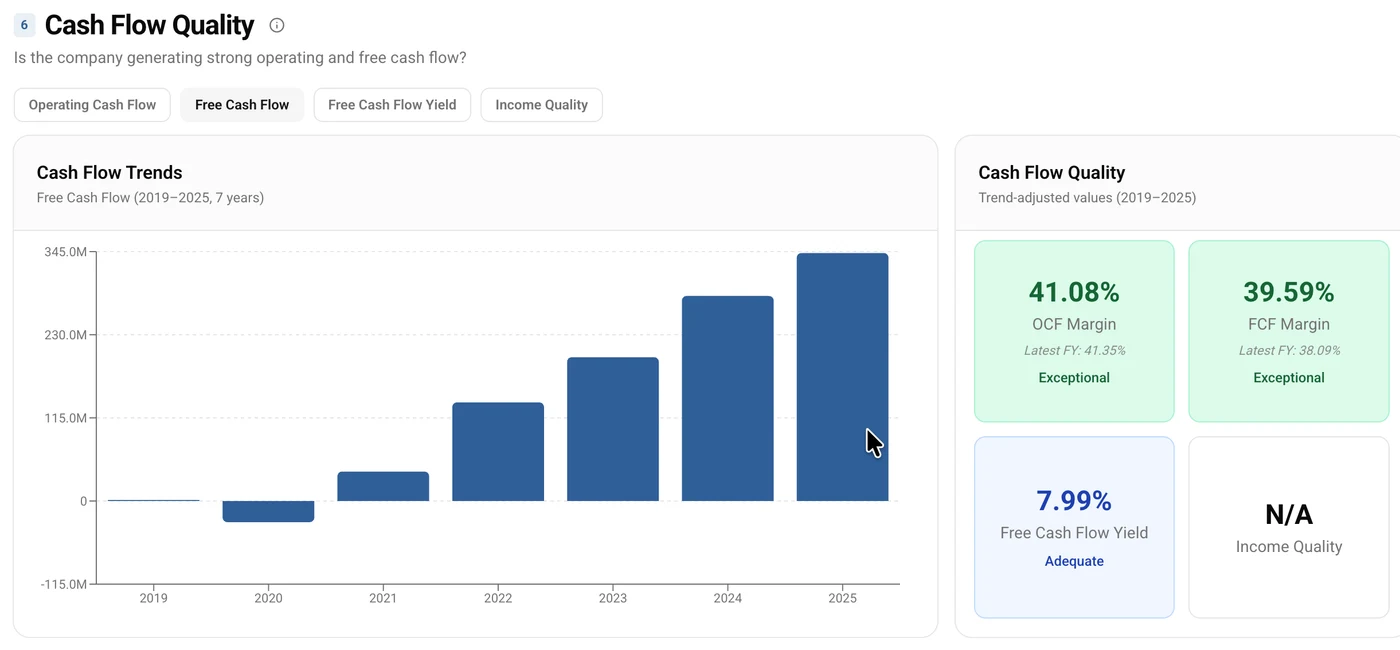 Figure 4. Free cash flow went from $1.4 million in 2019 to $343 million in 2025, and was positive well before operating profit was.
The gap between those two lines is the annual prepayment at work. CLEAR collected subscription cash years before the accounting caught up, which is why the cash flow pillar scores 4.3 and why the current ratio near 1.0 is an artefact of $573 million of deferred revenue sitting as a current liability rather than a sign of strain.
Returns on capital tell the same story from the other end.
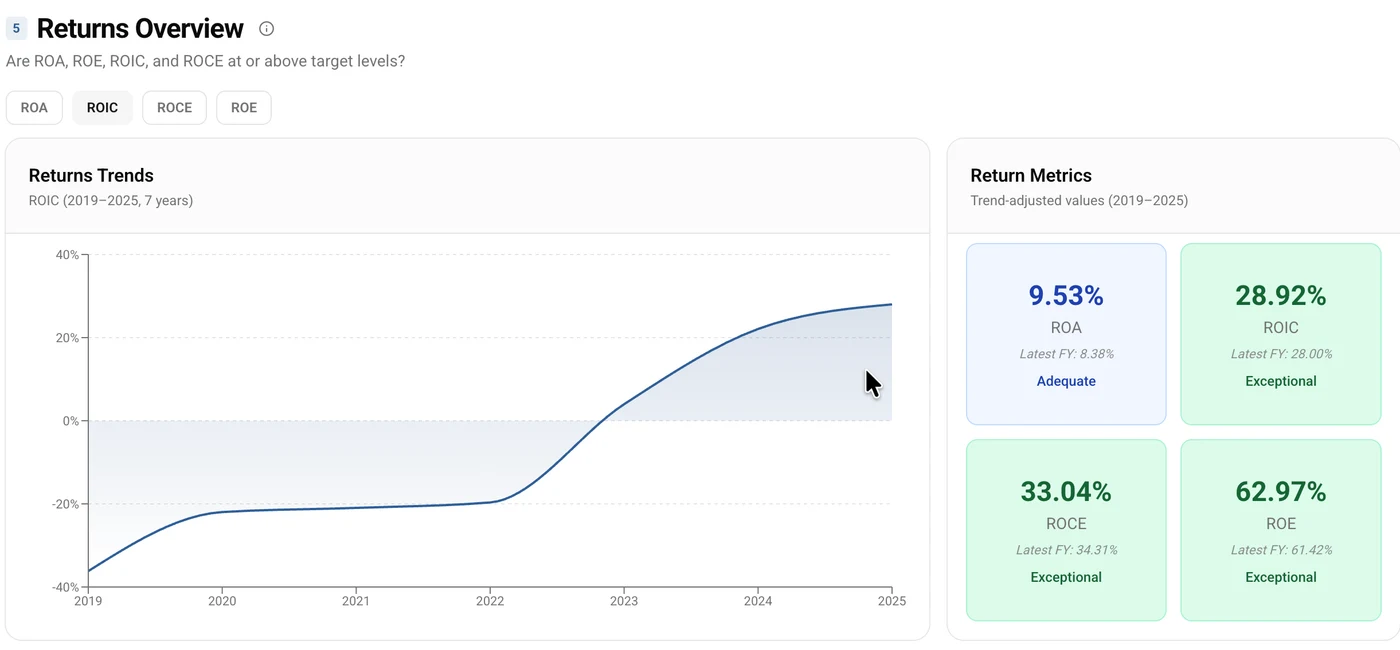 Figure 5. Return on invested capital moved from negative 36% in 2019 to 29% on a trend-adjusted basis, with return on capital employed at 33%.
One caveat on the headline returns. Return on equity reads 63% on the trend-adjusted basis above, and over 80% on trailing twelve month data. Either sounds like a superpower until you look at the denominator. Book value per share went from $6.97 in 2021 to $2.14 in 2025, because CLEAR spent roughly $469 million buying back stock across 2023 to 2025. Shrink equity far enough and any decent profit produces a spectacular ROE. The returns on invested capital above are the honest version, and they are strong on their own terms.
Dimension 2: Peer Comparison, 4.05/5.0 (Sector), 4.00/5.0 (Industry)
Against 138 Technology sector peers and 48 direct Software Application competitors, CLEAR ranks near the top on almost everything operational.
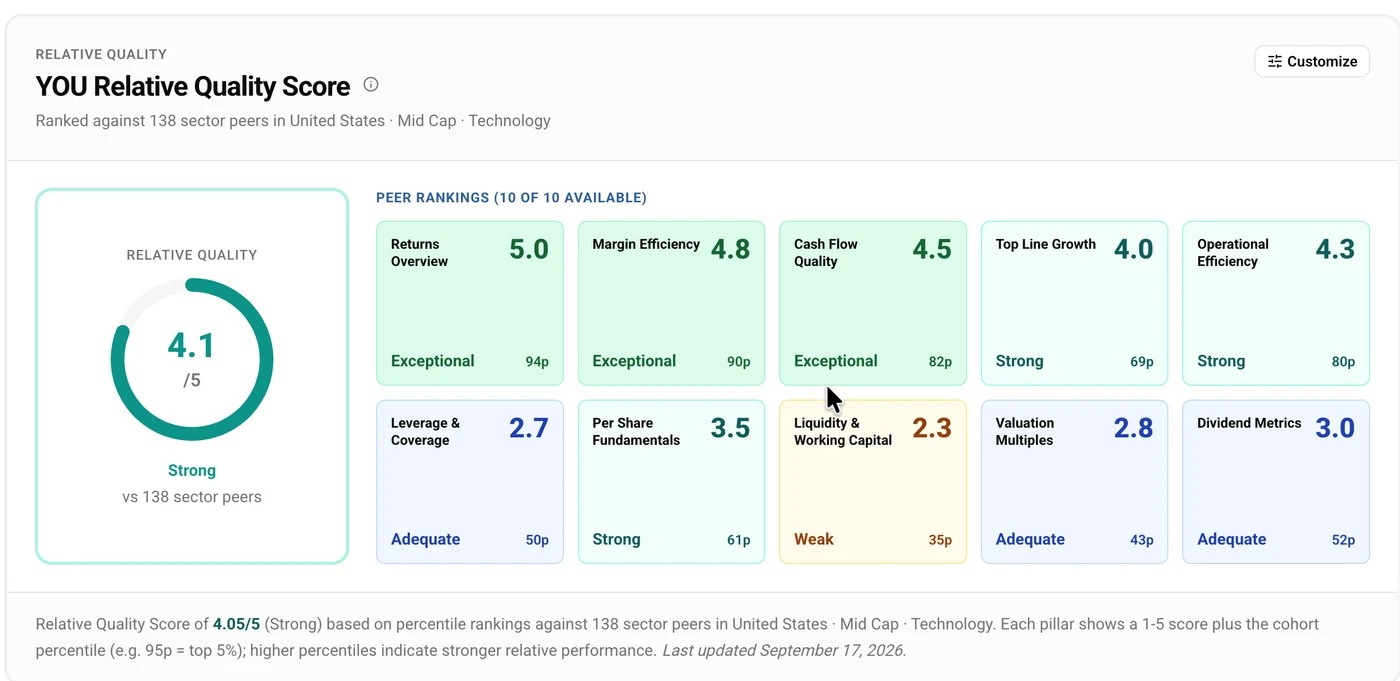 Figure 6. Ten pillars ranked against the peer group. Full breakdown on the Peer Comparison page.
The dot plots are where this gets useful, because they show the whole peer distribution rather than a rank. Each dot is a company; CLEAR is the highlighted one.
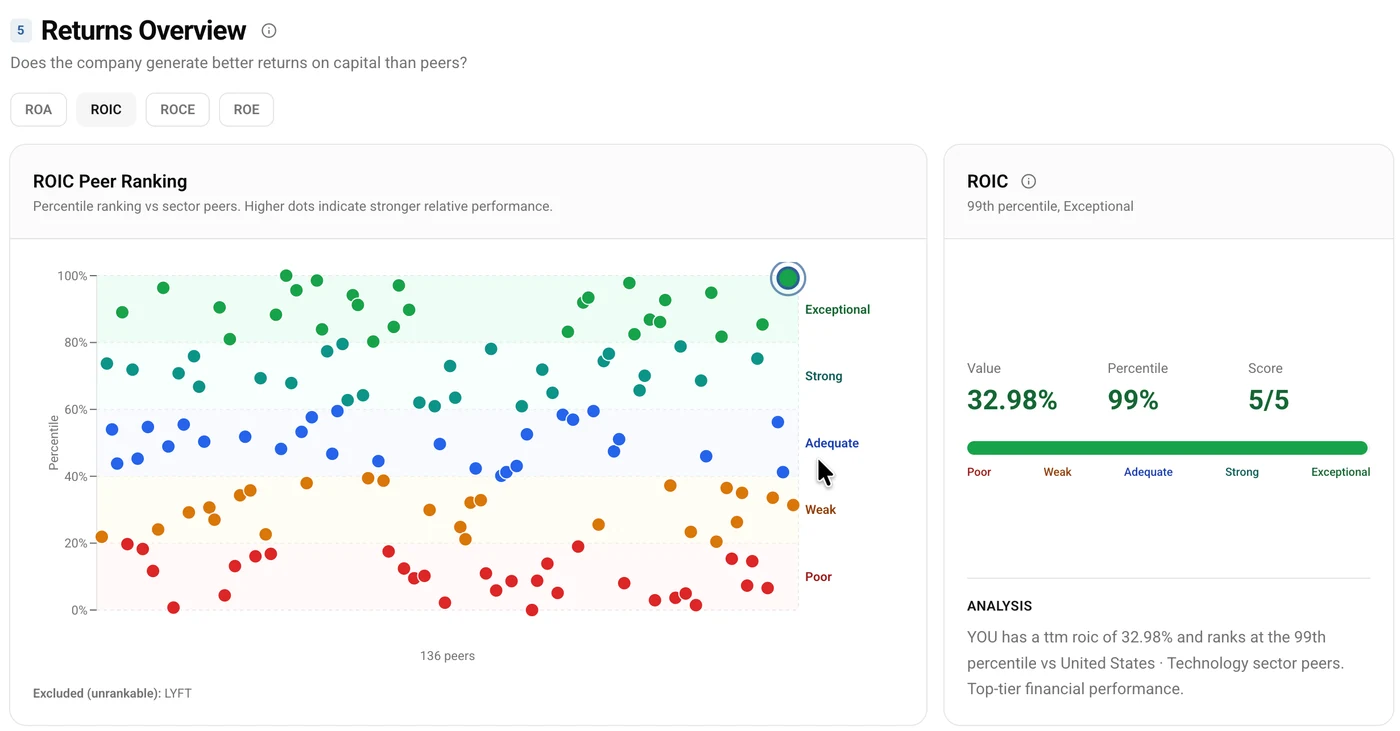 Figure 7. Returns sit at the 94th percentile against the sector. Return on invested capital and return on capital employed both rank above the 97th.
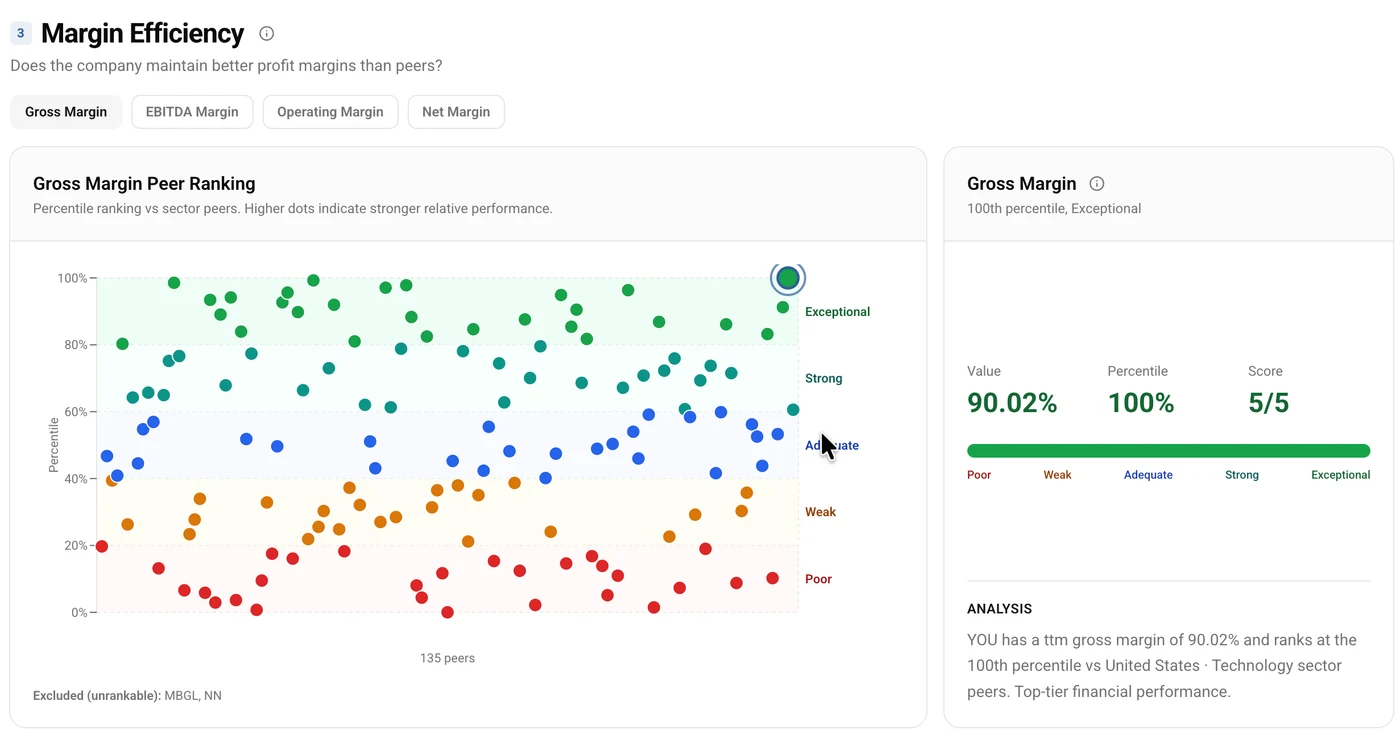 Figure 8. Margin efficiency ranks at the 90th percentile, with gross margin at the very top of a peer group that is itself made of software companies.
That is the flattering half. The growth comparison is where the theme of this piece first appears in the data.
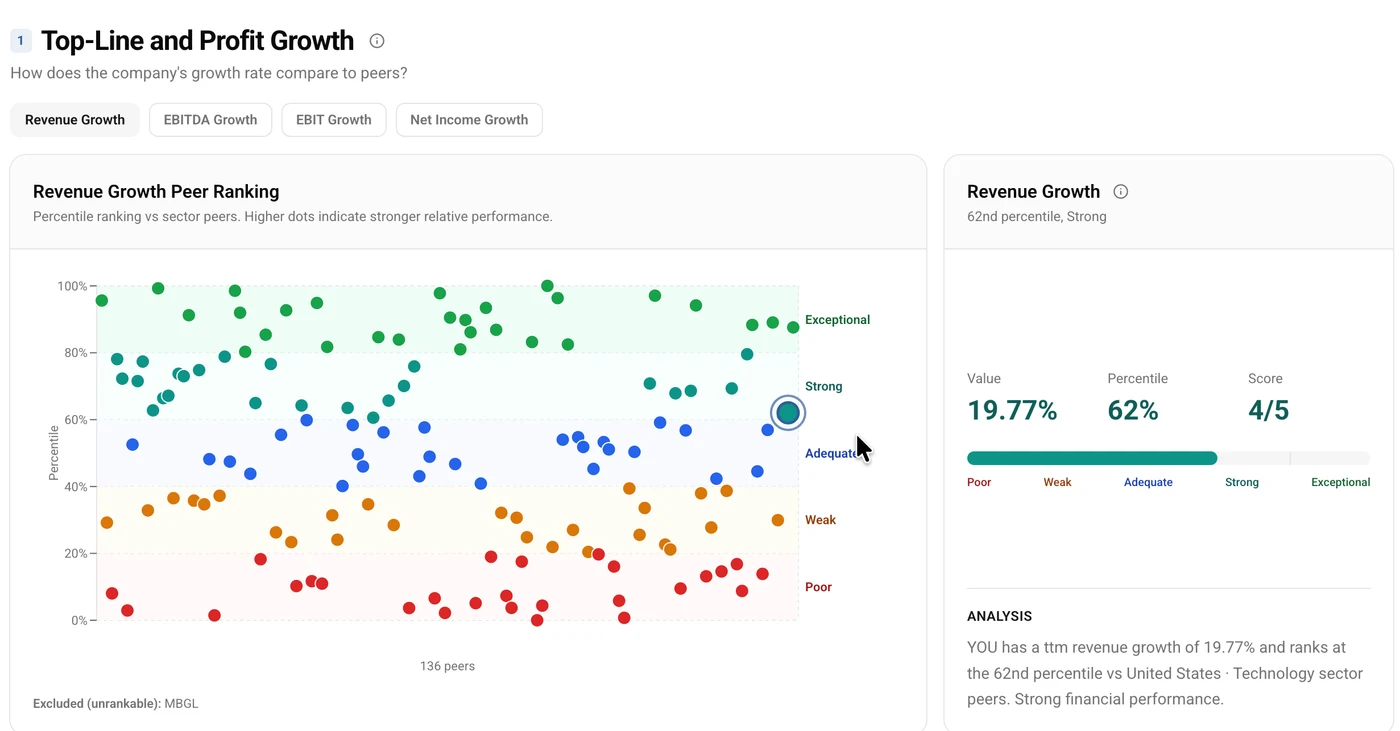 Figure 9. Revenue growth of 19.8% ranks at the 62nd percentile of the sector, and the growth pillar overall at the 69th. Strong, but no longer exceptional in this company.
Two other pillars sit low and both have explanations rather than warnings. Liquidity and working capital ranks at the 35th percentile, which is the deferred revenue effect again. Leverage and coverage ranks at the 50th, which is surprising for a company with almost no debt until you remember the comparison is against software peers who also carry very little.
Dimension 3: Valuation, 5.0/5.0
At $40.11, three independent methods put fair value in the high fifties to low sixties.
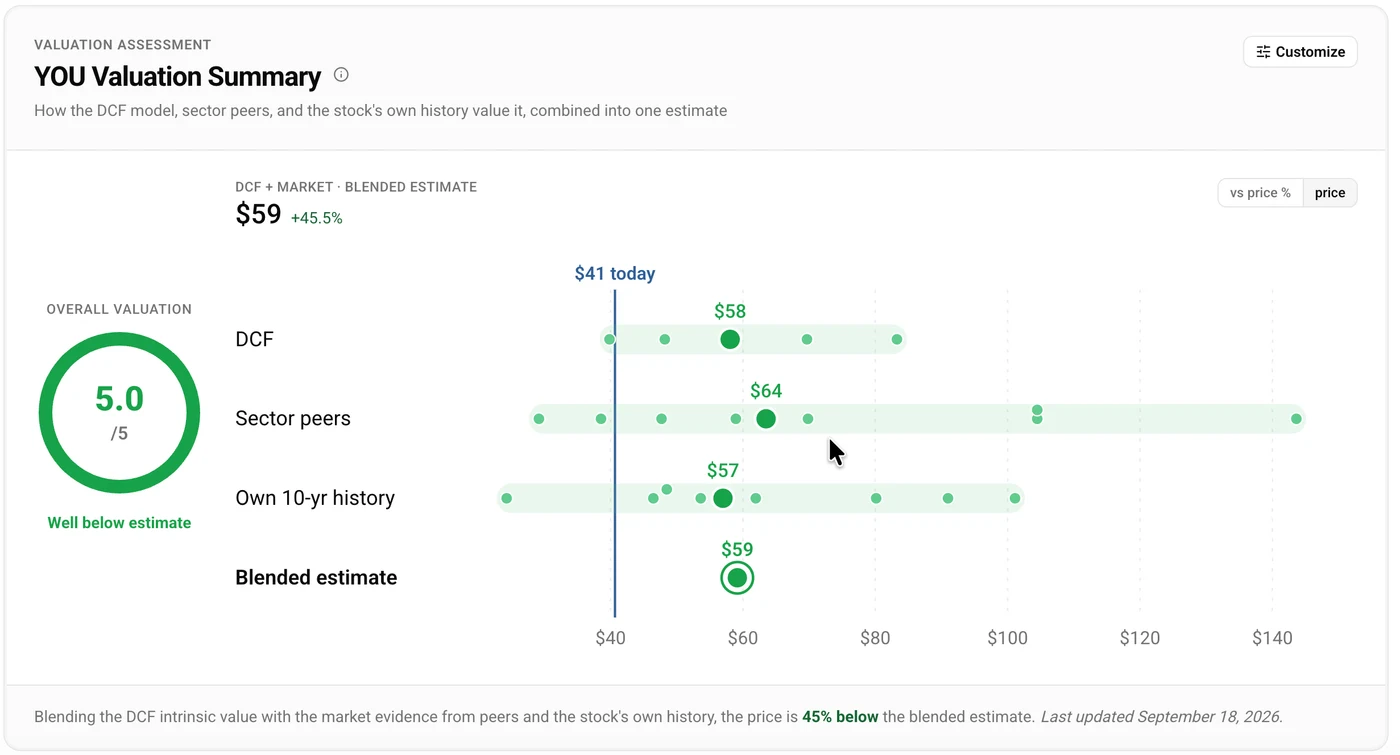 Figure 10. Discounted cash flow at $58, sector peer multiples at $64, CLEAR's own ten year multiple history at $57, blending to $59 against a $41 price. Full detail on the Valuation page.
Agreement like that is worth more than any single number. The cash flow model, the peer comparison and the company's own trading history are built from different inputs and can disagree badly. Here the widest gap between them is seven dollars, and all three sit well above the price.
The cash flow model runs a 16.6% revenue growth rate drawn from analyst estimates, a 9.4% discount rate built from CLEAR's own regression beta and an implied equity risk premium, and 3.7% terminal growth.
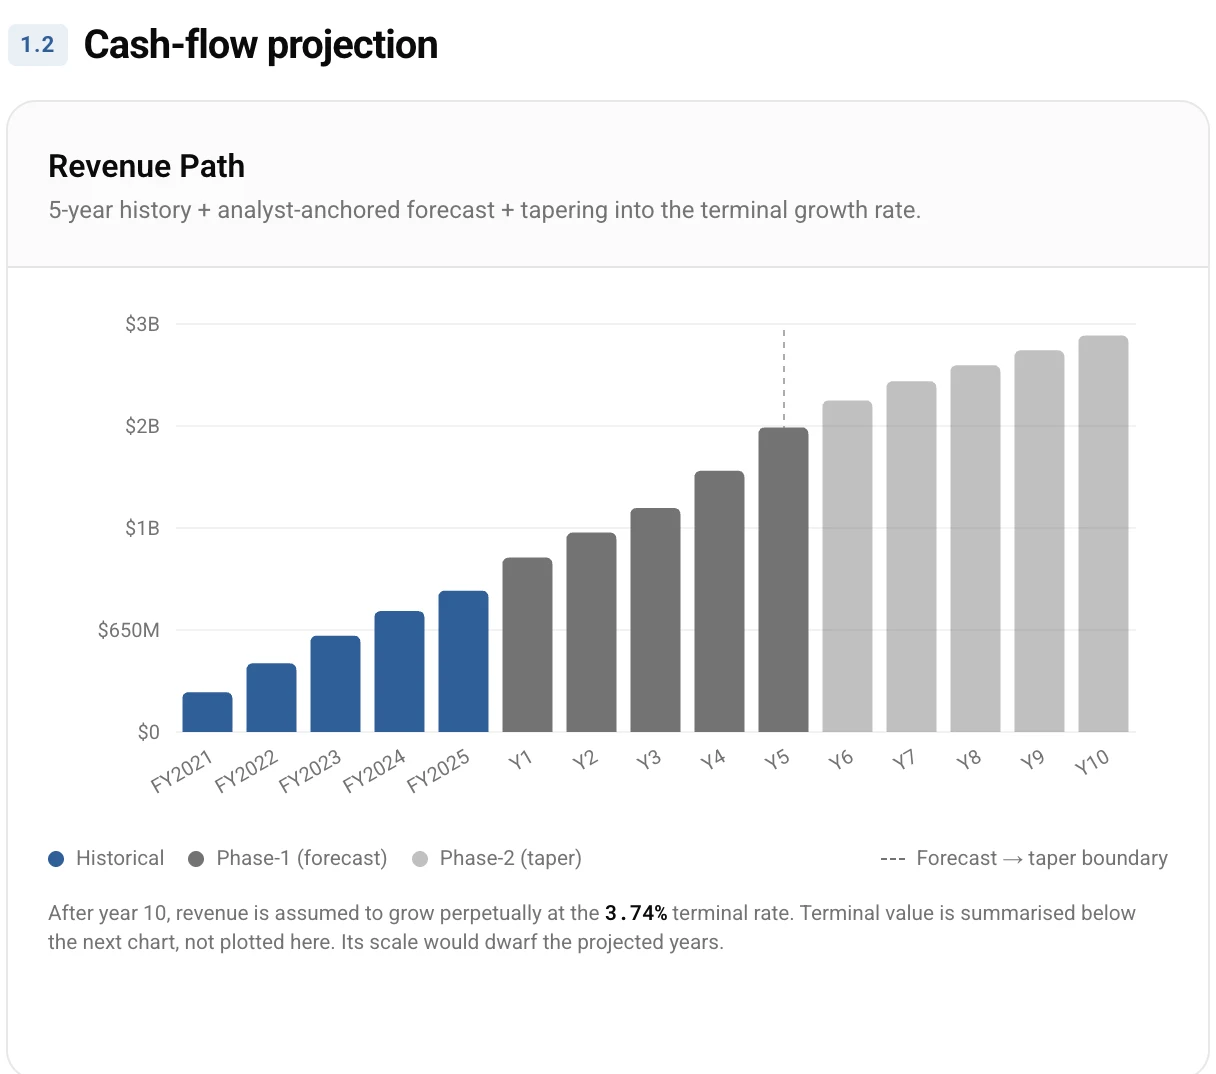 Figure 11. The revenue path the valuation assumes. This is the assumption to argue with, because everything downstream depends on it.
One technical note that matters more than it sounds. CLEAR is an Up-C structure with four share classes, and the units held by pre-IPO members are exchangeable into the listed stock, so the real share count is 135.3 million rather than the 102.9 million Class A alone. Our figures use the full count. Many screeners do not, which makes CLEAR look about a third smaller than it is.
On multiples, CLEAR trades at about 27 times trailing earnings against a Technology sector median near 31. Price to book of roughly 20 ranks at the 6th percentile, which is the buyback effect from Dimension 1 rather than a statement about the business.
Cash flow deserves care. Trailing free cash flow looks extraordinary, but CLEAR has been holding roughly $315 million of an accrued partnership liability owed to its credit card partner, settled in the third quarter of 2026 and certain to make that quarter's free cash flow negative. Management's own full-year guidance, which includes that payment, is at least $480 million. Against a $5.4 billion market value that is a free cash flow yield near 9%. Genuinely good, and a long way from what the trailing figure alone suggests.
Dimension 4: Analyst Sentiment, 3.60/5.0
The headline score is the softest of the five, and the trend charts show why that single number is misleading on its own.
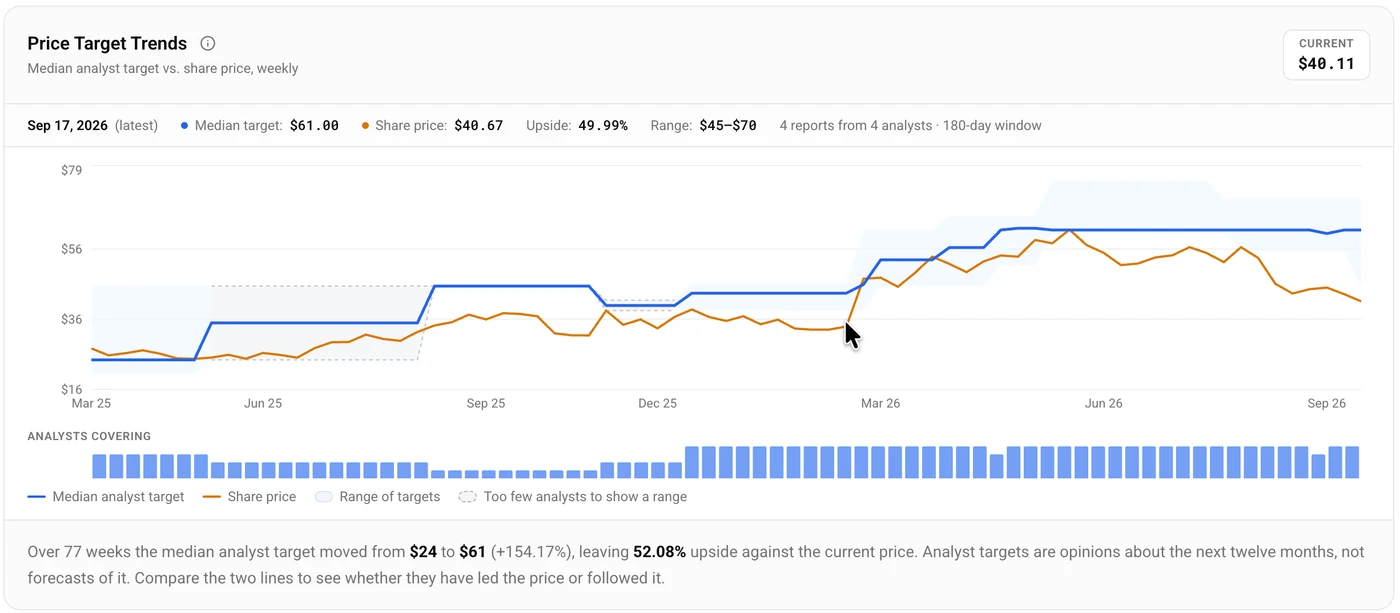 Figure 12. Over 77 weeks the median target moved from $24 to $61. The price caught up to it in June 2026, then fell away.
This is the most informative chart in the piece. Analyst targets led the price for eighteen months, the price finally met them in the June quarter, and then the two separated again as the stock fell while targets held. The current median of $61 leaves about 52% upside against the price, on the Street's own numbers, from four analysts filing in the last 180 days.
Ratings have moved the same way.
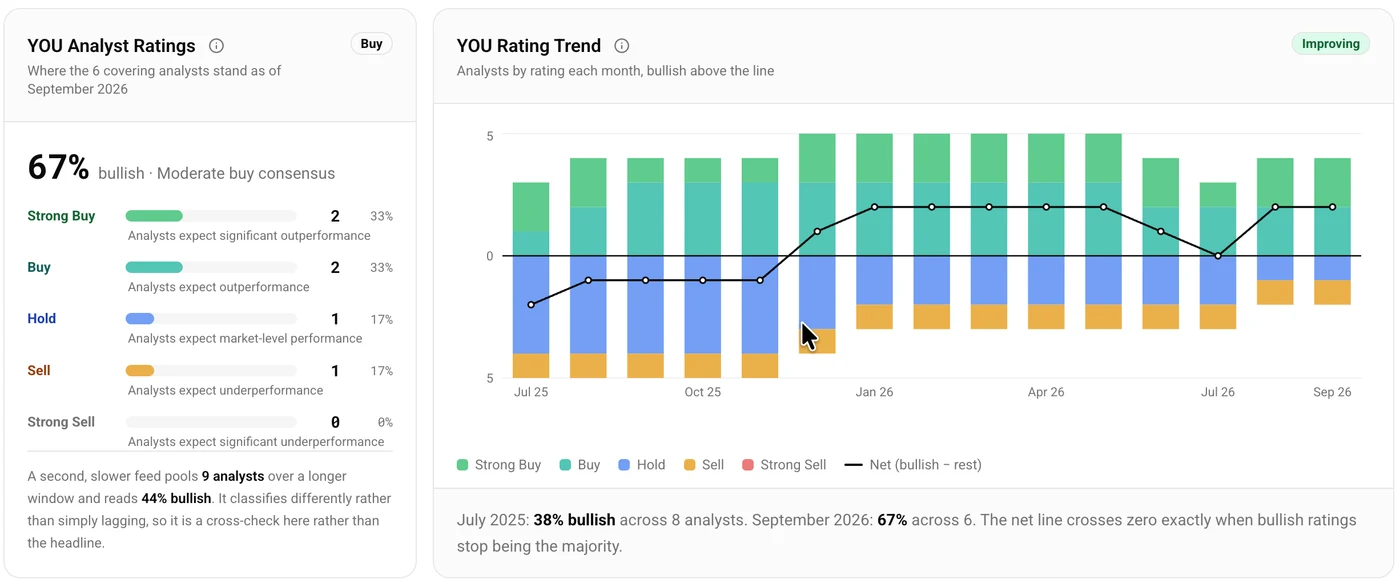 Figure 13. Bullish ratings went from 38% of eight analysts in July 2025 to 67% in September 2026. The trend reads as improving.
So why does the dimension only score 3.60?
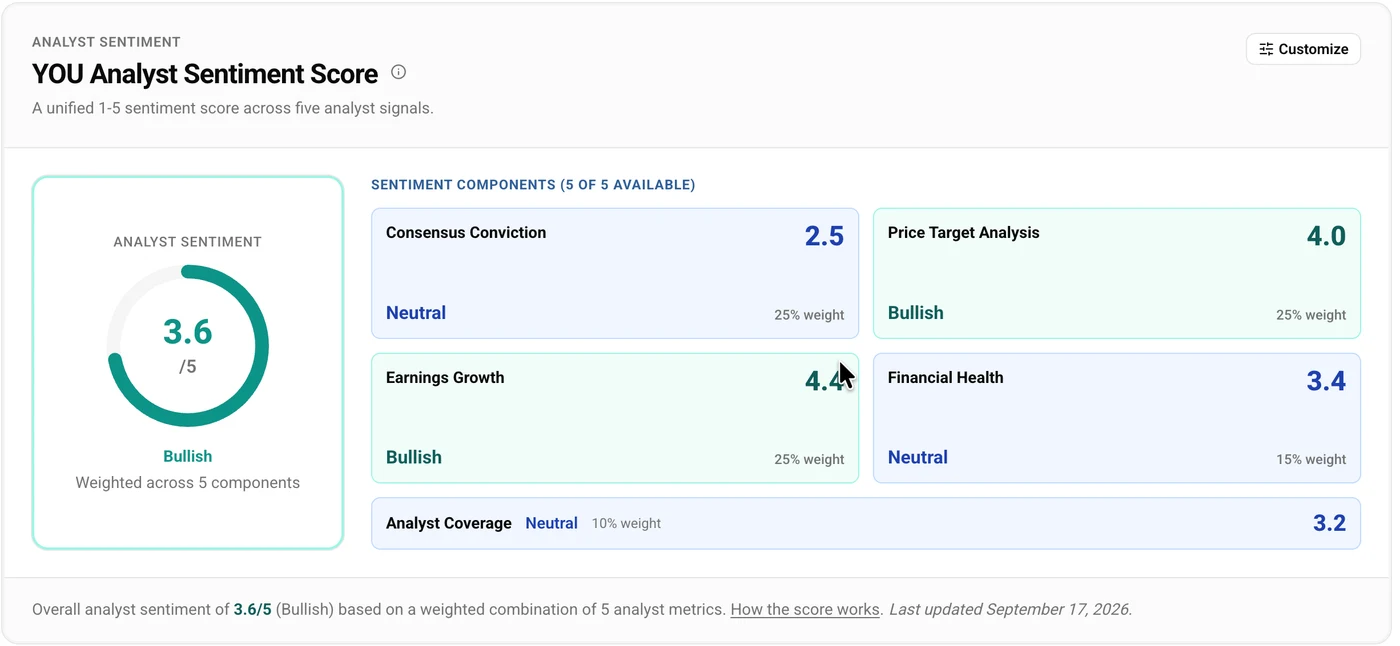 Figure 14. Price targets and forward earnings growth score well; consensus and coverage drag the total down.
The consensus sub-score is 2.5, the lowest single component anywhere in CLEAR's profile. The latest month reads 67% bullish across the six analysts covering, but a second, slower feed pooling nine analysts over a longer window reads 44%, and there is a standing sell rating. Analysts have raised their targets faster than they have raised their conviction, which is a different thing.
Coverage scores 3.2. Across eight forward estimate periods the average number of contributing analysts is four, with as few as two on the longer-dated ones. For a company worth $5.4 billion that is thin, and thin coverage tends to mean wider estimate dispersion and sharper repricings when the picture changes. August is a reasonable illustration.
Dimension 5: Institutional Ownership, 3.70/5.0
Institutions have been net buyers in every quarter the chart covers, and for the last four the rate of adding has been rising.
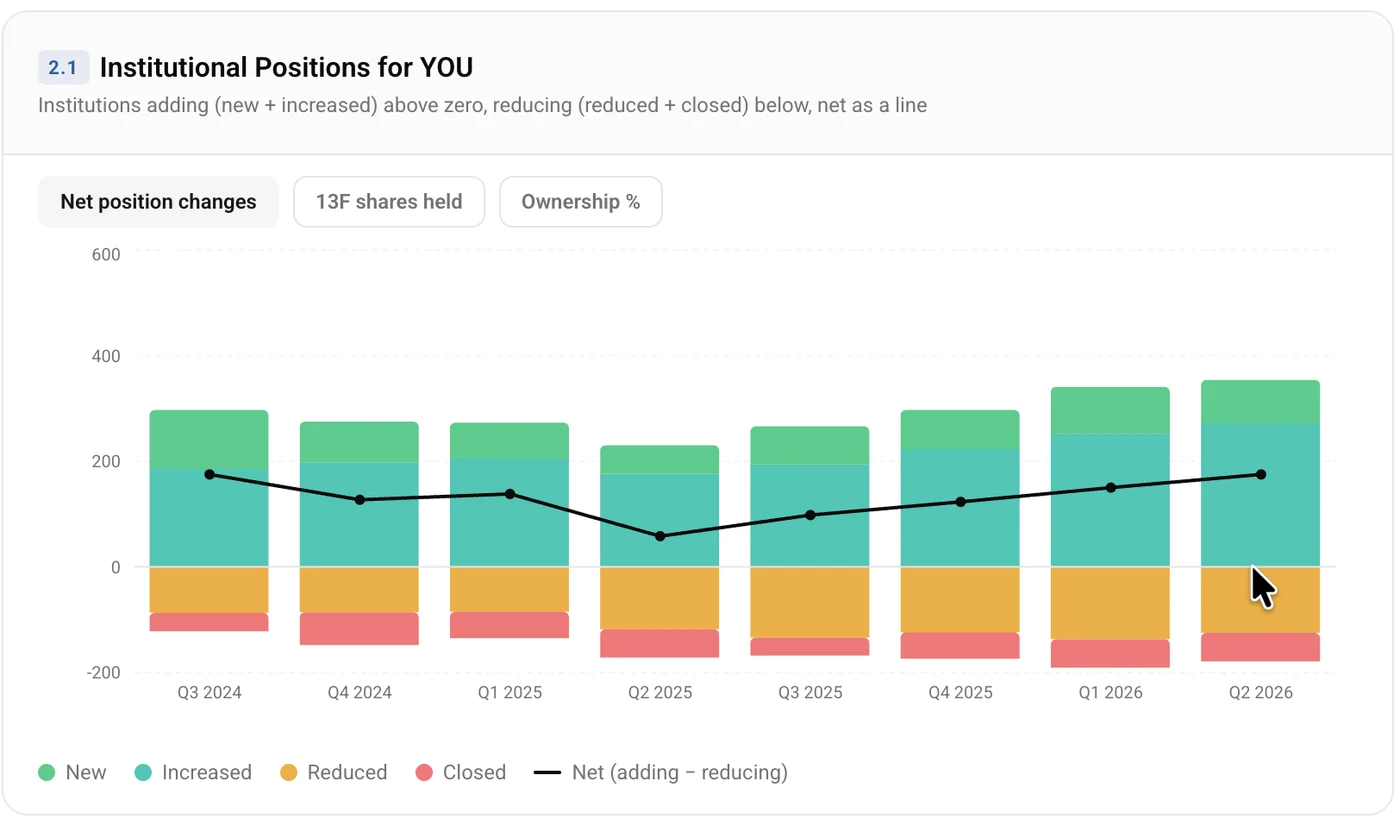 Figure 15. Net adding troughed in the June 2025 quarter and has climbed in each of the four quarters since, reaching its highest level in the June 2026 quarter. Full detail on the Holdings page.
That is 354 funds adding against 179 reducing in the latest filed quarter, and 109 buying against 67 selling among the funds tracked separately. Note the lag: 13F filings describe the June quarter, so this is positioning from before the August fall rather than a response to it.
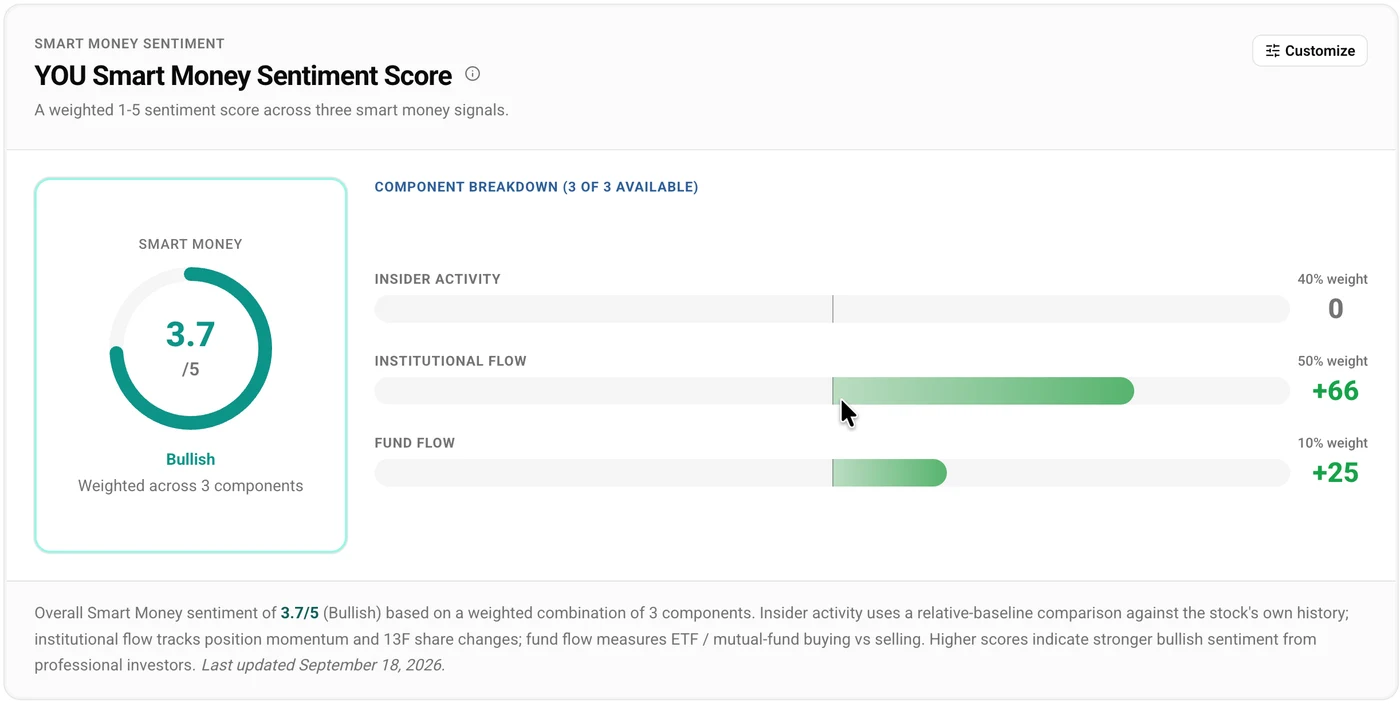 Figure 16. The institutional component carries the score; insider activity reads neutral.
On insiders, the score reads neutral and the detail supports that. Selling in the September quarter ran at about 1.4 times the usual pace and was concentrated in scheduled 10b5-1 plans, which is close to what CLEAR insiders have done in most recent quarters. Executives at a company five years past its IPO selling vested stock on a schedule is ordinary, and reading intent into it would be a mistake.
What the market actually repriced
Nothing in the quarter was bad. The forward guidance was where the argument was.
Third-quarter bookings were guided to $311 to $316 million, growth of 20.5% at the midpoint, against the 32.8% CLEAR had just delivered. That is the first clearly visible step down, and it arrived in the same release as the beat.
The membership picture points the same way. CLEAR reported 43.5 million total members, up 30%, a figure that counts free identity verification users across its consumer and business products. Active CLEAR Plus members, the ones who pay, were 8.3 million, up 15.2%. Those two numbers have been drifting apart, and only one of them carries revenue.
Then there is price. CLEAR raised CLEAR Plus from $209 to $219 in July 2026, and early retention held up, which is a real signal of pricing power. It also means a meaningful slice of next year's growth is already banked, and the year after will need volume rather than price to do the work.
Set those beside a business whose chief executive has acknowledged that the customer experience deteriorated in 2023 and 2024, and where roughly a quarter of the United States airport network is still unbuilt, and you have a company with real runway and real questions about the pace at which it converts.
The question the data leaves open
CLEAR Secure scores 4.0 or better on three of five dimensions, including a 5.0 on valuation. The business is genuinely excellent: 85% gross margins, returns on invested capital near 30%, no meaningful debt, and cash generation that ranks near the top of its sector. None of that was damaged in August.
What the fall did was move the shares from priced for continued acceleration to priced for something slower. Three independent valuation methods now sit between $57 and $64 against a $40.11 price, blending to $59. Analyst targets sit at a $61 median. Those agree closely enough to say the shares are no longer expensive, and sit far enough from the July highs to say the market has genuinely repriced the growth path rather than simply wobbled.
The open question is not whether CLEAR is a good business. The data settles that. It is whether 20% bookings growth, 15% paid member growth and a fresh price increase describe a pause in a company still building out its network, or the shape of the next several years. The framework can tell you what the business earns, how it ranks, what it is worth on stated assumptions, and what the people closest to it are doing. It cannot tell you which of those two stories is true.
That is the part worth doing yourself, which is why we show every component rather than a single verdict. You can work through CLEAR Secure's full profile on its Quality, Peers, Valuation, Analysts and Holdings pages and reach your own conclusion.
Figures as at 18 September 2026. Stockoscope provides research tools and data, not investment advice. Nothing here is a recommendation to buy or sell any security.