
Build Your Own Value Score, Grounded in Graham's Principles
A transparent 100-point value score built on Benjamin Graham's principles, run on the Strategies page with every component weight and filter under your control.

Benjamin Graham's Security Analysis remains the foundational text of value investing nearly a century after its publication. Yet despite the enduring wisdom of buying sound companies priced below their worth, the practical execution has become harder. The modern market presents thousands of potential investments, each requiring deep fundamental analysis that few individual investors can sustain at scale.
That is the problem a quantitative value method solves: it systematises Graham's principles using modern data and applies them the same way to the whole market. But it is not a verdict handed to you. Stockoscope shows a transparent default value score, then lets you set how much each component matters and rebuild it into your own. You decide what "value" means; the ranking recomputes to match.
This article explains the four components behind the score, the traps it is built to avoid, and how you run it yourself on the Strategies page.
What good value looks like, and what is a trap
Value investing is buying a business for less than it is worth and waiting for the gap to close. The hard part is telling a genuine bargain from a value trap, a stock that is cheap because it deserves to be. The method is built around that distinction:
- A margin of safety. Pay meaningfully less than a business is worth, so you are protected if your estimate is wrong. The bigger the discount to a cash-based value estimate, the more cushion.
- Quality first. Cheap plus good beats cheap plus dying. A high return on capital, low debt and steady margins mean the discount reflects mispricing, not decline. That is why quality carries the most weight.
- Cheap on the numbers that matter. Low price relative to earnings, book value, and cash earnings, judged against sensible thresholds rather than the market's mood.
- The cyclical caveat. Miners, banks and consumer-cyclicals look cheapest at the top of their cycle, when trailing earnings peak right before they fall, so standard multiples mislead for those sectors.
The four components: a 100-point value score
The score reads every eligible stock across four components, each contributing to a 100-point result that converts to an intuitive 0-10 scale. The weights below are the disclosed default, not a fixed rule.
- Traditional value metrics (30 points). Graham's core valuation principles: price-to-earnings, price-to-book, and enterprise-value-to-EBITDA on a tier-based scale, where low multiples score high and elevated multiples are penalised.
- DCF margin of safety (20 points). Price is what you pay; value is what you get. This component focuses on the margin of safety rather than a single precise intrinsic value: a wide discount to the discounted-cash-flow estimate earns maximum points, smaller discounts proportionally less.
- Quality (35 points). The heaviest component, reflecting that durable advantages justify a price over time. It reads return on equity and return on invested capital, liquidity, leverage, interest coverage, and net margins. This is what separates a cheap, sound business from a cheap, deteriorating one.
- Growth (15 points). Sustainable expansion, not growth at any price. Multi-year revenue growth, so a cheap business is not a stagnant one.
Quality is weighted highest on purpose: it is the anti-trap factor that keeps structurally declining businesses out of a "cheap" list.
The screens that come first
Before scoring, the method applies hard screens so it only ranks companies that clear a fundamental floor: positive return on equity and net profit margin (which removes most value traps), a sound balance sheet, and a sensible price-to-earnings ceiling. Financials and real estate use specialised valuation methods, so they sit outside this particular lens. These screens are part of the method, and like the weights they are visible rather than hidden.
Build it yourself on the Strategies page
This is what makes the score yours. On the Value tab, the method runs live over the whole universe and you drive it with three sets of controls.
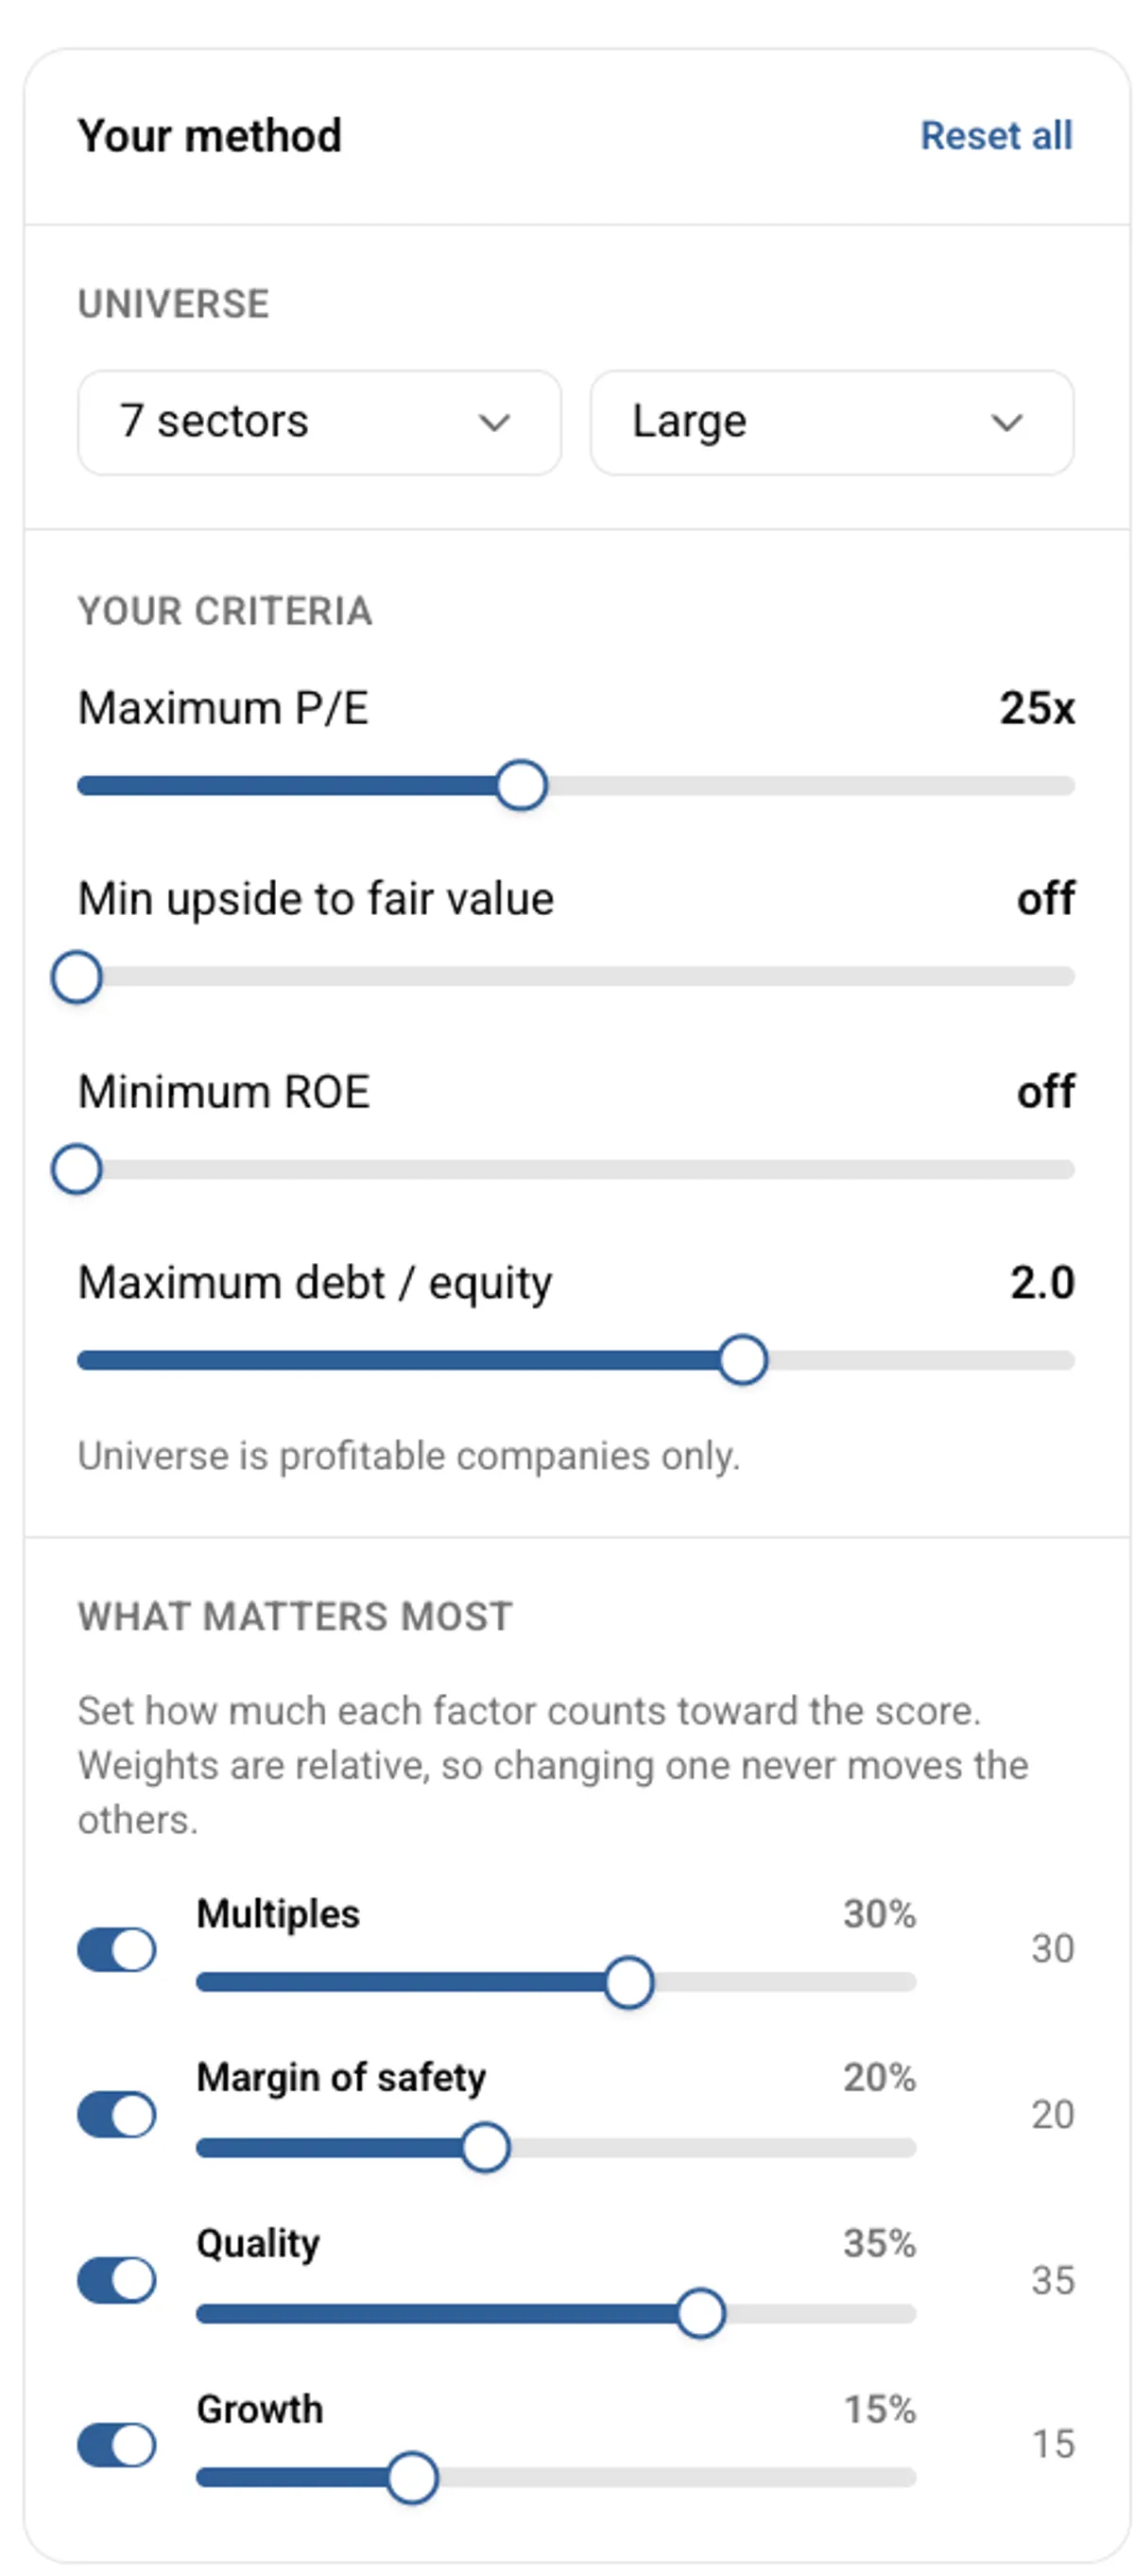
Figure 1: The Value tab's control panel. Set the universe, move the filters that decide what qualifies (maximum P/E, minimum upside, minimum ROE, maximum debt), and weight the four scoring factors. The list re-ranks live as you move a lever.
- Universe. Pick the sectors and company sizes to rank.
- Filters (what qualifies). Move plain-English levers: the maximum P/E you will accept, the minimum upside to the model estimate, a minimum return on equity, a debt ceiling. These decide which companies make the list.
- Factor weights (what counts most). Lean harder on cheap multiples, dial up the margin of safety, or weight quality even more to be stricter on traps. The weights are relative, so changing one never moves the others.
The defaults are our starting point, not a recommendation. Every component, weight, filter, and assumption is on the page; the platform states the relationships and shows the maths.
Read the live ranking
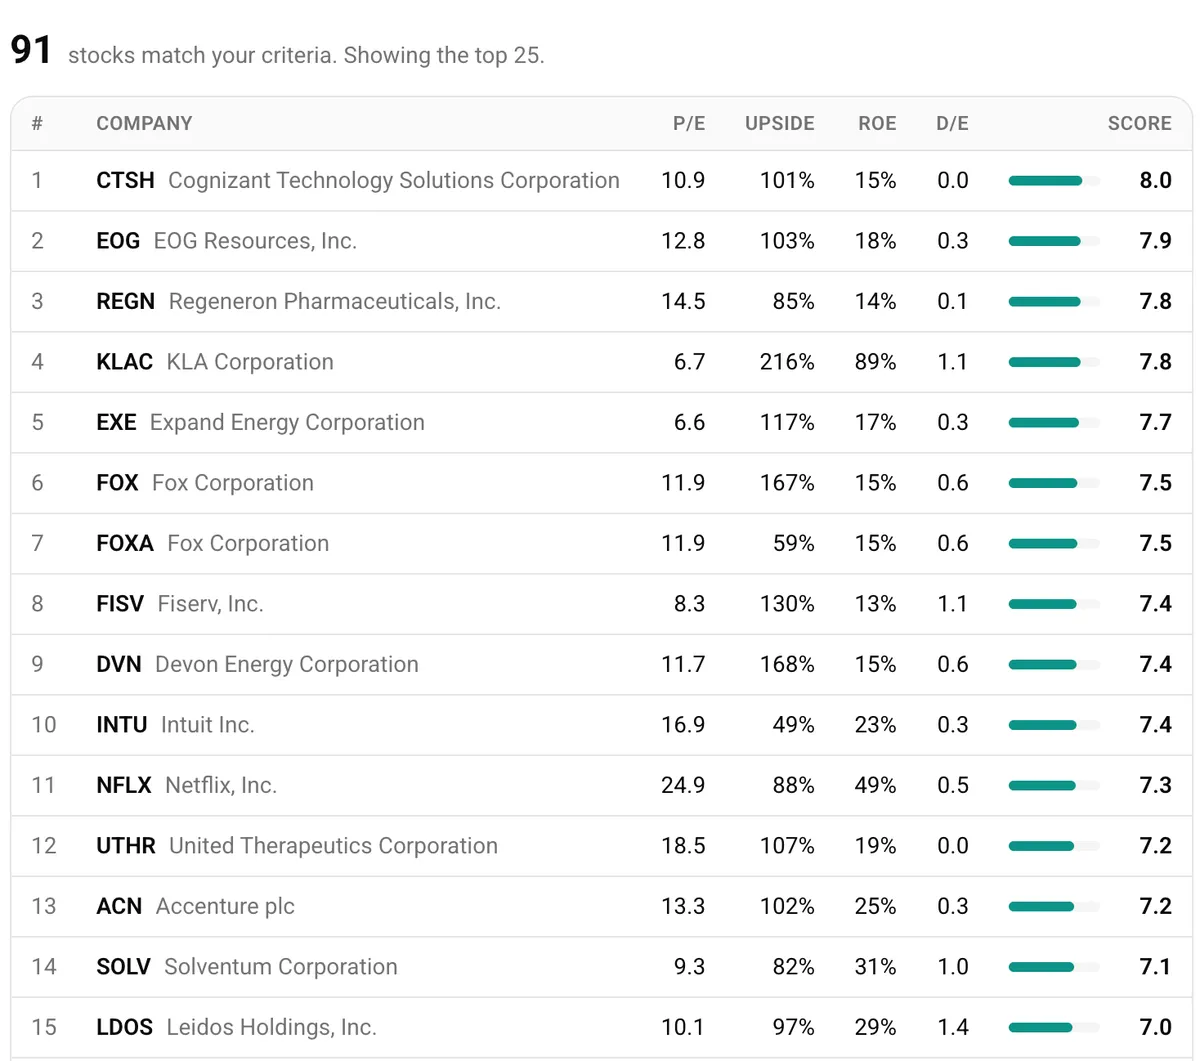
Figure 2: The live ranking. Every company that clears your filters, scored on the weighting you chose and shown alongside its key value metrics - a shortlist for your own research, not a buy list.
The table is the output of your method. It ranks the companies that pass your filters by the value definition you built, and each one links through to its full valuation breakdown. On any individual stock, the DCF that feeds the margin-of-safety component is itself adjustable: edit the growth, terminal rate, and discount-rate assumptions on its Valuation page and watch the intrinsic-value estimate move. The inputs are not a black box.
Strengths and limits
Strengths:
- It removes common biases: anchoring on recent performance, overweighting familiar names, letting sentiment override the numbers.
- It reads thousands of companies with the same criteria, surfacing candidates manual analysis would miss for lack of time or coverage.
- The profitability screen and heavy quality weighting help avoid the value traps that catch purely mechanical "cheap" strategies.
- The margin of safety is an objective, model-based measure rather than a subjective cheap-or-expensive call.
Limits:
- A value score flags where the model estimates a price below intrinsic value; it does not predict when, or whether, the market closes that gap. Patient capital is essential.
- Leaving out financials and real estate means those sectors sit outside this lens.
- It reads historical fundamentals, which may not reflect a future business-model change or industry disruption.
- It can miss qualitative factors (management, moat durability, regulatory risk) that a human analyst might catch, which is why the output is a shortlist for your own research, not a recommendation.
Putting it to work
This value score is an evolution of Graham's principles, not a replacement for judgement. The core insight, that markets periodically misprice sound businesses, is unchanged. What is new is that you can inspect the measure, disagree with it, and reweight it to match how you invest.
Open the Value tab on the Strategies page and set the filters and component weights, or adjust the DCF assumptions on any stock's Valuation page and see the margin of safety move. Either way the principle holds: a transparent, configurable measure beats a subjective cheap-or-expensive guess, precisely because you can see what is in it and make it your own.
This article is for informational and educational purposes only and should not be construed as investment advice. Any companies referenced are examples used to illustrate the scoring and do not constitute recommendations to buy or sell securities. Past performance does not guarantee future results. All investments carry risk of loss, including potential loss of principal. Investors should conduct their own research and consider their financial situation and risk tolerance before making investment decisions.