
Pricing the AI Arms Race: META's Valuation at $623
Meta Platforms is investing tens of billions in AI infrastructure while growing revenue at 22%. We conduct a full DCF and multiples valuation to estimate where $623 sits relative to intrinsic value.
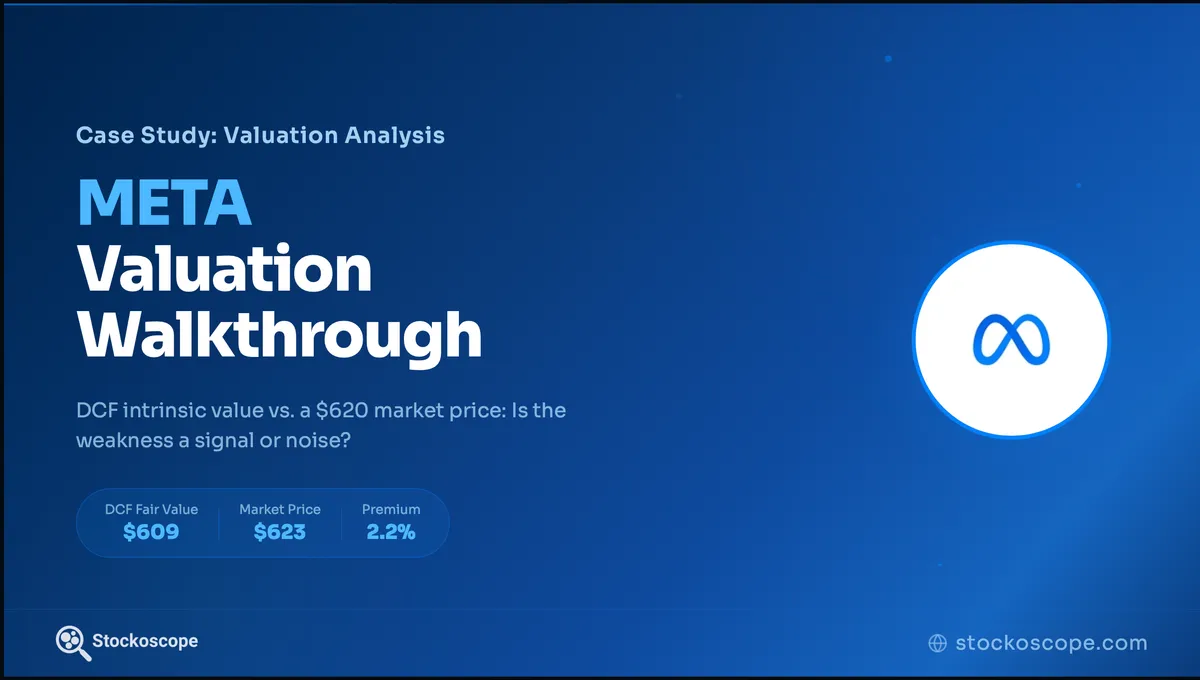
Meta Platforms (META) presents one of the most interesting valuation puzzles in today's market. The company is growing revenue at 22%+ while spending aggressively on AI infrastructure, posting $201 billion in fiscal 2025 revenue with a $1.57 trillion market cap. The stock trades around $623 per share.
The central tension is between extraordinary near-term growth and massive capital expenditure. Meta's AI investments currently consume roughly 35% of revenue in capital expenditure, temporarily suppressing free cash flow even as the top line accelerates. Analysts project this intensity to normalize toward 24% as the infrastructure buildout matures, a critical assumption for valuation. Is the market pricing this tension correctly? A rigorous DCF analysis can help answer that question.
Growth Analysis
Our DCF engine uses an analyst-consensus-first approach. For Meta, the coverage is exceptional: 46 analysts cover the current year, with 16-44 analysts providing estimates across five forward years. This produces a confidence score of 0.94.
The model calculates the compound annual growth rate implied by consensus revenue estimates from the last reported fiscal year ($201.0 billion) through the furthest forward estimate ($455.7 billion in fiscal 2030). The result: a 22.7% annual growth rate.
This is a remarkable rate for a company of Meta's scale. It reflects analysts' collective view that AI monetization through advertising optimization, Reels engagement, and the Llama ecosystem will drive sustained revenue acceleration. Whether this rate is achievable is the central question any investor must grapple with.
The growth rate feeds into a two-phase projection. Phase 1 (Years 1-5) applies the 22.7% rate, projecting revenue from $246.6 billion to $559.2 billion. Phase 2 (Years 6-10) uses exponential tapering, smoothly decaying growth from 10.8% to 3.2%, approaching the 3.0% terminal rate. This transition reflects the reality that even dominant platforms eventually face market saturation and competitive constraints.
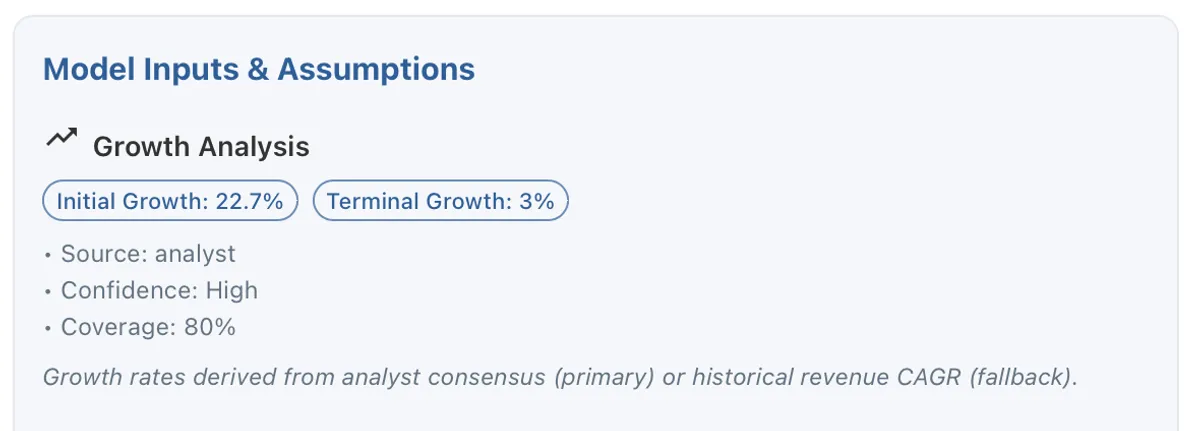
Figure 1. Growth analysis: 22.7% revenue CAGR derived from analyst consensus across 16-46 analysts, with 0.94 confidence score reflecting deep Wall Street coverage.
WACC Calculation
The discount rate uses company-specific market data from Financial Modeling Prep (FMP), ensuring every component reflects current market conditions and Meta's actual risk profile.
Cost of Equity (9.83%): Built from the Capital Asset Pricing Model: a 3.79% risk-free rate, 4.72% equity risk premium, and Meta's company-specific beta of 1.279. This beta captures META's higher-than-market volatility, reflecting both the growth premium and the uncertainty around AI investment returns.
Cost of Debt (2.67% after-tax): Meta's pre-tax borrowing cost of 3.79% adjusted for a 29.6% effective tax rate. While Meta was historically debt-free, the company has taken on $83.9 billion in debt, partly to fund its AI infrastructure buildout and share repurchase program.
Capital Structure: FMP provides market-value-based weights: 95.0% equity and 5.0% debt. Despite the recent debt issuance, Meta remains overwhelmingly equity-financed.
Final WACC: 9.47%. The weighted blend reflects Meta's growth-company risk profile with minimal leverage impact.
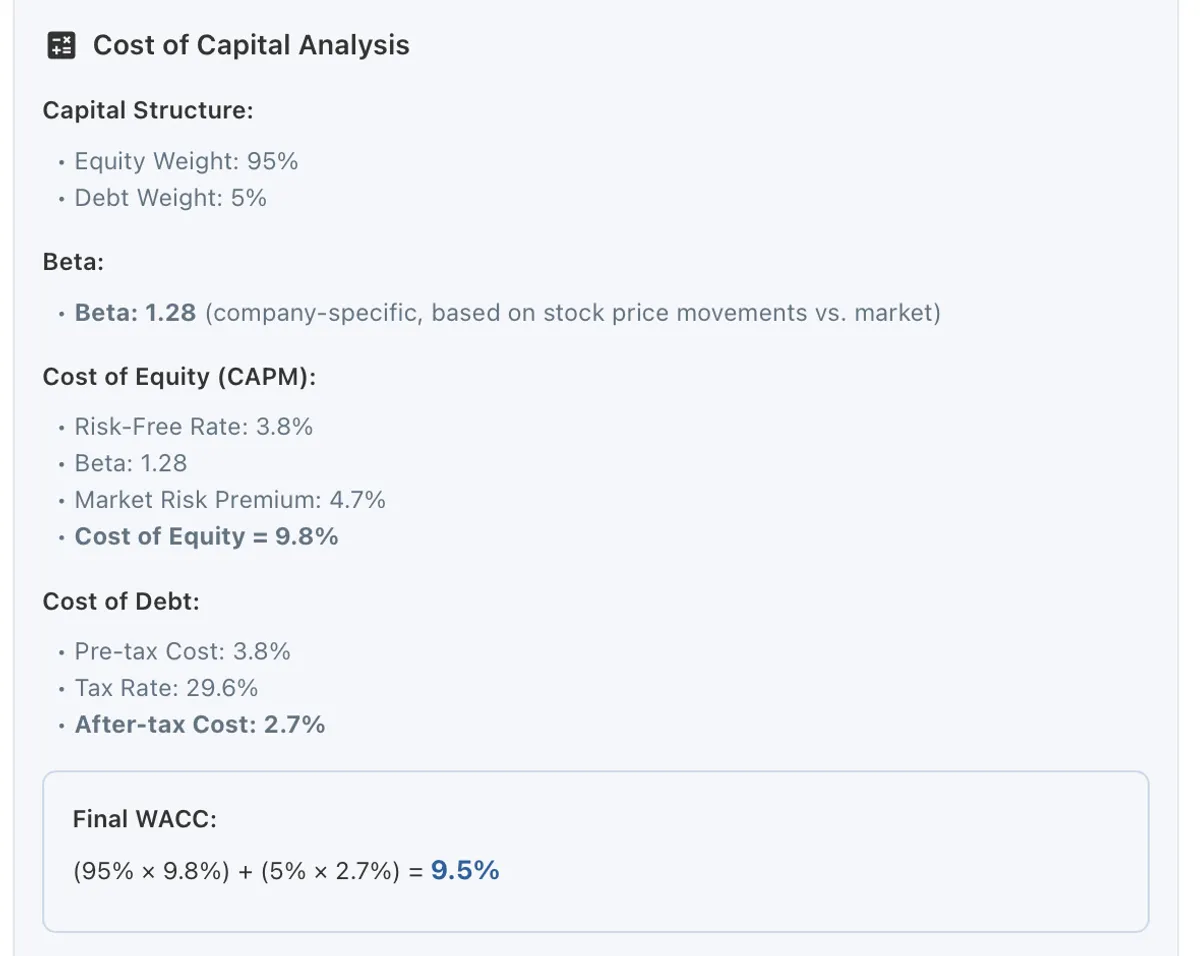
Figure 2. WACC calculation: 9.47% discount rate from FMP market data: beta of 1.279, current risk-free rate and equity risk premium, with 95/5 equity-debt capital structure.
Operational Assumptions
The model uses a 45.6% EBITDA margin, reflecting Meta's demonstrated operational efficiency. This is a company that has expanded margins significantly through disciplined cost management while simultaneously investing billions in AI infrastructure. The margin is based on actual performance, not aspirational targets.
The terminal growth rate is 3.0%, sourced from FMP's long-term growth estimate for the company and capped at our 3% ceiling to ensure conservative terminal value assumptions.
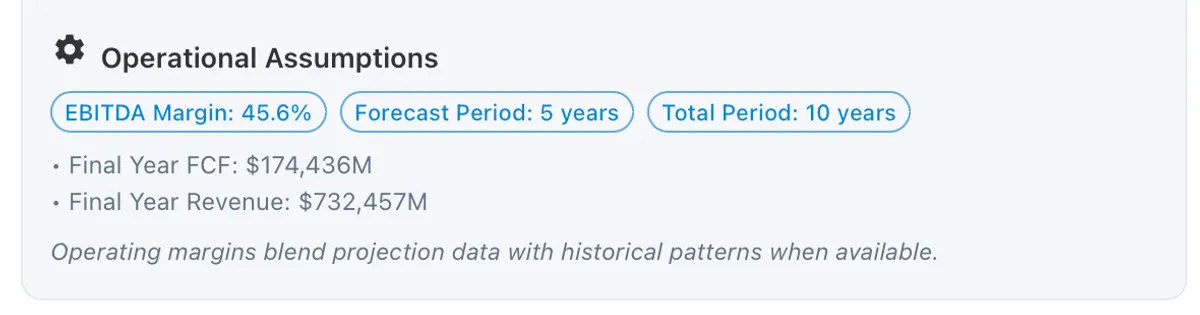
Figure 3. Operational assumptions: 45.6% EBITDA margin from demonstrated profitability, 5-year initial forecast period tapering to 10 years total, 3.0% terminal growth.
Cash Flow Projections
The projections reveal a distinctive pattern that is central to understanding Meta's valuation.
During Phase 1 (Years 1-5), revenue grows at 22.7% annually, expanding from $246.6 billion to $559.2 billion. But free cash flow grows more slowly, from $22.6 billion to $51.2 billion. The gap between revenue growth and FCF growth reflects Meta's massive capital expenditure program, with CapEx currently consuming roughly 35% of revenue for AI infrastructure, data centers, and compute capacity.
The inflection comes in Phase 2 (Years 6-10). As revenue growth tapers from 10.8% to 3.2%, capital expenditure intensity normalizes. Free cash flow jumps from $51.2 billion in Year 5 to $111.7 billion in Year 6, eventually reaching $174.4 billion by Year 10. This dramatic expansion reflects the operating leverage inherent in Meta's model: once AI infrastructure is built, incremental revenue requires far less incremental investment.
This CapEx normalization is the key assumption driving valuation. If Meta's AI spending remains elevated beyond the forecast period, or if the investments fail to generate returns, the free cash flow trajectory would look very different.
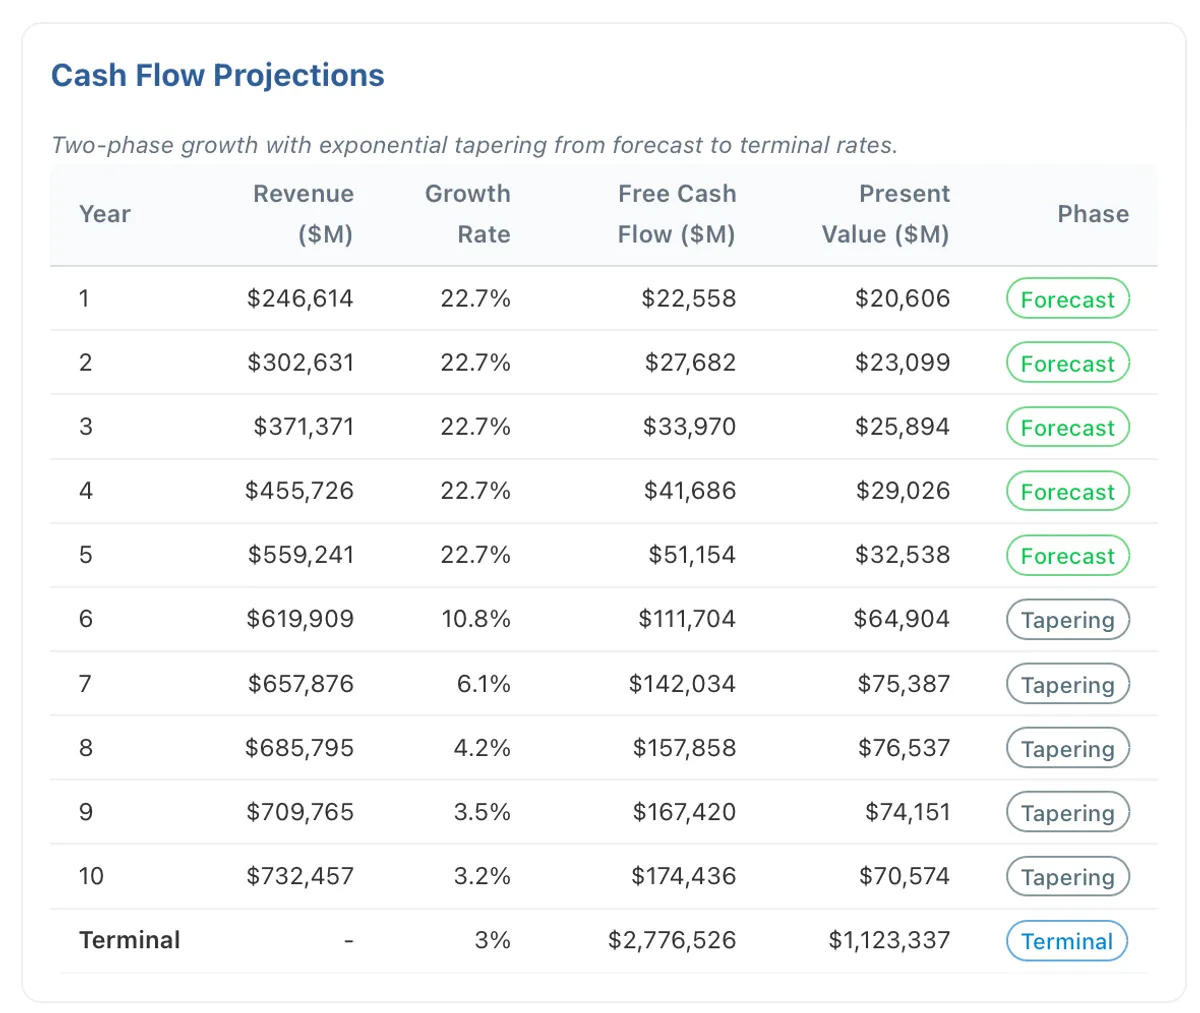
Figure 4. 10-year cash flow projections: Phase 1 at 22.7% growth (Years 1-5) shows constrained FCF from heavy CapEx; Phase 2 tapering (Years 6-10) unlocks massive free cash flow as investment intensity normalizes.
DCF Valuation Summary
The DCF analysis yields a total enterprise value of $1.62 trillion. The present value of the 10-year forecast period contributes $492.7 billion (30.5%), while the discounted terminal value adds $1.12 trillion (69.5%).
The 70/30 split between terminal and forecast value is typical for high-growth companies. It means the majority of Meta's value lies in cash flows beyond the explicit 10-year forecast, reinforcing why the conservative 3% terminal growth assumption is critical.
Subtracting $48.0 billion in net debt produces an equity value of $1.57 trillion. Dividing by 2.57 billion diluted shares yields an intrinsic value of $609.18 per share.
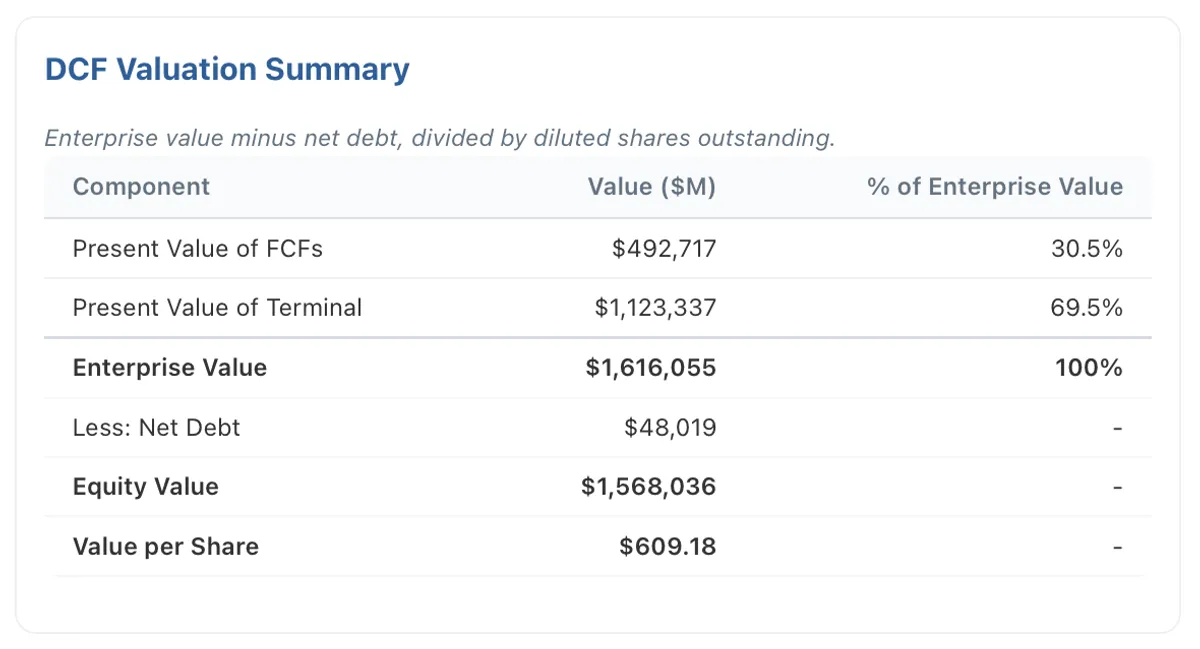
Figure 5. Valuation bridge: $492.7 billion from 10-year forecasts (30.5%) plus $1.12 trillion terminal value (69.5%) equals $1.62 trillion enterprise value. Subtract $48.0 billion net debt, divide by 2.57 billion shares = $609 per share.
What the DCF Model Estimates: $609 Intrinsic Value
With Meta trading at $622.66, the DCF analysis yields an intrinsic value of $609.18 per share, representing a modest 2.2% premium to the model's intrinsic-value estimate. Our DCF model estimates Meta priced near its intrinsic-value estimate: the market price sits within rounding distance of the model's output.
This result is grounded in verifiable data: 22.7% growth from analyst consensus across 16-46 analysts, 45.6% EBITDA margins from demonstrated profitability, 9.47% WACC from FMP market data, and 3.0% terminal growth.
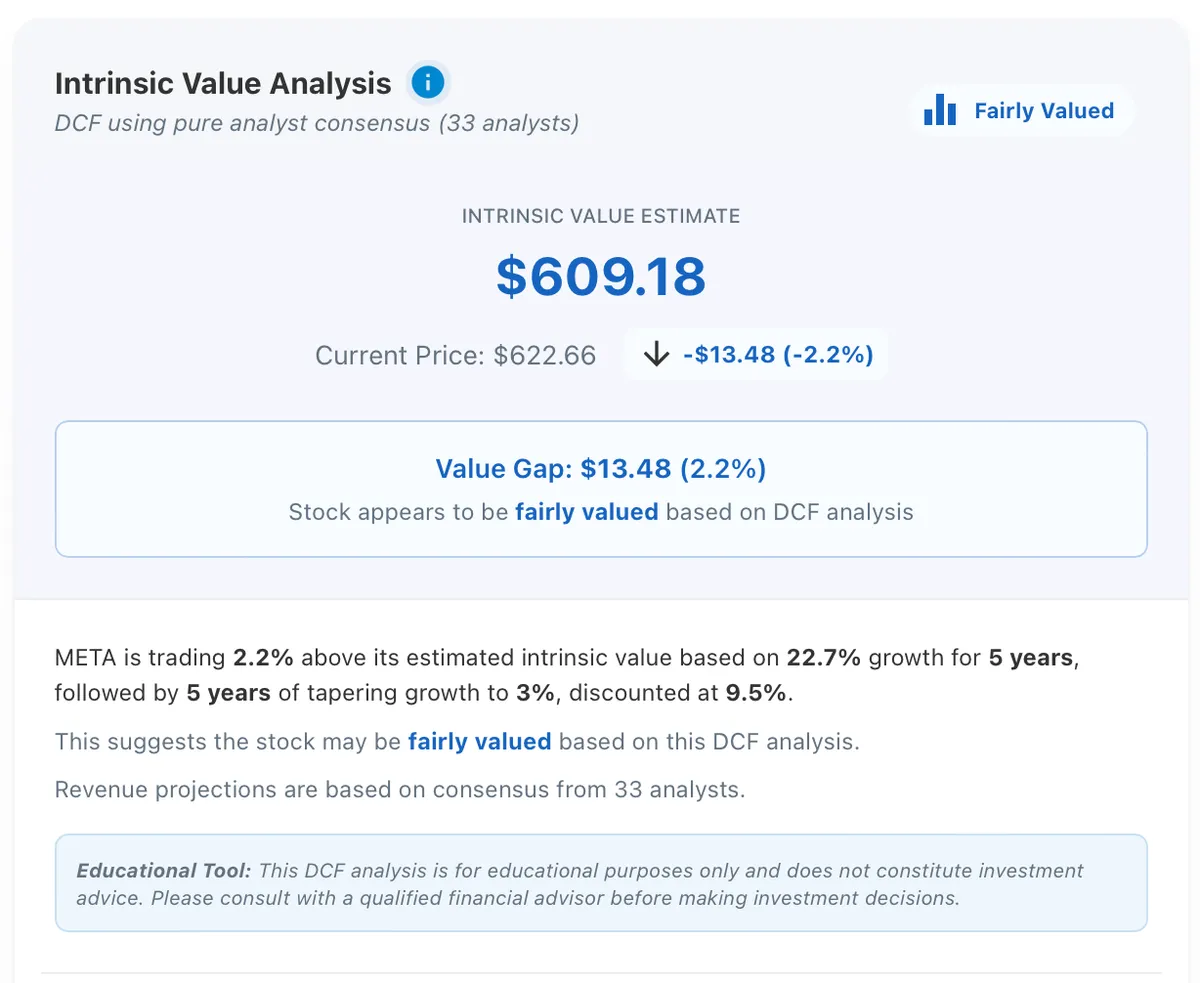
Figure 6. Intrinsic value of $609.18 versus current price of $622.66: a 2.2% premium to the model's intrinsic-value estimate, placing META near our DCF intrinsic-value estimate.
Stress Testing the Fair Value Conclusion
The near-zero gap between price and intrinsic value means small assumption changes can move the model's estimate from price sitting slightly above the intrinsic-value estimate to well below it, or vice versa. This sensitivity is the defining feature of near-intrinsic-value situations.
Sensitivity to Discount Rate (WACC): Holding growth constant at 22.7%:
Table 1. WACC sensitivity: Small changes in discount rate dramatically swing the valuation conclusion.
| WACC | Intrinsic Value | vs $623 |
|---|---|---|
| 8.0% | $837 | 35% upside |
| 9.47% (Base Case) | $609 | -2% (fair) |
| 10.5% | $504 | 19% downside |
| 12.0% | $395 | 37% downside |
Sensitivity to Growth Rate: Holding WACC constant at 9.47%:
Table 2. Growth sensitivity: The growth assumption is less impactful than WACC but still material.
| Growth Rate | Intrinsic Value | vs $623 |
|---|---|---|
| 18% | $479 | 23% downside |
| 22.7% (Base Case) | $609 | -2% (fair) |
| 25% | $680 | 9% upside |
| 28% | $784 | 26% upside |
The sensitivity analysis confirms that Meta's valuation is finely balanced. A modest 1.5 percentage point reduction in WACC (from more favorable risk assessment) could unlock 35% upside. But a 1 percentage point increase would suggest 19% overvaluation. The investment thesis hinges on whether you believe Meta's risk profile warrants a discount rate above or below the FMP-derived 9.47%.
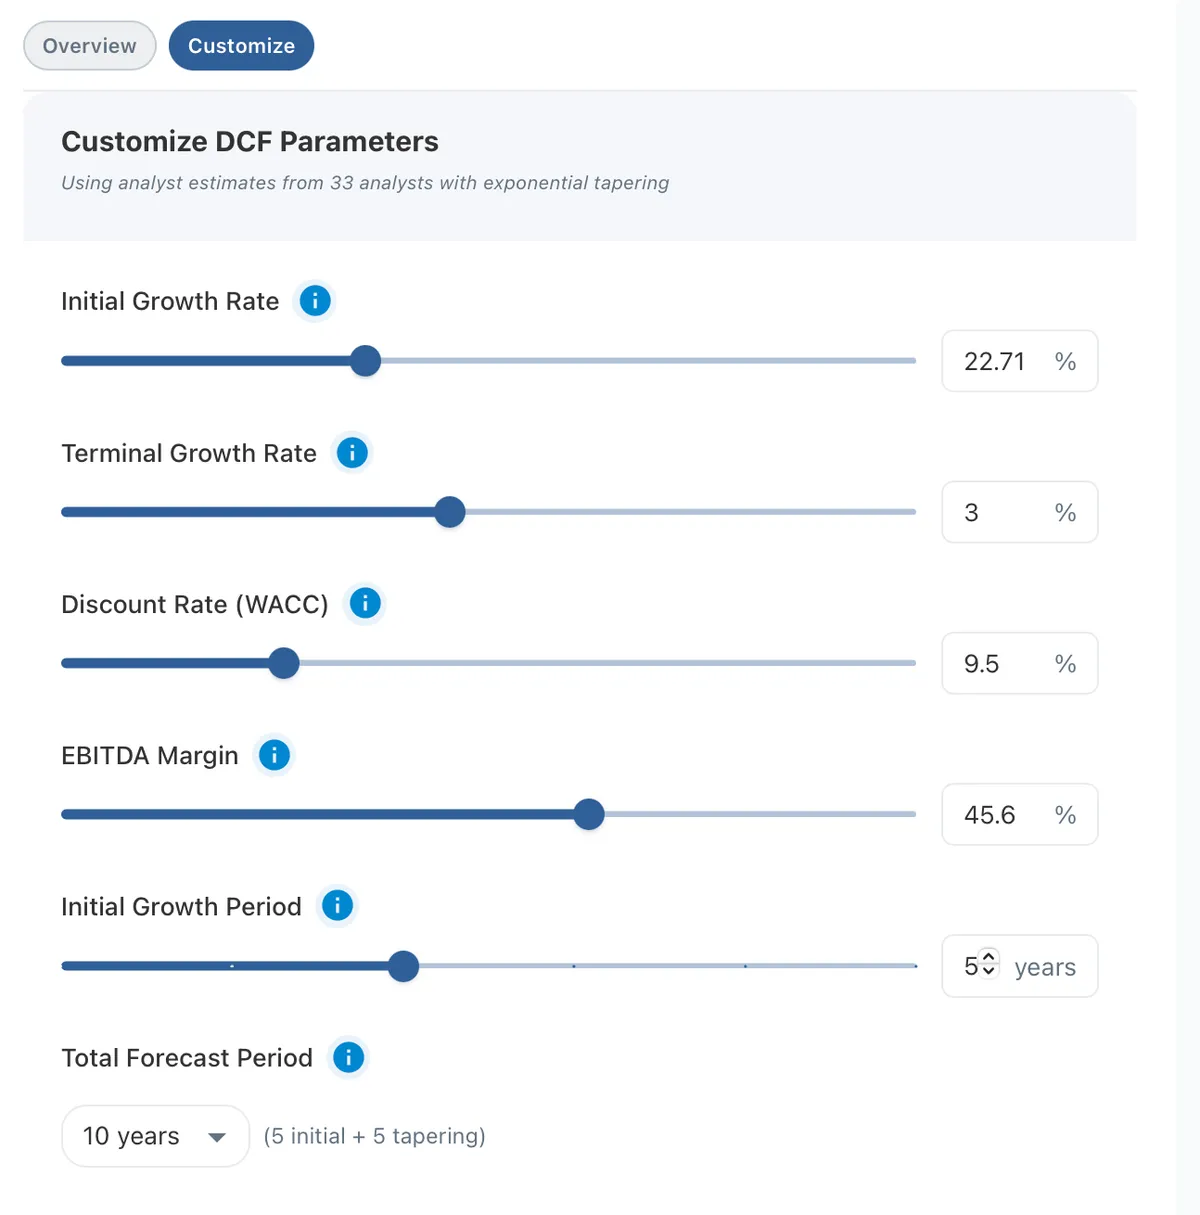
Figure 7. Interactive controls let you adjust growth, discount rates, and forecast periods to test different scenarios and see how assumptions affect Meta's intrinsic value in real-time. The live controls are on our Valuation Analysis page.
The Multiples Perspective
While DCF provides the intrinsic value anchor, valuation multiples reveal how the market prices Meta relative to its fundamentals and peers. Our framework analyzes 10 key metrics, comparing each against 22 communication services sector peers, Meta's own 10-year history, and forward analyst estimates.
Each metric produces a peer-implied fair value: the price Meta would trade at if it carried the same multiple as its sector's median. The composite picture tells a more cautious story than DCF alone. The median peer-implied fair value across available multiples suggests a lower price, reflecting that Meta trades at a premium to its communication services peers on most measures.
This is where the DCF and multiples perspectives diverge. DCF, which explicitly models Meta's 22.7% growth and 45.6% margins over 10 years, sees fair value near the current price. Peer multiples, which compare Meta to a sector that includes slower-growing media and telecom companies, see a premium.
The divergence makes sense. Meta's growth rate, margin profile, and AI positioning are fundamentally different from a typical communication services company. Peer-based multiples may undervalue Meta by using an inappropriate reference group, while DCF captures the company-specific trajectory that justifies the premium.
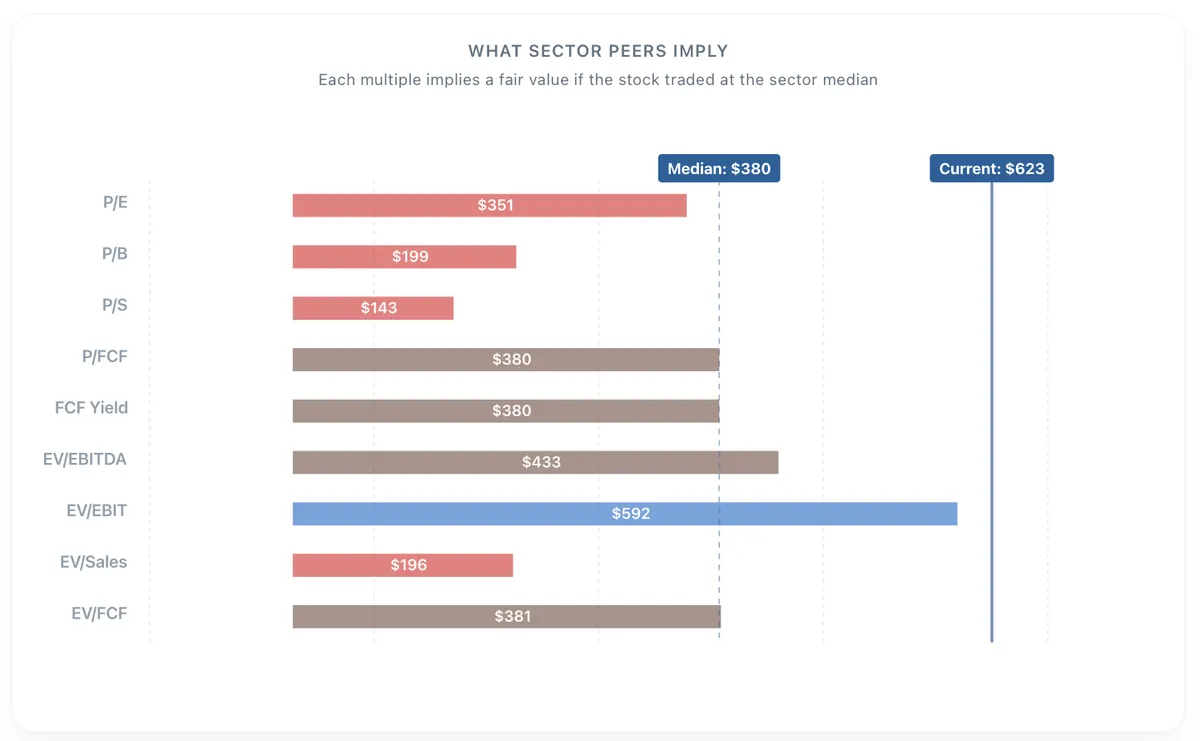
Figure 8. Valuation multiples summary: peer-implied fair values, current price reference, and the tension between peer-relative pricing and fundamental DCF value.
The CapEx Question
The single most important variable in Meta's valuation is capital expenditure normalization. The current model projects CapEx intensity (as a percentage of revenue) declining significantly in Phase 2, allowing free cash flow to expand dramatically even as revenue growth slows.
If this normalization happens, the Phase 2 FCF expansion justifies the current stock price. Meta builds out its AI infrastructure, begins generating returns on that investment, and CapEx intensity declines to levels more typical of a mature platform.
If CapEx remains elevated, whether because AI infrastructure requires perpetual reinvestment, competitive dynamics force continued spending, or the investments fail to generate adequate returns, the Phase 2 FCF expansion may not materialize. In that scenario, Meta's intrinsic value could be materially lower than $609.
This is not a risk the DCF model can resolve. It requires judgment about the nature of AI infrastructure: is it a one-time buildout (like data centers in the cloud era) or an ongoing arms race (like content spending in streaming)? The answer fundamentally determines whether the model estimates Meta priced near or above its intrinsic-value estimate. We returned to exactly this question, and put both capex paths through the model, in Meta's Capex Bet.
The Practical Takeaway
Meta Platforms exemplifies why comprehensive valuation analysis matters. The stock sits in that nuanced middle ground where the investment decision depends more on conviction about the business than on valuation arbitrage.
The DCF analysis provides the anchor: $609 intrinsic value places the current $623 price in fair value territory. The near-zero gap means neither aggressive buying nor urgent selling is warranted based on fundamentals alone.
The multiples analysis adds complexity: peer comparisons suggest a premium, but Meta's growth and margin profile arguably justify that premium. The tension between approaches highlights the limitations of sector-based comparisons for a company that doesn't fit neatly into its classification.
The CapEx trajectory is the swing factor. Investors bullish on Meta's AI monetization can reasonably argue that normalized CapEx will drive FCF expansion beyond what the base case models. Bears can point to the risk that AI infrastructure becomes an indefinite cost of doing business. The valuation framework quantifies these scenarios; the investor must choose between them.
This analysis represents just one of five dimensions in our 5D Framework for stock analysis. On our platform, explore Quality Analysis for META's business fundamentals, Peer Comparisons benchmarking against communication services competitors, Analyst Sentiment for Wall Street's forward outlook, and Holdings Analysis showing what institutional investors are doing with their META positions.
DCF valuation based on trailing twelve month data, 10-year historical financials, and consensus analyst estimates as of March 2026. WACC inputs from FMP (Financial Modeling Prep) market data. Data sourced from 10-K filings via Financial Modeling Prep API.
This analysis is for educational purposes only and does not constitute investment advice. DCF results rely on assumptions that may not materialize. Consult qualified financial advisors before making investment decisions.