
Analyst Sentiment: Reading Professional Expectations
Wall Street analysts spend careers studying companies and industries. Their estimates, price targets, and ratings reveal forward expectations that historical data cannot capture.
Equity research analysts dedicate their careers to understanding specific industries and companies. They model financials, attend management calls, analyze competition, and project future performance. Their estimates, price targets, and recommendations aggregate into consensus views that reveal market expectations.
This is not about blindly following recommendations. Analysts miss disruption, display optimistic bias, and issue contradictory guidance. But aggregated estimates provide valuable forward-looking signals. When 40 analysts revise earnings upward simultaneously, that coordination suggests meaningful developments. When price targets cluster below current prices, that divergence demands investigation.
Why Analyst Estimates Matter
Historical financial analysis examines past performance across ten years of returns, margins, cash flows, and growth. You compare metrics to peers and calculate intrinsic value from trailing fundamentals. This establishes a foundation but looks backward.
Analyst estimates project forward. They incorporate management guidance, industry trends, product pipelines, competitive threats, and macro factors into forecasts. A company might have grown 8% annually for a decade. But if new products launch or markets expand, next year might show 15% growth. Historical data misses this inflection. Analyst estimates capture it.
Consensus also reveals what markets have priced in. A quality company at 25 times earnings implies growth expectations. If consensus shows 3% revenue growth, that premium appears unjustified. If estimates show 20% growth, the multiple makes sense.
Estimate revisions reflect changing sentiment. When multiple analysts raise forecasts simultaneously, that shows a shift in collective expectations. When analysts cut estimates in concert, that reflects a downward shift in expectations.
What the Data Reveals
Analyst coverage produces four primary data types, each revealing different aspects of professional sentiment.
Price Targets: Expected Fair Value
Price targets represent analyst estimates of where stock prices should trade over the next 12 months based on fundamental analysis. Each analyst publishes a target reflecting their view of fair value. The platform aggregates these into high, median, and low ranges.
Microsoft trades at approximately $405, with analyst price targets showing a median of $600, a high of $675, and a low of $392. The median target, 48% above the current price, suggests analysts believe the stock is undervalued relative to fundamentals. The wide range from $392 to $675 indicates meaningful disagreement about fair value, with some analysts seeing limited upside and others seeing significant appreciation potential.
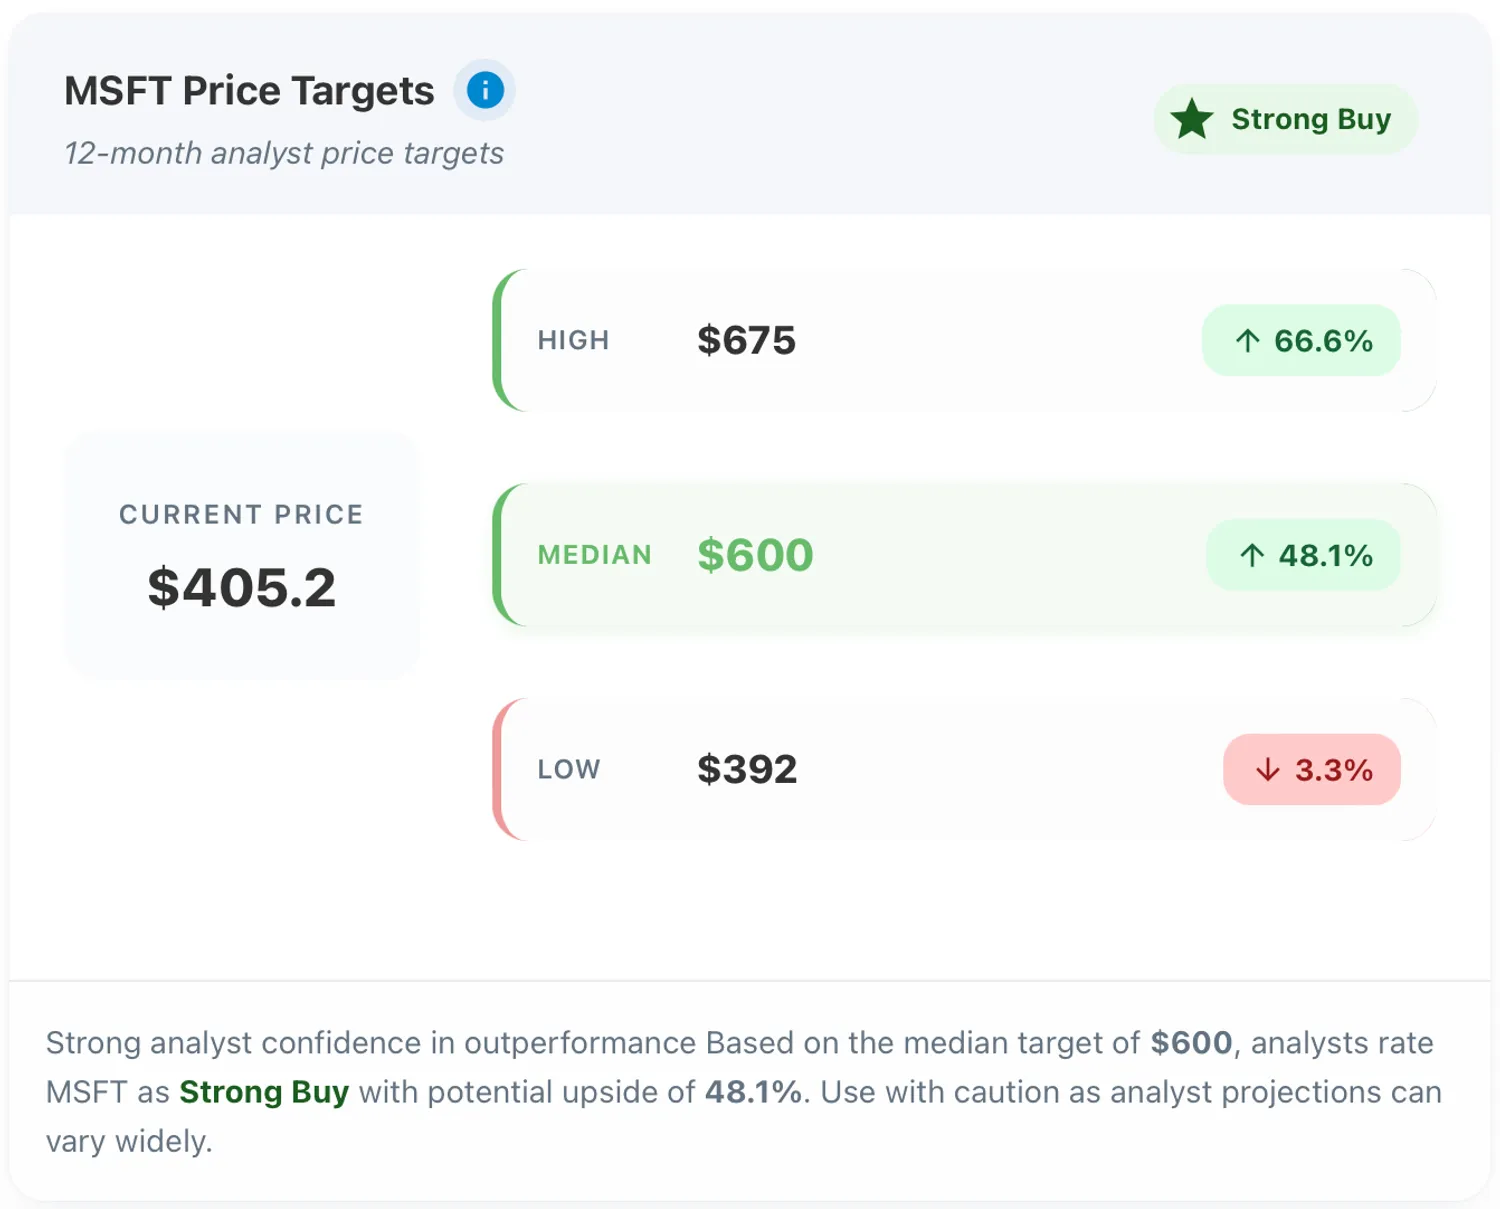
Figure 1: Microsoft price targets
NVIDIA shows a median target of $275 versus a current price around $183, implying 50% upside. But the range extends from $140 to $400, nearly a 3x spread between bearish and bullish views. This wide dispersion reflects uncertainty about AI demand sustainability, competition, and valuation appropriate for rapid growth. High dispersion reduces conviction regardless of median target direction.
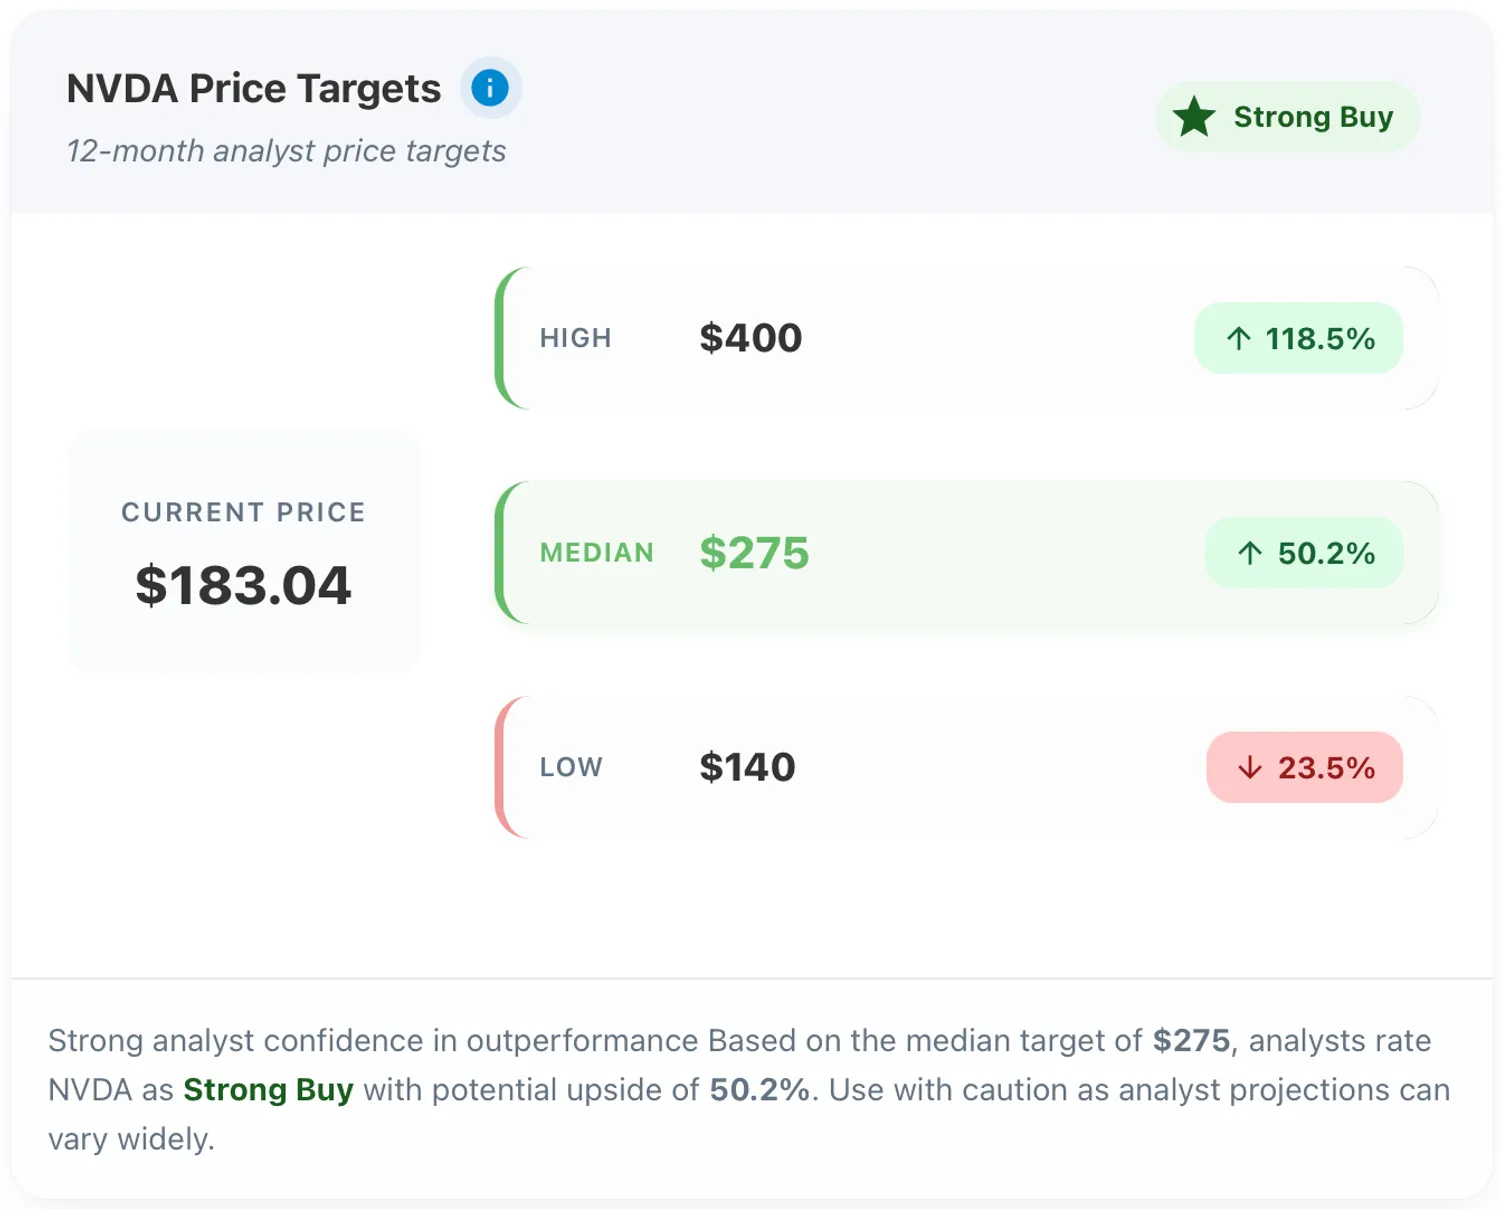
Figure 2: NVIDIA price targets
Coverage count matters enormously for the reliability of price targets. Microsoft has 78 analysts contributing to the consensus. NVIDIA has 79. These large analyst pools reduce the impact of individual bias and increase statistical significance. When one analyst publishes an outlier target, the median barely moves. When 40 analysts cluster around similar values, that agreement strengthens the signal.
Stock Grades: Investment Recommendations
Analyst recommendations distill complex analysis into ratings: Strong Buy, Buy, Hold, Sell, Strong Sell. The distribution reveals sentiment intensity beyond simple consensus.
Microsoft shows 62 Buy ratings, 16 Hold, and minimal Sell recommendations among 78 total analysts. This heavily bullish tilt indicates strong professional conviction. The consensus "Buy" rating backed by 79% of analysts in Buy or Strong Buy categories suggests widespread agreement about positive outlook.
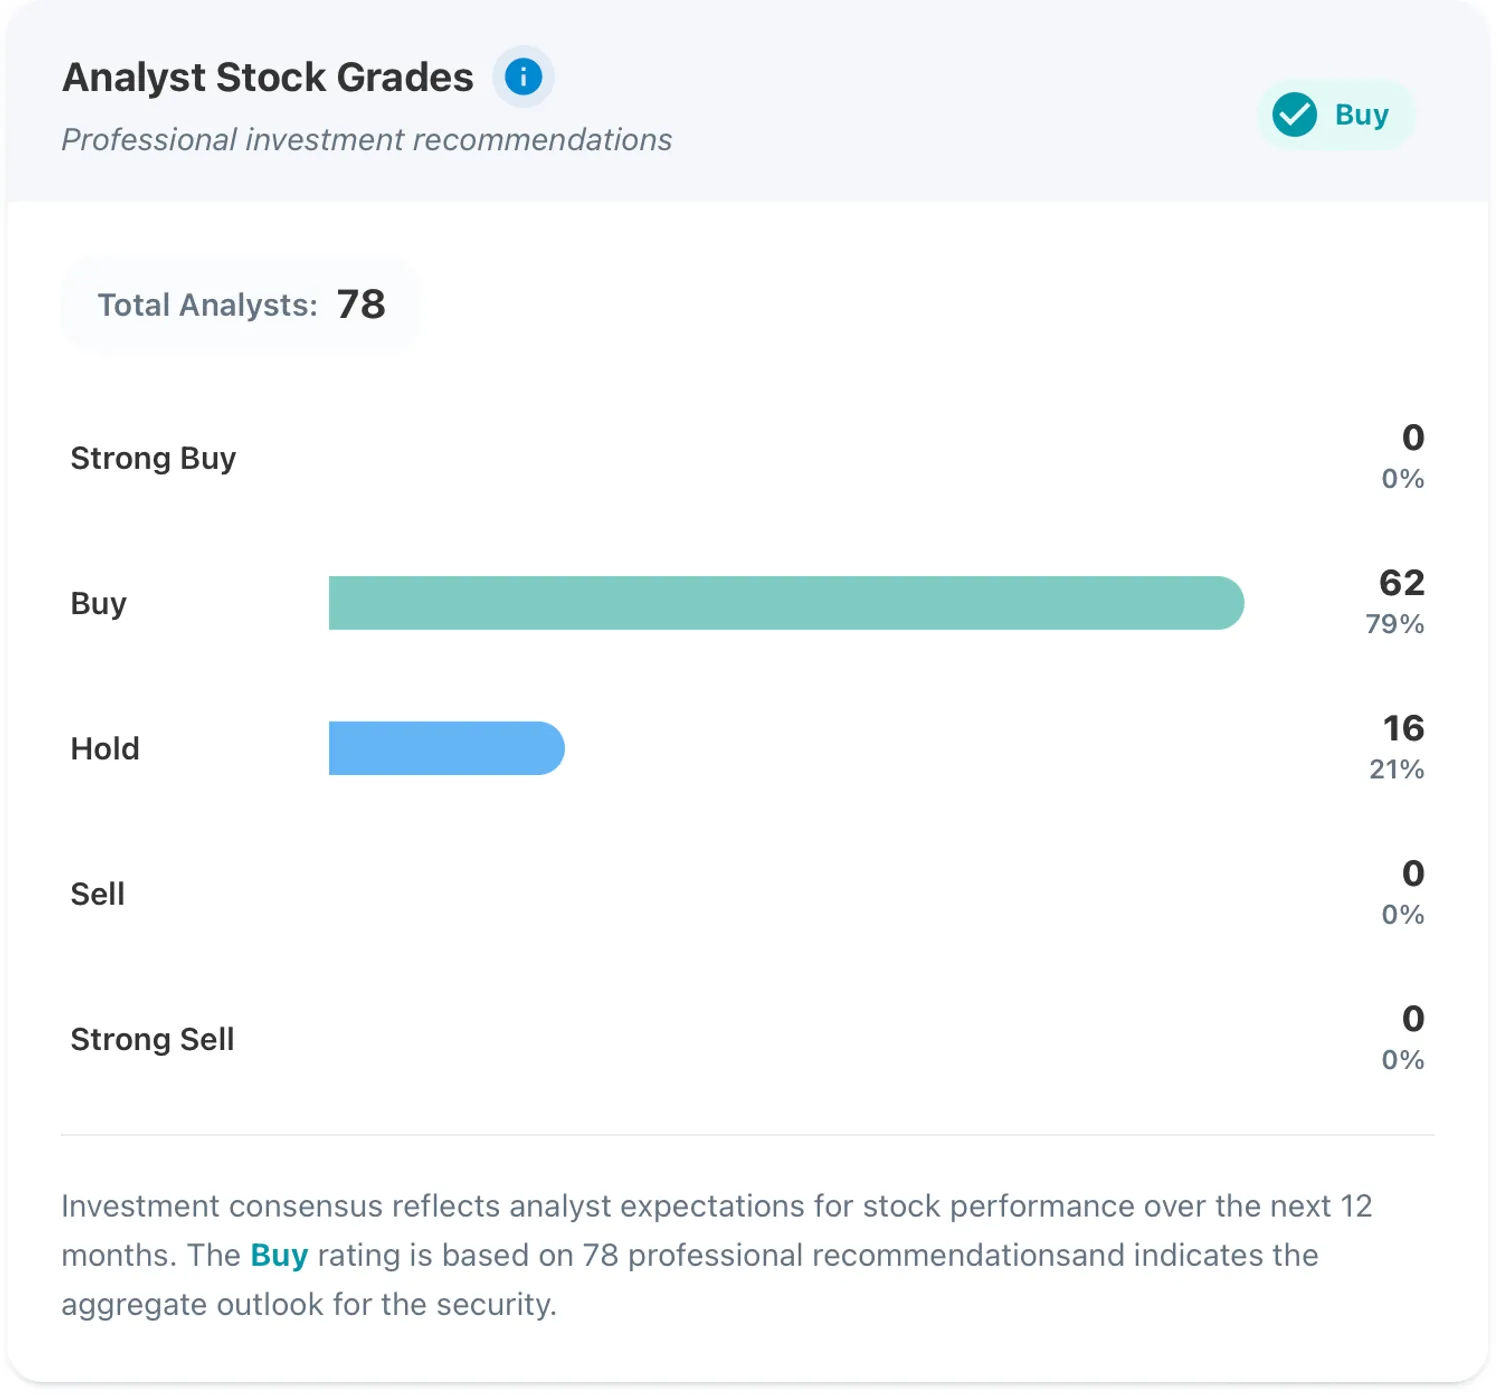
Figure 3: Microsoft stock grades
Tesla presents different patterns with 80 total analysts but a "Hold" consensus. The distribution likely shows more balanced views between bullish and bearish camps, creating the neutral consensus. A Hold recommendation backed by significant analyst disagreement signals uncertainty about direction rather than conviction about fair value.
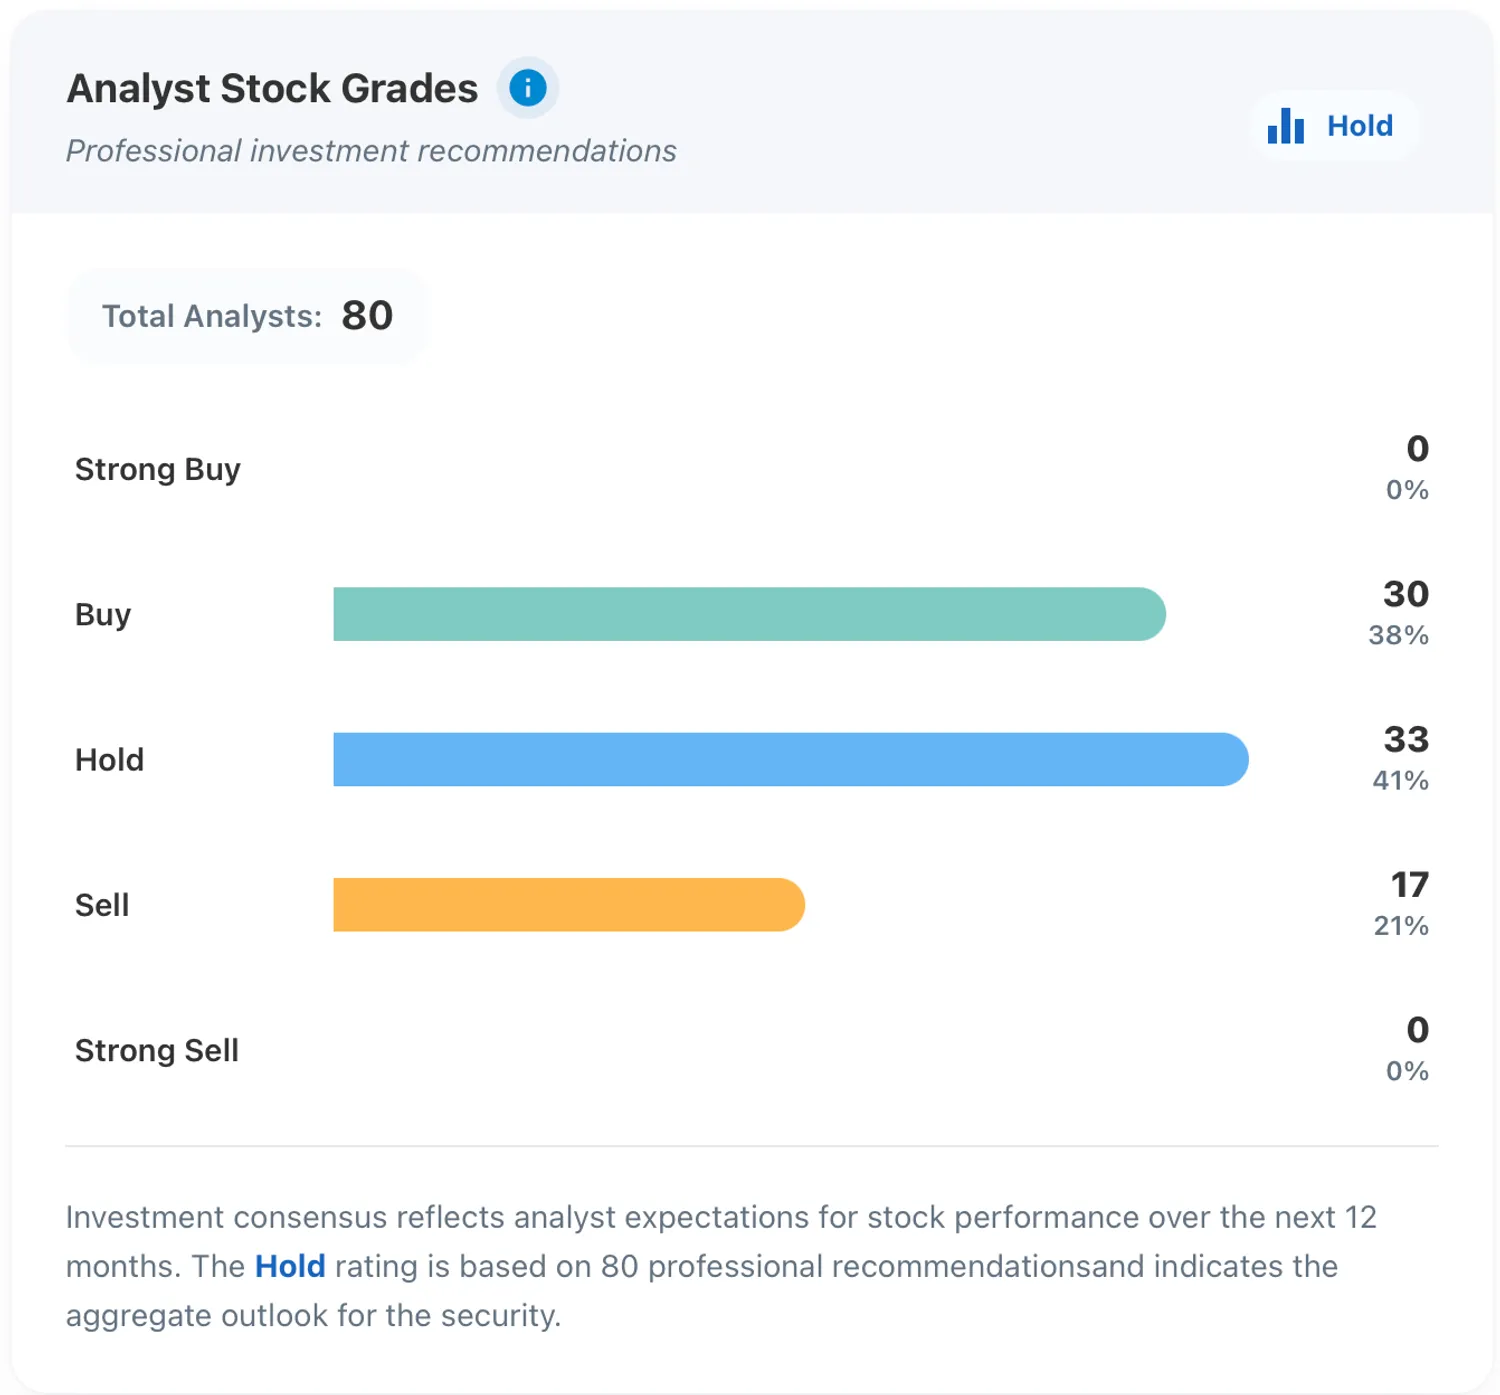
Figure 4: Tesla stock grades
The strength of consensus matters as much as direction. When 70% or more of analysts align in one category, that concentration indicates higher confidence. When recommendations spread evenly across Buy, Hold, and Sell, that dispersion reflects genuine uncertainty about company prospects or valuation appropriateness.
Financial Ratings: Fundamental Health Assessment
Financial health ratings provide letter grades evaluating overall fundamental strength. These scores synthesize multiple financial metrics into comprehensive assessments ranging from A (excellent) to F (poor).
Microsoft earns a "B+" rating with a 3.0 out of 5.0 score despite nice growth. The good but not excellent grade likely reflects analysts' concerns. Quality scores can trail market enthusiasm when growth comes with execution risk.
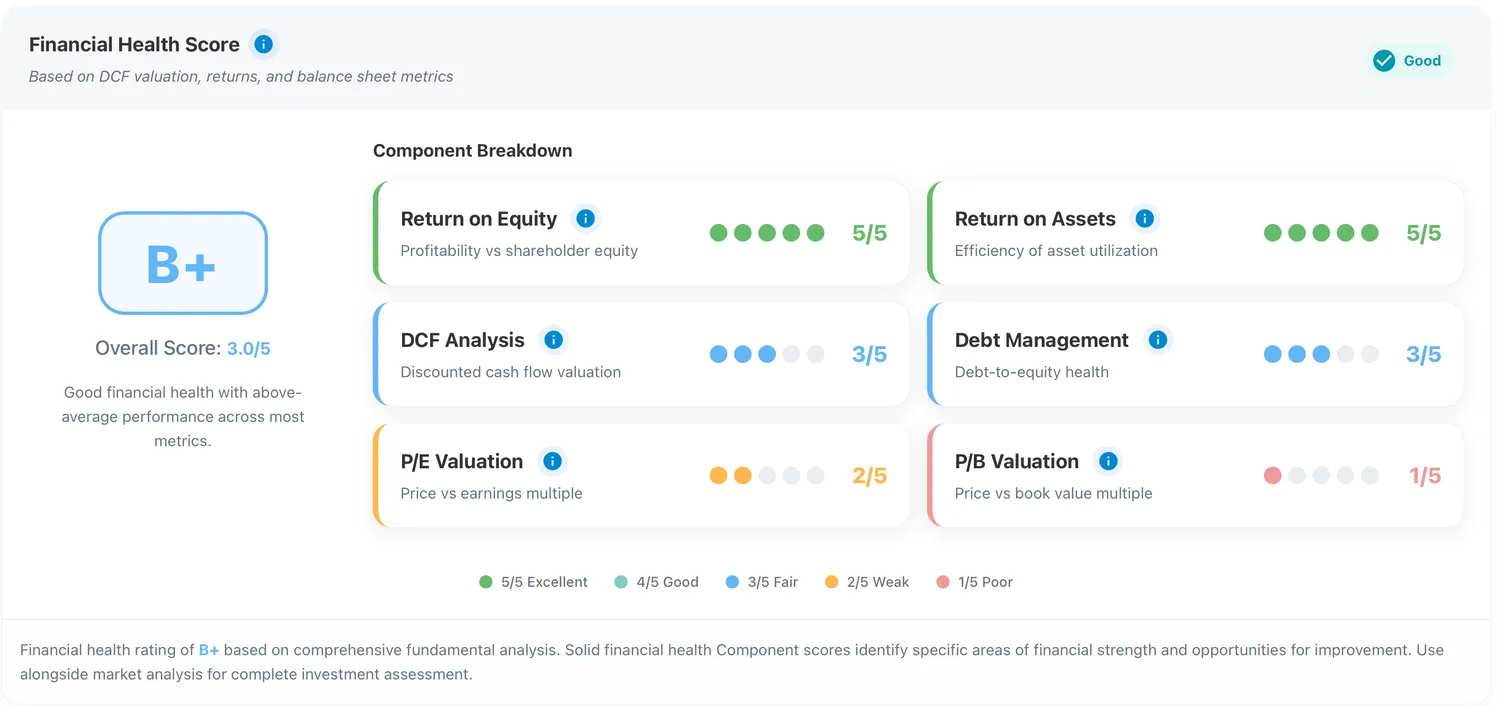
Figure 5: Microsoft financial ratings
NVIDIA receives an "A-" rating with a 4.0 score. This top-tier assessment reflects strong performance across returns, margins, cash-flow quality, and balance-sheet metrics. The rating indicates analysts' view of NVDA's fundamental health as excellent with minimal financial risk.
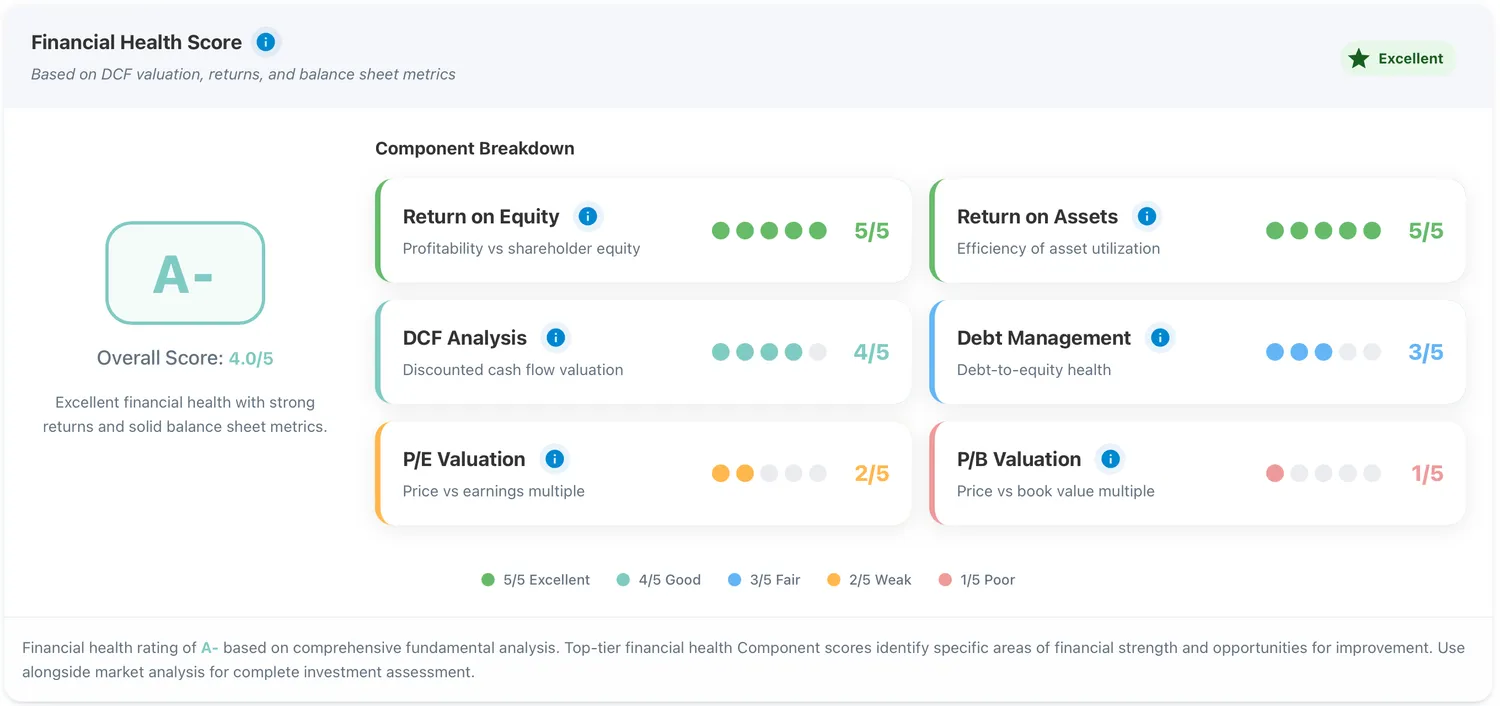
Figure 6: NVIDIA financial ratings
Tesla's "B-" rating with a 2.0 score reveals analyst concerns about fundamental health despite market popularity. The below-average assessment might reflect negative free cash flow, high debt levels, or margin pressure. Financial ratings focus on current fundamental strength rather than future growth potential, creating potential divergence from price targets and stock grades.
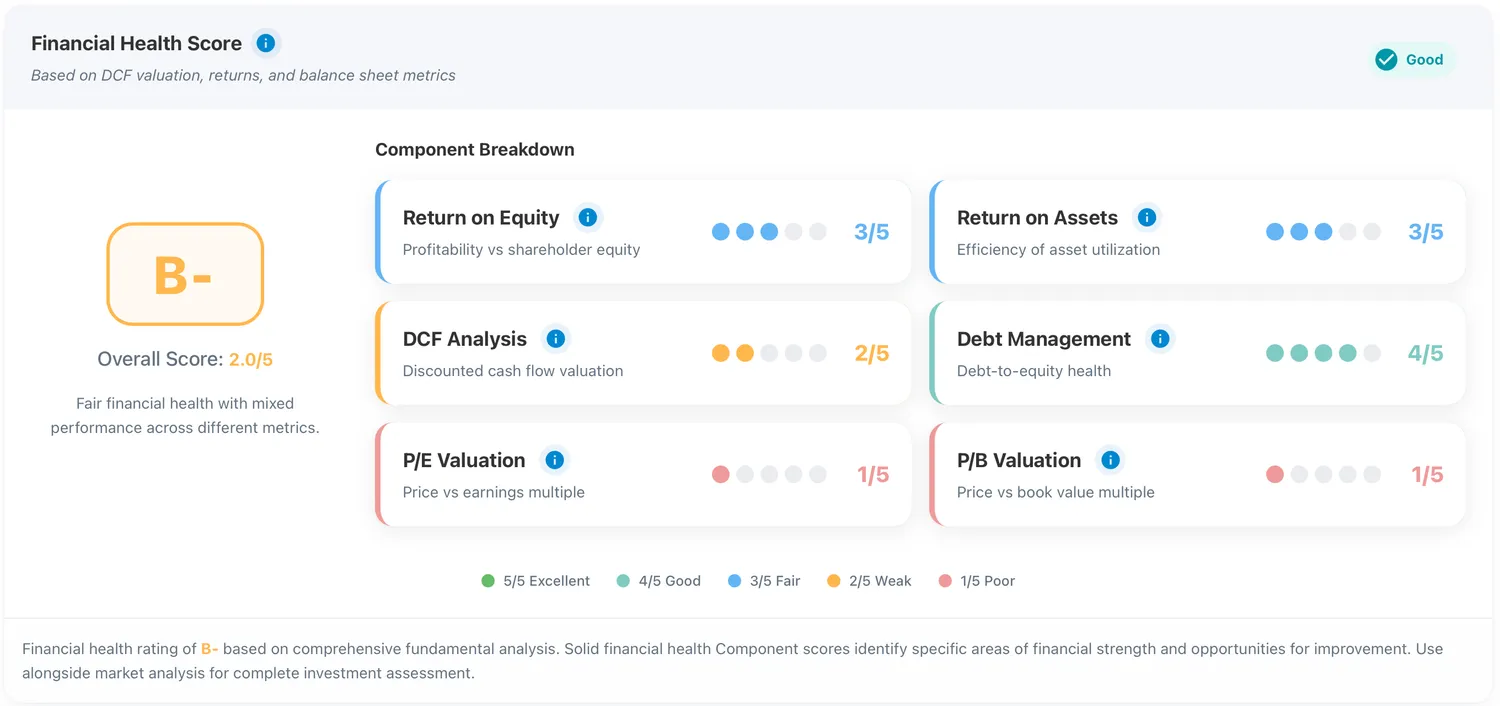
Figure 7: Tesla financial ratings
Earnings Estimates: Growth Projections
Revenue and earnings per share estimates project future financial performance. These forward projections combine with historical data to show expected trajectories.
NVIDIA's 2026 fiscal year estimates show revenue consensus around $216 billion with EPS of $4.94, based on 36 revenue analysts and 32 EPS analysts. The 2027 estimates project $363 billion in revenue with $8.25 EPS. This represents expected 68% revenue growth and 67% EPS expansion, reflecting analysts' views on continued AI demand. The analyst count also matters significantly. Estimates with fewer than 5 analysts carry minimal statistical significance.
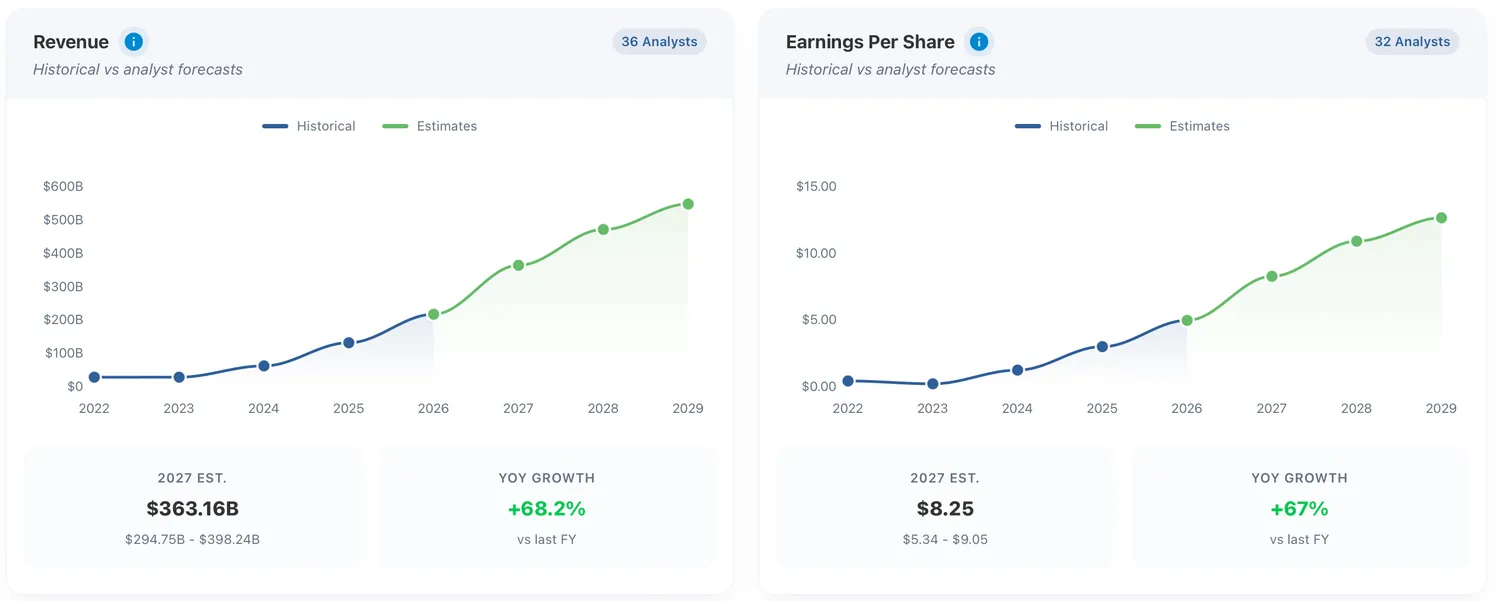
Figure 8: NVIDIA earnings estimates
Estimate trends reveal sentiment shifts more clearly than absolute numbers. When revenue estimates for next year rise from $200 billion to $220 billion over a quarter as analysts update models, that upward revision indicates an improving outlook. When estimates fall from $220 billion to $200 billion, that downward revision signals deteriorating expectations. The direction and magnitude of estimate changes often matter more than the estimates themselves.
When to Trust and When to Doubt
Analyst estimates provide a valuable forward-looking perspective but come with inherent limitations and biases that require careful interpretation.
Strong coverage improves reliability dramatically. Companies followed by 30 or more analysts benefit from diverse perspectives that average out individual errors and biases. Microsoft, NVIDIA, and Apple, with 40 to 100+ analysts, generate statistically robust consensus estimates. One analyst getting revenue growth wrong barely impacts the average. Ten analysts simultaneously revising estimates creates a meaningful signal.
Weak coverage produces unreliable signals. Companies covered by 1 to 5 analysts lack statistical significance. A single bullish analyst can create a misleading positive consensus. One analyst's departure can eliminate coverage entirely. Stocks with minimal analyst following require extreme caution when interpreting any analyst-derived metrics.
Analysts display a structural optimistic bias stemming from sell-side business model incentives. Investment banks generate revenue from underwriting, advisory work, and trading. Maintaining positive relationships with company management supports these activities. Issuing negative research or sell ratings strains relationships and potentially reduces business opportunities. This creates pressure toward bullish recommendations and generous price targets.
The optimistic bias appears most clearly in recommendation distributions. Across the market, Buy and Strong Buy recommendations vastly outnumber Sell and Strong Sell ratings. Hold becomes the de facto negative rating. When an analyst downgrades from Buy to Hold, that often signals a deteriorating view despite the neutral-sounding recommendation.
Recent estimate revisions carry more weight than old projections. An estimate published six months ago incorporated assumptions and data now outdated. An estimate revised last week reflects current information and management guidance. When evaluating consensus, recent estimate changes matter more than the consensus number itself.
Integration with the Framework
Analyst sentiment gains meaning when combined with other analytical dimensions rather than when isolated.
Quality and peer analysis from Dimensions 1 and 2 establish fundamental strength. Strong quality scores, top-quartile peer rankings, and excellent returns indicate a business that should generate growth. If analyst estimates project 3% revenue growth for this quality company, that disconnect demands investigation. Are analysts too pessimistic? Is the business maturing faster than fundamentals suggest? The divergence creates questions.
Conversely, weak quality scores and poor peer rankings indicate challenged fundamentals. If analysts project 20% revenue growth for this struggling business, that optimism appears questionable. Either analysts see a turnaround not yet visible in historical data, or their estimates reflect outdated assumptions about recovery prospects. The alignment or divergence between fundamental quality and analyst expectations reveals tension.
Valuation analysis from Dimension 3 provides context for price targets. A median price target 40% above the current price sounds attractive. But if that target trades at 50 times earnings and DCF analysis shows a fair value 20% below the current price, the analyst target reflects optimism that fundamental valuation cannot support. Price targets must reconcile with intrinsic value estimates.
When analyst price targets, DCF valuations, and valuation multiples all suggest similar fair value ranges, conviction strengthens. All analytical approaches converge on comparable conclusions. When they diverge significantly, investigation intensifies to understand which perspective captures reality more accurately.
Holdings analysis from Dimension 5 shows whether informed investors back analyst views with capital. Analysts might maintain bullish ratings and elevated price targets while insiders sell shares aggressively. That behavioral divergence from expressed sentiment suggests skepticism about the rosy projections. Conversely, analysts might issue cautious estimates while institutions accumulate shares, indicating smart money sees opportunity analysts miss.
The complete framework synthesizes these signals. Quality fundamentals plus peer leadership plus reasonable valuation plus bullish analysts plus smart money accumulation creates a compelling opportunity. Quality fundamentals, strong peer rankings, and analyst optimism minus insider selling raise concerns about sustainability. The multidimensional view reduces reliance on any single signal, including analyst consensus.
Making This Actionable
Analyst sentiment provides a forward-looking perspective that complements backward-looking fundamental analysis. Price targets show expected fair value ranges. Stock grades reveal recommendation consensus and distribution. Financial ratings assess fundamental health. Earnings estimates project growth trajectories.Coverage quality determines signal reliability. Recent estimate revisions matter more than absolute consensus numbers.
But analyst data requires interpretation alongside structural biases. Sell-side optimism inflates recommendations and price targets. Analysts struggle with inflection points and disruption. Consensus often reflects backward-looking extrapolation rather than forward insight. These limitations demand combining analyst sentiment with quality analysis, peer comparison, valuation work, and ownership behavior.
Explore analyst sentiment for any S&P 1500 company with our Analysts tool. The page presents price targets, stock grades, financial ratings, and earnings estimates with coverage depth and recent revisions highlighted. From there, examine Quality, Peers, Valuation, and Holdings to build the complete picture.
Analyst estimates, price targets, ratings, and recommendations sourced from consensus data aggregated from professional equity research as of 6 March 2026. Coverage counts and estimate dates vary by company.
This article is for educational purposes only and does not constitute investment advice. Always conduct your own research and consider consulting with financial professionals before making investment decisions.