
10 Stocks Analysts Expect to Rise the Most and What the Data Really Shows
We screened the S&P 500 for stocks where 100% of analyst price targets exceed the current price. Then we applied our full Analyst Sentiment framework to see if the optimism holds up.
In a market where analysts rarely agree on anything, finding stocks where every single price target points higher is unusual. Finding stocks where even the most pessimistic analyst expects double-digit gains is rarer still.
Amid recent market volatility, we screened the S&P 500 for companies where 100% of analyst price targets exceed the current stock price, then ranked them by median upside potential and selected the top 10 stocks. The result is a group of stocks where Wall Street is uniformly bullish on direction, even if estimates differ on how far they can run.
On the surface, that looks compelling. But a single upside percentage tells you almost nothing about whether that optimism is genuine. To understand what analysts actually think, we look at five components: how ratings are distributed, where price targets are heading, what growth expectations look like, whether financial health supports the thesis, and how many analysts are actually following.
This is the Analyst Sentiment dimension of our 5D Framework, and applying it to these ten stocks tells a very different story than the headline numbers suggest.
Ten Stocks With Unanimous Analyst Upside
Table 1. Top 10 S&P 500 stocks with unanimous analyst upside, ranked by median upside potential. Data as of 15 February 2026.
| Rank | Symbol | Company | Current Price | Target Median | Median Upside | Sector |
|---|---|---|---|---|---|---|
| 1 | INTU | Intuit | $399.40 | $792.50 | 98% | Technology |
| 2 | WDAY | Workday | $144.42 | $280.00 | 94% | Technology |
| 3 | NOW | ServiceNow | $107.08 | $200.00 | 87% | Technology |
| 4 | TTD | The Trade Desk | $25.81 | $47.50 | 84% | Technology |
| 5 | APP | AppLovin | $390.55 | $700.00 | 79% | Technology |
| 6 | HOOD | Robinhood Markets | $75.97 | $135.00 | 78% | Financial Services |
| 7 | XYZ | Block | $49.80 | $87.00 | 75% | Technology |
| 8 | AXON | Axon Enterprise | $429.67 | $747.50 | 74% | Industrials |
| 9 | DASH | DoorDash | $160.34 | $272.50 | 70% | Communication Services |
| 10 | CRM | Salesforce | $189.72 | $320.00 | 69% | Technology |
The table shows median upside ranging from 69% to 98%, with technology stocks commanding seven of the ten positions. Intuit leads with 98% implied upside, trading at $399 versus a median price target of $793. Workday follows with 94% upside, currently at $144 against a $280 median target.
Following Intuit and Workday, the list continues with ServiceNow, which has an 87% upside and is a key player in enterprise software solutions. The Trade Desk comes next with 84% upside, a leader in digital advertising technology. AppLovin rounds out the tech-heavy group at 79% upside, providing mobile app marketing and monetization solutions.
Robinhood Markets stands out in financial services with 78% upside, offering a popular trading platform for retail investors. Block, another technology-oriented company, shows 75% upside with its focus on payments and fintech services. Axon Enterprise represents the industrials sector with 74% upside, known for its public safety and law enforcement technology. DoorDash, in communication services, offers 70% upside as a major food delivery platform. Finally, Salesforce closes the list with 69% upside, a cloud software giant specialising in CRM solutions. The concentration in cloud, SaaS, and digital platforms is notable.
The upside figures look compelling. Now, let's apply our Analyst Sentiment framework with five components.
1. Price Targets: Are Targets Rising or Falling?
The framework examines three targets (high, median, low) and critically, how those targets have evolved over time. Price targets at a single point in time can mislead. The trend reveals whether analysts are building conviction or chasing prices down. Rising targets signal building conviction. Falling targets reveal analyst retreat, even when absolute upside remains high.
Table 2. Price target trends for the top 10 stocks, listed alphabetically. NA indicates data not available.
| Symbol | Company | 1M Target | 3M Target | 12M Target |
|---|---|---|---|---|
| APP | AppLovin | $665 | $706 | $662 |
| AXON | Axon Enterprise | NA | $772 | $813 |
| CRM | Salesforce | NA | $310 | $326 |
| DASH | DoorDash | $260 | $266 | $273 |
| HOOD | Robinhood | $128 | $139 | $135 |
| INTU | Intuit | $624 | $745 | $790 |
| NOW | ServiceNow | $182 | $191 | $205 |
| TTD | The Trade Desk | $55 | $47 | $63 |
| WDAY | Workday | $195 | $251 | $263 |
| XYZ | Block | $80 | $83 | $79 |
The target trend data immediately exposes a problem. NOW's targets declined 11% from $205 twelve months ago to $182. INTU fell from $790 to $624. WDAY dropped from $263 to $195. It appears that these stocks don't show high upside because analysts are excited about beaten-down valuations. They show high upside because stock prices fell faster than analysts could cut their targets. The gap seems to reflect analyst lag, not conviction.
When analysts lower targets in lockstep with falling prices, they're confirming what the market already knows. The framework catches this. APP is the clear exception: targets rose from $662 to $706 before settling at $665, one of the few cases where analyst expectations strengthened or remained stable. Similarly, XYZ holds steady at $79–$83 and DASH shows a controlled decline rather than wholesale revision.
2. Consensus Conviction: What Do the Ratings Actually Say?
A "Buy" consensus headline masks everything. The framework examines the full distribution: what percentage are buys, holds, and sells? High hold percentages signal hedged optimism. Meaningful sell percentages signal genuine disagreement.
Table 3. Rating distribution for the top 10 stocks, sorted alphabetically by symbol.
| Symbol | Company | Buy % | Hold % | Sell % | Total Analysts |
|---|---|---|---|---|---|
| APP | AppLovin | 88% | 8% | 4% | 26 |
| AXON | Axon Enterprise | 78% | 22% | 0% | 18 |
| CRM | Salesforce | 76% | 22% | 2% | 96 |
| DASH | DoorDash | 76% | 24% | 0% | 37 |
| HOOD | Robinhood | 70% | 22% | 9% | 23 |
| INTU | Intuit | 76% | 17% | 7% | 42 |
| NOW | ServiceNow | 87% | 12% | 1% | 67 |
| TTD | The Trade Desk | 61% | 35% | 4% | 46 |
| WDAY | Workday | 59% | 38% | 3% | 79 |
| XYZ | Block | 65% | 26% | 10% | 31 |
The conviction picture diverges sharply from the upside rankings. Workday, ranked second in upside at 94%, shows the weakest conviction: 59% buy with 38% hold from 79 analysts. When more than a third of analysts covering a stock rate it Hold despite projecting near-doubling, they're expressing uncertainty about actually achieving those targets. The framework penalises this, as high hold percentages are a hallmark of crowd-following behaviour rather than genuine conviction.
TTD shows a similar pattern: 35% hold rate alongside 84% upside. Intuit's 7.1% sell rating (alongside Robinhood's 9%) adds some doubts to its leading upside figure. AppLovin and ServiceNow appear to have genuine conviction at 88% and 87% buy ratings.
3. Earnings Growth Expectations: Do Fundamentals Justify the Targets?
Price targets need fundamental support. The framework evaluates absolute revenue and EPS growth expectations, and critically, whether analysts expect growth to accelerate or decelerate relative to history. Extreme projections that don't match analyst conviction levels are treated as warning signals.
Table 4. Revenue and EPS growth expectations for the top 10 stocks, sorted alphabetically by symbol.
| Symbol | Company | 2025 Revenue | 2026 Revenue | Revenue Growth | 2025 EPS | 2026 EPS | EPS Growth |
|---|---|---|---|---|---|---|---|
| APP | AppLovin | $5.48B | $7.94B | 45% | $9.84 | $15.51 | 58% |
| AXON | Axon Enterprise | $2.74B | $3.44B | 26% | $6.31 | $7.59 | 20% |
| CRM | Salesforce | $37.90B | $41.50B | 9% | $6.44 | $11.76 | 83% |
| DASH | DoorDash | $13.76B | $17.89B | 30% | $2.25 | $3.20 | 42% |
| HOOD | Robinhood | $4.47B | $5.52B | 23% | $2.12 | $2.44 | 15% |
| INTU | Intuit | $18.83B | $21.22B | 13% | $13.82 | $23.20 | 68% |
| NOW | ServiceNow | $13.28B | $15.96B | 20% | $1.69 | $4.19 | 148% |
| TTD | The Trade Desk | $2.89B | $3.35B | 16% | $0.85 | $1.09 | 28% |
| WDAY | Workday | $8.45B | $9.54B | 13% | $1.98 | $9.08 | 359% |
| XYZ | Block | $24.30B | $26.85B | 10% | $2.38 | $3.19 | 34% |
AppLovin dominates with 45% revenue growth expectations, projecting revenue to surge from $5.48B to $7.94B in 2026. EPS is expected to jump 58% from $9.84 to $15.51. The strong conviction (88% buy rating) makes sense in this context.
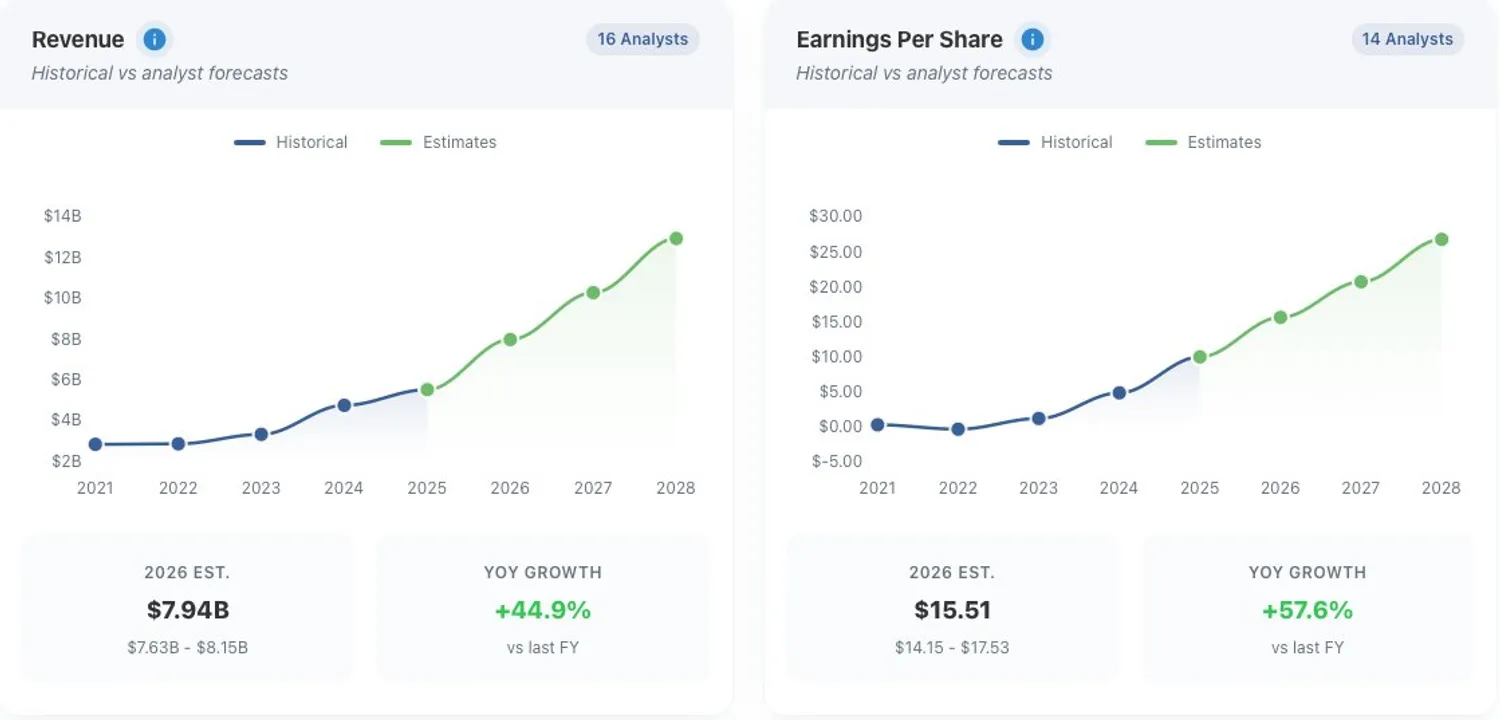 Figure 1. Revenue and EPS growth expectations for AppLovin.
DoorDash follows with 30% revenue growth, projecting revenue to climb from $13.76B to $17.89B in 2026. EPS is expected to grow 42% from $2.25 to $3.20. The broad analyst coverage of 37 contributors and 76% buy rating reflect confidence in that trajectory.
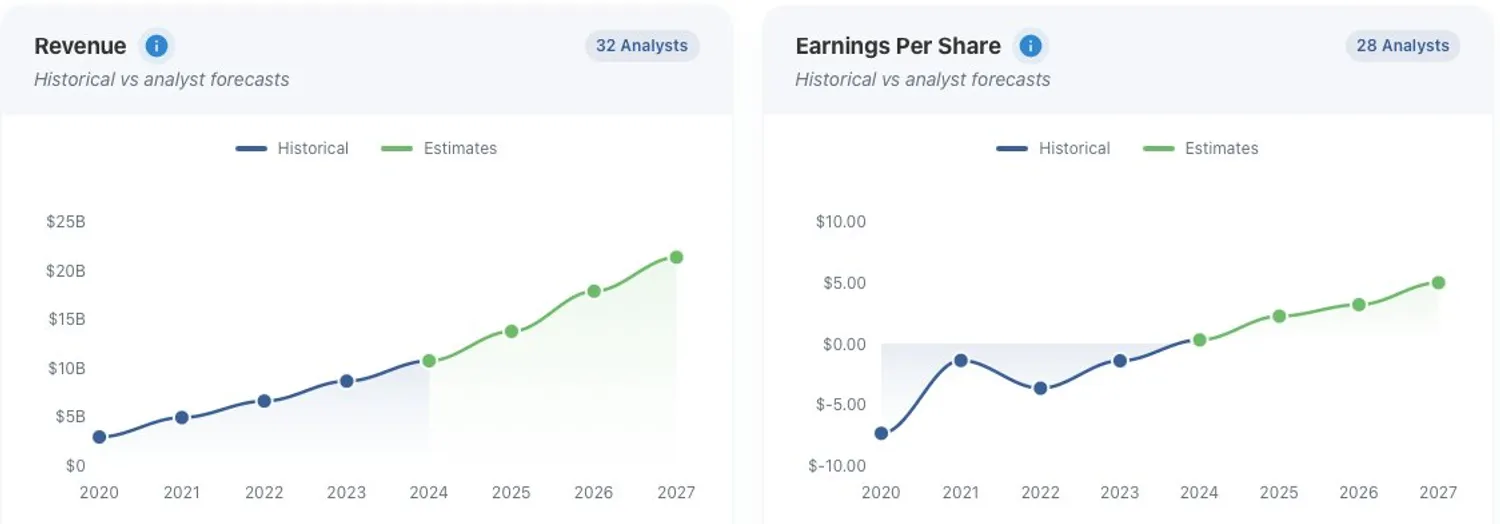 Figure 2. Revenue and EPS growth expectations for DoorDash.
Workday projects the highest EPS growth in the group at 359%, jumping from $1.98 to $9.08 in 2026. However, this figure is inflated by an unusually low 2025 base rather than a dramatic acceleration in business performance. Revenue growth of 13% tells a more grounded story, with revenue expected to move from $8.45B to $9.54B.
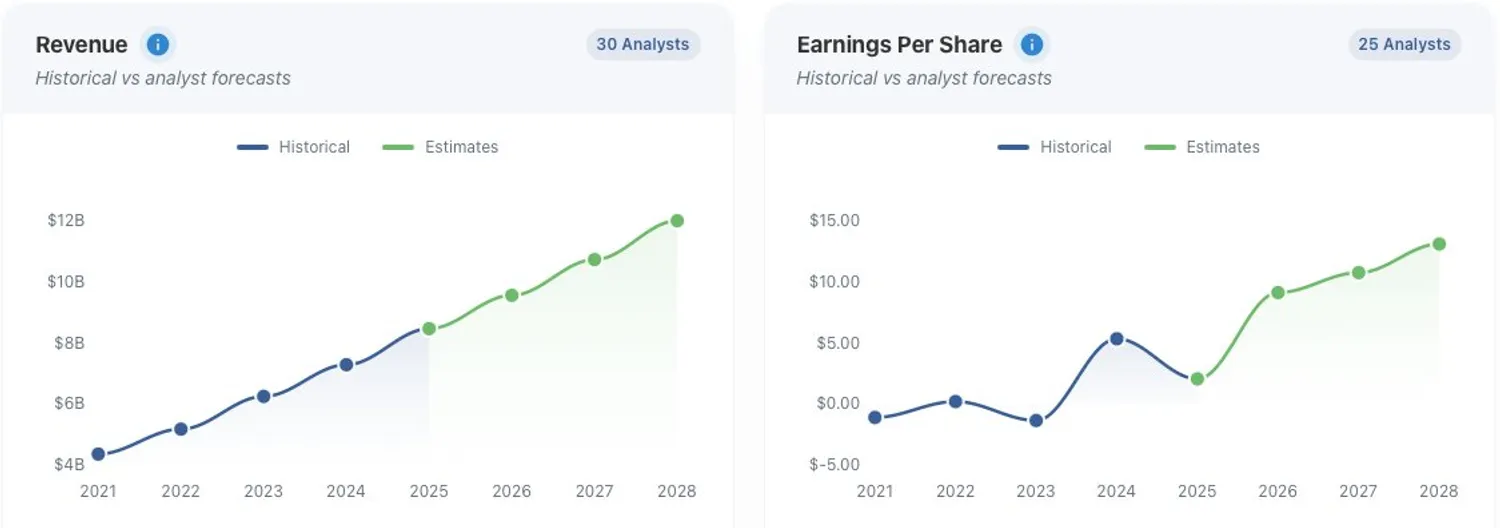 Figure 3. Revenue and EPS growth expectations for Workday.
ServiceNow projects 148% EPS growth, rising from $1.69 to $4.19 in 2026, against 20% revenue growth from $13.28B to $15.96B. However, EPS has remained relatively flat over the past three years, which raises questions about the reliability of this projection and whether the business can deliver such a sharp earnings inflection.
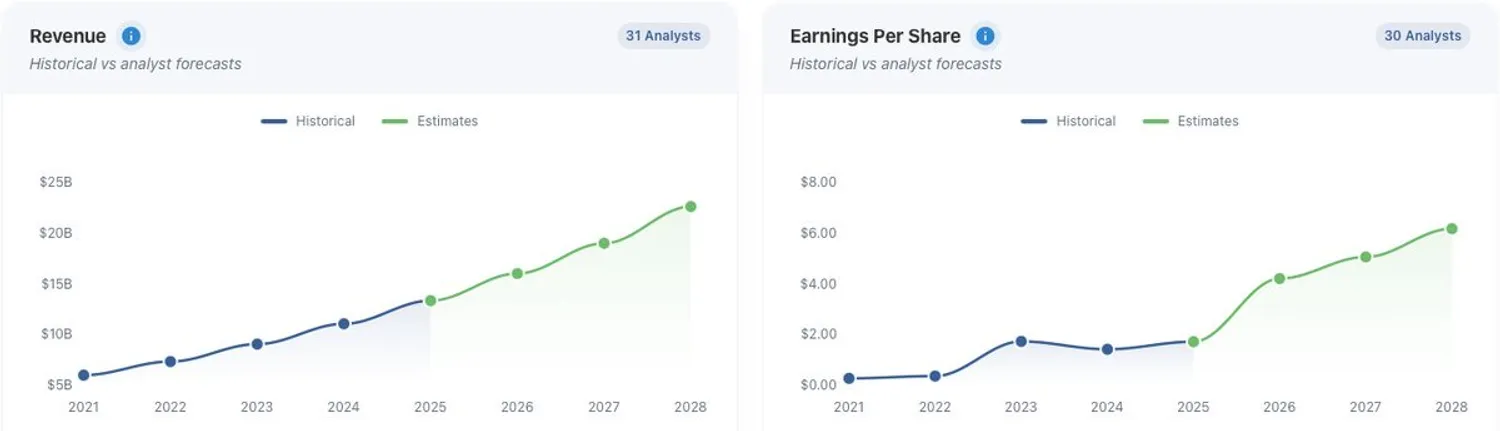 Figure 4. Revenue and EPS growth expectations for ServiceNow.
Salesforce shows steady and consistent revenue growth, climbing from $21B in 2021 to $38B in 2025. For 2026, analysts project revenue of $41.5B with EPS growing 83% from $6.44 to $11.76.
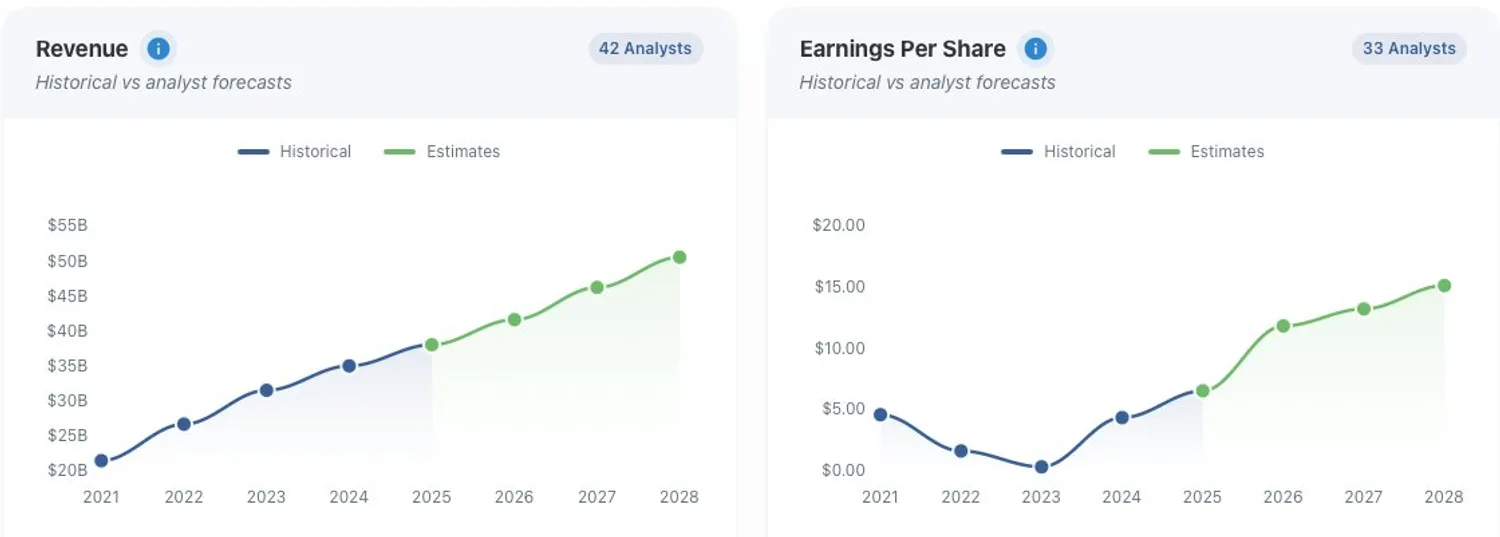 Figure 5. Revenue and EPS growth expectations for Salesforce.
4. Financial Health: Does the Business Support the Thesis?
Analysts can maintain bullish targets for weak businesses, particularly in momentum-driven markets. The framework cross-checks sentiment against fundamental business quality (also from analysts).
| Symbol | Company | Rating | Overall Score | ROE | ROA | DCF | Debt | PE | PB |
|---|---|---|---|---|---|---|---|---|---|
| APP | AppLovin | B | 3 | 5 | 5 | 3 | 1 | 1 | 1 |
| AXON | Axon Enterprise | C+ | 2 | 3 | 3 | 2 | 2 | 1 | 1 |
| CRM | Salesforce | B+ | 3 | 4 | 4 | 4 | 3 | 2 | 2 |
| DASH | DoorDash | B- | 3 | 3 | 4 | 3 | 3 | 1 | 1 |
| HOOD | Robinhood | B- | 3 | 5 | 5 | 2 | 1 | 1 | 1 |
| INTU | Intuit | B | 3 | 4 | 5 | 4 | 2 | 1 | 1 |
| NOW | ServiceNow | B | 3 | 4 | 4 | 5 | 2 | 1 | 1 |
| TTD | The Trade Desk | B+ | 3 | 4 | 4 | 5 | 3 | 1 | 1 |
| WDAY | Workday | B- | 2 | 3 | 3 | 4 | 2 | 1 | 1 |
| XYZ | Block | B+ | 3 | 4 | 4 | 3 | 2 | 3 | 3 |
Table 5. Financial health ratings for the top 10 stocks, sorted alphabetically by symbol.
Most stocks cluster at B to B+ with 3.0 overall scores, which is acceptable but not exceptional. WDAY (B-, 2.0) and AXON (C+, 2.0) stand apart as the weakest, concerning given their high upside rankings. AppLovin and Robinhood show perfect profitability (5.0 ROE and ROA) but problematic debt positions (1.0). None combine exceptional upside with exceptional quality.
Interestingly, most stocks in this list receive low valuation multiple scores despite strong growth expectations and price targets set above current levels. Analysts are effectively signalling overvaluation and upside at the same time, leaving investors to reconcile the gap themselves.
5. Coverage Depth: How Reliable Is the Consensus?
Coverage ranges from 18 analysts (Axon) to 96 (Salesforce). Axon's 18 analysts and Robinhood's 23 analysts represent thinner consensus bases. Workday's 79, NOW's 67, and The Trade Desk's 46 analysts mean that the weak conviction signals in those stocks reflect genuine, well-researched hesitation rather than small sample noise.
What the Framework Reveals
Applying all five components together produces a materially different picture than the raw upside screen.
| Symbol | Original Rank | New Rank | Buy Rating | Price Target | Earnings Growth | Financial Health | Analyst Coverage | Overall Sentiment |
|---|---|---|---|---|---|---|---|---|
| APP | 5 | 1 | 3.8 | 4.5 | 5.0 | 3.4 | 4.6 | 4.3 |
| DASH | 9 | 2 | 3.7 | 3.8 | 4.5 | 3.4 | 5.0 | 4.0 |
| NOW | 3 | 3 | 3.9 | 3.5 | 4.5 | 3.4 | 5.0 | 4.0 |
| HOOD | 6 | 4 | 3.5 | 4.3 | 4.2 | 3.4 | 4.2 | 3.9 |
| CRM | 10 | 5 | 3.6 | 3.8 | 4.3 | 3.4 | 5.0 | 3.9 |
| INTU | 1 | 6 | 3.6 | 3.3 | 4.3 | 3.4 | 5.0 | 3.8 |
| WDAY | 2 | 7 | 3.0 | 3.4 | 4.3 | 2.6 | 5.0 | 3.6 |
| AXON | 8 | 8 | 3.7 | 3.6 | 4.5 | 2.6 | 3.8 | 3.6 |
| XYZ | 7 | 9 | 3.2 | 4.6 | 2.3 | 3.4 | 4.8 | 3.5 |
| TTD | 4 | 10 | 3.2 | 3.2 | 4.3 | 3.4 | 5.0 | 3.4 |
Table 6. Stocks re-ranked by overall analyst sentiment score across five weighted components. Notable shifts: APP jumps from 5th to 1st; INTU, WDAY, and TTD drop considerably; CRM rises from 10th to 4th.
APP appears to show the strongest genuine conviction. Highest buy rating (88%), rising price targets, strong growth, good financial health, and the broadest agreement across all five components, resulting in an overall score of 4.3.
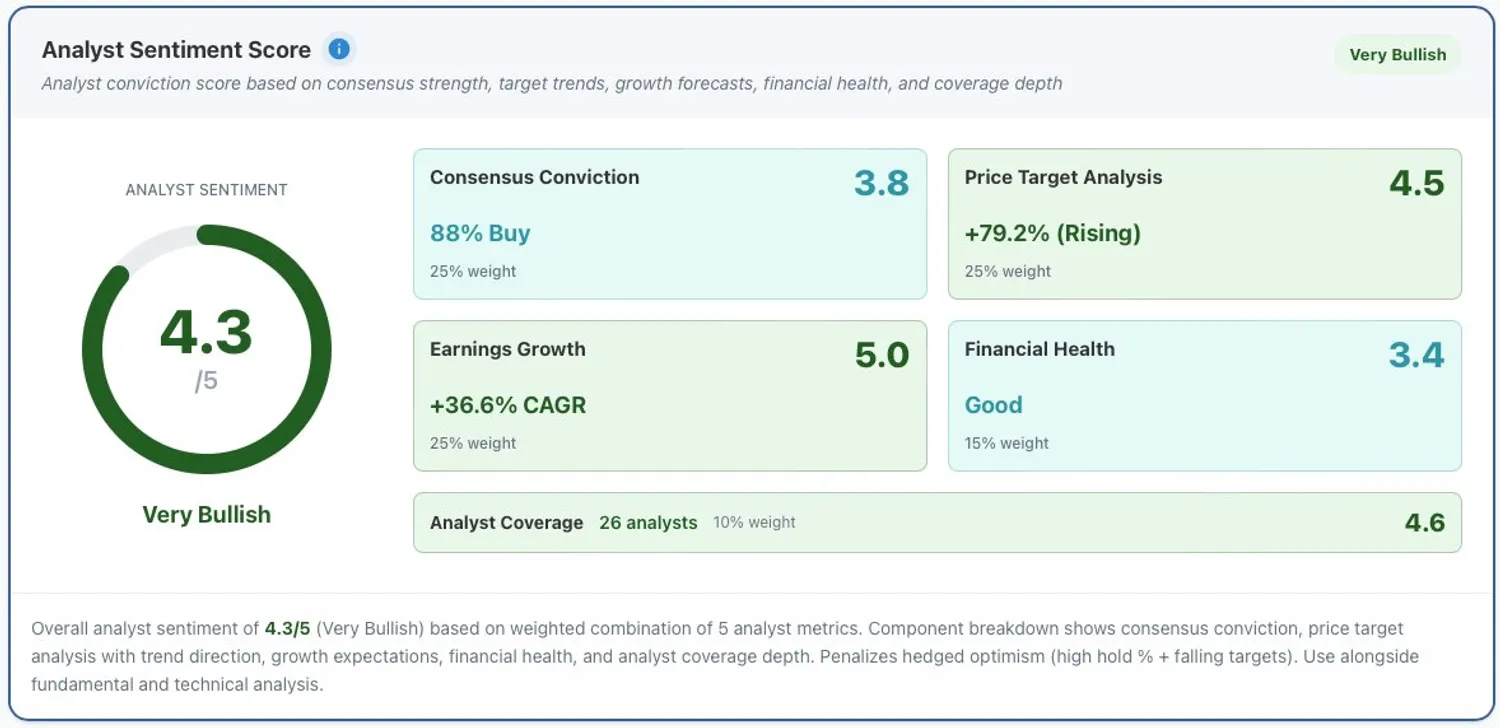 Figure 6. Overall analyst sentiment score for APP: 4.3/5.0.
DASH follows with an overall score of 4.0 out of 5. Analysts demonstrate strong earnings growth expectations, and coverage is broad, with 37 analysts contributing. Consensus conviction is solid at 76% buy ratings, and financial health is considered good. Price targets indicate a 70% upside, though they are falling, adding a note of caution to an otherwise optimistic outlook.
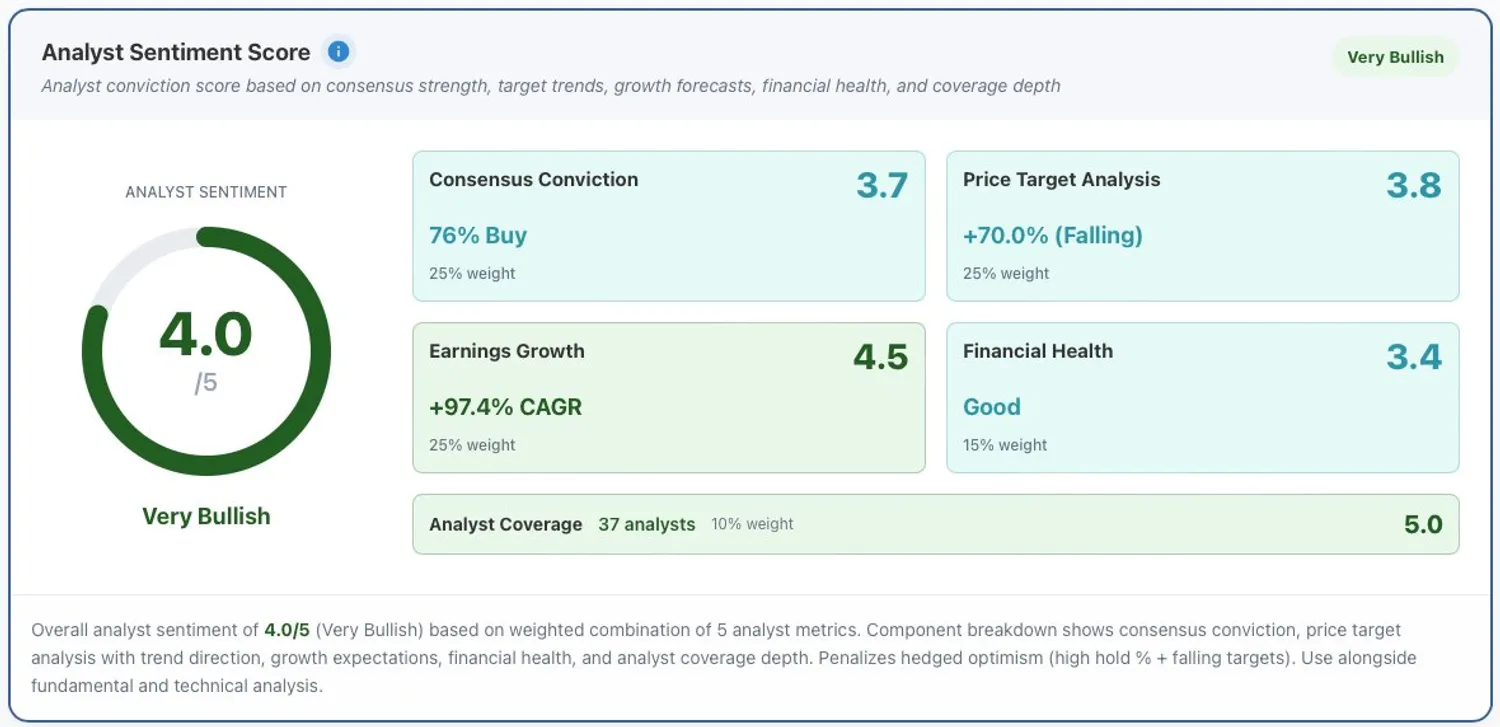 Figure 7. Overall analyst sentiment score for DASH: 4.0/5.0.
ServiceNow is the only stock that maintained its rank, with the second-highest buy rating (87%) though mildly falling targets from $205 to $182 over 12 months.
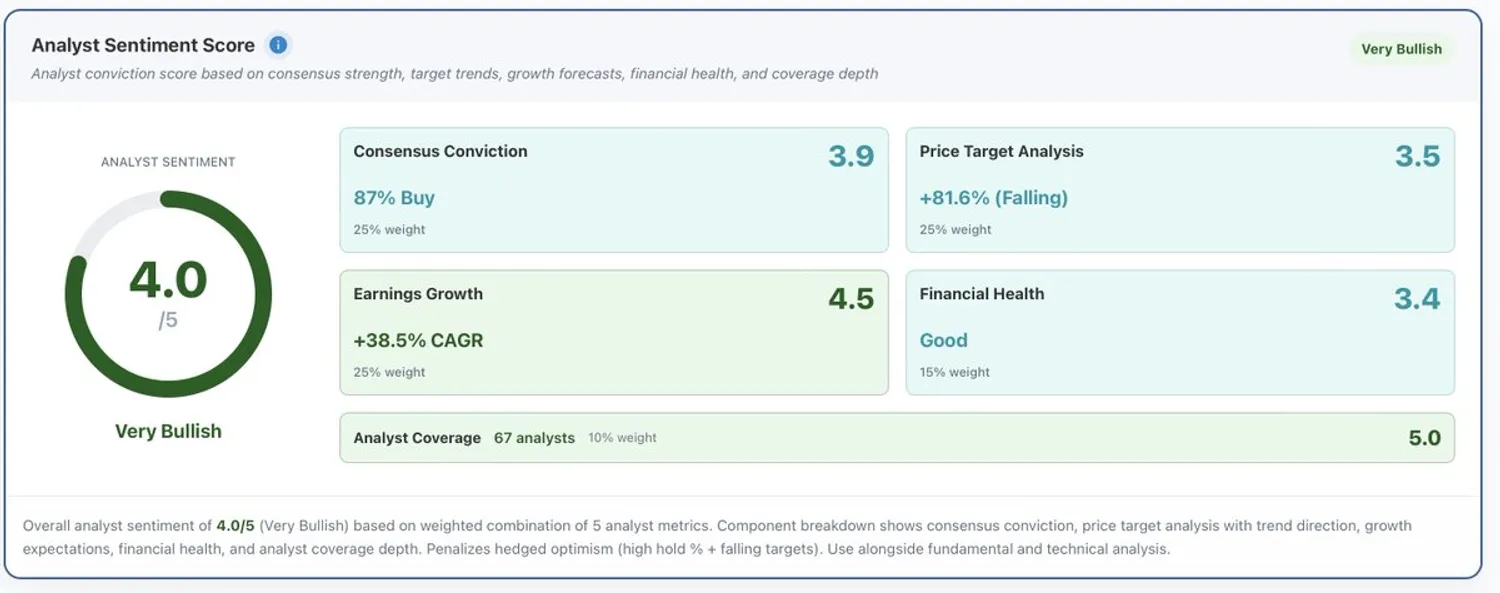 Figure 8. Overall analyst sentiment score for NOW: 4.0/5.0.
HOOD and CRM tie at third with 3.9 out of 5 (Bullish). CRM has the institutional weight, with 96 analysts and a perfect coverage score, plus strong earnings growth, though price targets are falling. HOOD gets there with a cleaner price target picture, +78% upside on a stable trend, offset by thinner coverage (23 analysts) and slightly lower buy conviction at 70%. Both show good financial health overall.
Workday represents a case of hedged optimism, showing the highest upside in the group alongside moderate conviction (59% buy, 38% hold), declining targets, fair financial health (B-, 2.0 score), and a projected strong EPS growth.
Intuit shows a 98% upside, targets have declined from $790 to $624, and buy ratings stand at 76%. The upside largely reflects the recent stock decline rather than heightened analyst enthusiasm.
The Trade Desk and Workday exhibit moderate uncertainty, with hold rates of 35% and 38% respectively. Elevated hold rates are interpreted as cautious positioning, where analysts maintain positive ratings while signalling doubt through hedged stances.
Conclusion
Ten stocks. Unanimous analyst upside. Yet applying the Analyst Sentiment framework tells a more sobering story. For most of these stocks, high upside figures reflect how far prices have fallen, not how confident analysts are in recovery. Falling targets, elevated hold rates, and inconsistent growth projections point to reactive behaviour rather than genuine conviction.
AppLovin is the clearest exception, with rising targets, strong earnings growth, and the highest buy rating in the group. DoorDash and NOW also hold up well under the framework. The rest carry meaningful caveats. Workday and Intuit's upside is largely a function of price declines.
The takeaway is simple: unanimous upside is a starting point, not a conclusion. The five components of the Analyst Sentiment framework reveal what the headline number hides, and for most stocks here, what it hides is caution.
A Final Note on Scope
Everything discussed here reflects a single dimension of analysis: Analyst Sentiment. It is one of five dimensions in our full framework, alongside Quality, Peer Comparison, Valuation, and Holdings. A low sentiment score does not make a stock a sell, and a high sentiment score does not make it a buy. AppLovin scoring 4.3 on sentiment tells you analysts are genuinely enthusiastic: it says nothing about whether the stock is fairly valued, how it stacks up against peers, or whether institutional holders are building or exiting positions. We put AppLovin through all five dimensions in a separate case study. Conversely, Workday's weaker sentiment score may look very different once quality metrics and valuation are factored in.
Analyst sentiment is only one of the five dimensions of our 5D framework. It is not the conclusion. Investors who act on a single dimension (in either direction) are working with an incomplete picture. The full story only emerges when all five dimensions are examined together.
You can explore Analyst Sentiment for any S&P 1500 stock on our platform: APP · INTU · WDAY · NOW · TTD · HOOD · XYZ · AXON · DASH · CRM
This article was originally published on X on 18 February 2026. All data, prices, and results reflect information available at the time of publication. We have retained the original publication date on this platform for consistency.
Data as of 15 February 2026.
Update (20 February 2026): Our data provider corrected a split-adjustment error affecting ServiceNow's historical price targets. The original article stated that targets collapsed by 73%, from $685 to $182. The correct figures show that targets declined from $205.35 to $182 (an 11% decline over 12 months). While less dramatic than initially reported, the pattern remains: targets are falling while buy ratings stay elevated at 87%. The article has been updated to reflect the corrected data.
This analysis is for educational purposes only and does not constitute investment advice. All price targets, investment ratings, and financial assessments are sourced from independent equity research analysts and rating agencies. These represent third-party opinions and professional forecasts, not our recommendations. The author may hold positions in mentioned securities. Always consult with qualified financial professionals before making investment decisions.