
AppLovin: When a Growth Machine Meets Market Reality
AppLovin sits at the intersection of exceptional business performance and mounting investor anxiety. We analyse it through our 5D Framework to decode what smart money is really thinking.
AppLovin Corporation (APP) sits at the intersection of mobile advertising and artificial intelligence, and right now, at the intersection of exceptional business performance and mounting investor anxiety. At $434.77 with a $147 billion market cap, the stock is down roughly 40% from its December highs, making it one of the market's most intriguing valuation puzzles.
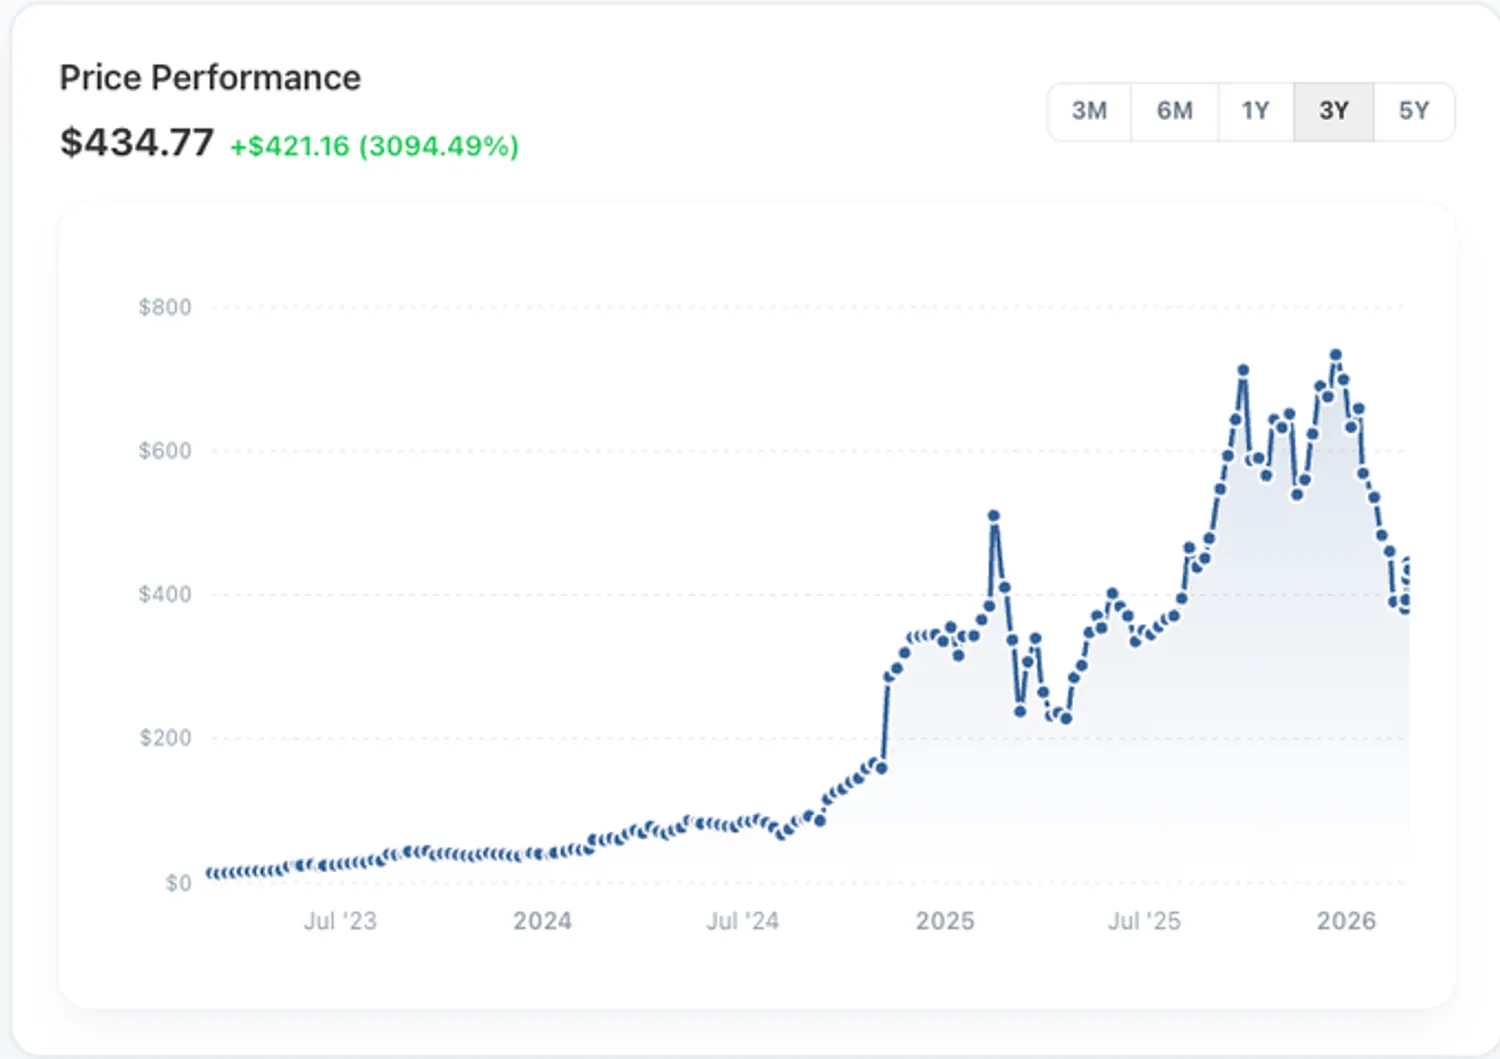 Figure 1. AppLovin's 3-year price chart shows a meteoric rise from under $20 to a peak near $734, followed by a 40% drawdown.
For the unfamiliar, AppLovin operates as an AI-powered middleman in the mobile app economy. On one side, app developers pay APP to find users who are likely to download and spend money in their apps. On the other, app publishers use APP's platform to auction off their ad inventory to the highest bidder in real time. The company's AI engine, AXON, sits at the centre of both transactions, predicting which user will respond to which ad, optimising outcomes for both sides, and taking a cut of the ad spend flowing through the platform. Think of it as an automated toll booth between advertisers and publishers, where the toll gets more valuable as the AI gets smarter.
The business has been firing on all cylinders: a 60.8% net profit margin, 156% return on equity, and $3.9 billion in free cash flow. So why the sell-off? A confluence of headwinds. An active SEC investigation into the company's data collection practices. Short-seller reports from Muddy Waters and Culper Research alleging unauthorised tracking of user identifiers across platforms like Meta and Google. Rising competitive pressure from Meta itself. And a new entrant called CloudX that threatens AppLovin's core advantage with an SDK-less advertising model. Layer on broader market anxiety around the "AI replaces software" narrative, and you have a stock where sentiment has run well ahead of any operational deterioration.
That tension between strong fundamentals and real emerging risks is exactly what makes AppLovin worth a deep look. We analyse AppLovin through our 5D Framework, examining quality, competitive position, valuation, sentiment, and ownership to decode what smart money is really thinking about this mobile advertising powerhouse.
Quality Analysis: Is This a Strong Business?
AppLovin earns a 3.9 out of 5.0 investment quality score, reflecting a business firing on most cylinders. Here's what's driving that.
Revenue hit $5.5 billion in FY2025, up from $4.7 billion in 2024 and just $483 million in 2018. That trajectory earns a perfect 5.0 growth score. More impressive is how efficiently that revenue converts to profit. Gross margins sit at 87.9%, operating margins at 75.8%, and net profit margins at 60.8%, earning a 4.5 margin efficiency score. These are not typical ad-tech margins; they reflect the operating leverage of an AI-driven software platform with minimal marginal costs.
The returns picture is equally strong. Return on equity stands at 156%, return on invested capital at 60.7%, and return on capital employed at 70.1% (returns overview score: 4.25). Management is converting that profitability into real cash: free cash flow reached $3.9 billion with an income quality ratio of 1.16, meaning the company generates more cash than it reports in earnings. EPS has grown from a loss of $0.52 in 2022 to $9.84 in 2025, capturing the per-share fundamentals score of 4.5.
However, two areas warrant attention. Asset turnover of 0.76 and days of sales outstanding at 121 days suggest the company isn't yet wringing maximum efficiency from its asset base (operational efficiency score: 3.25). On the balance sheet, debt-to-equity of 1.66 and $3.5 billion in total debt are manageable given the interest coverage ratio of 20x and a net debt-to-EBITDA of just 0.24, but they do introduce constraints that keep the leverage score at 3.5.
The pattern reveals a company in rapid scaling mode with exceptional profitability but some growing pains in operational optimisation.
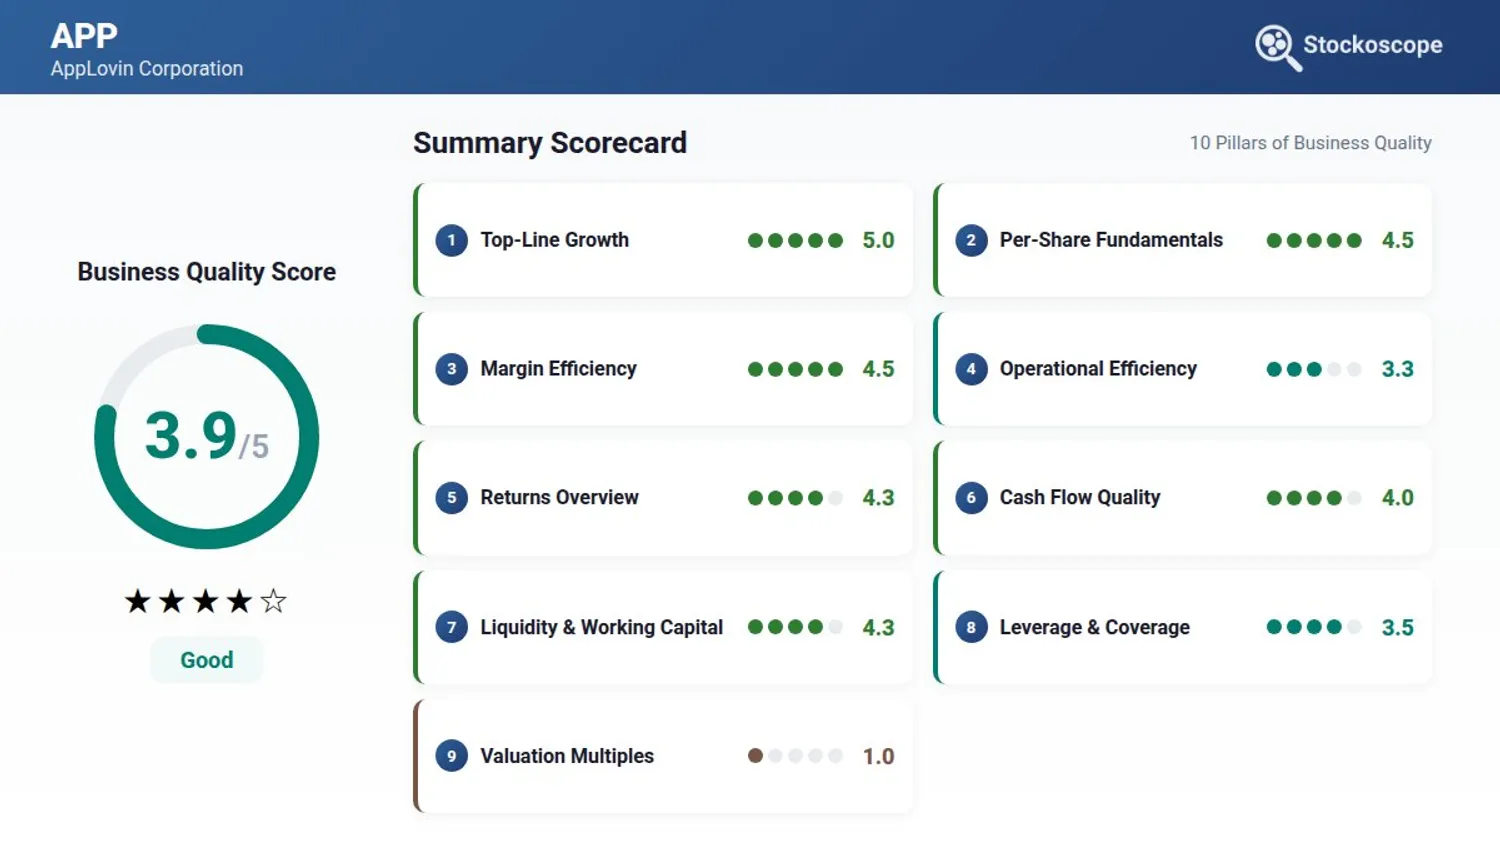 Figure 2. AppLovin earns a 3.9/5.0 investment quality score. Standouts include a perfect 5.0 growth score and 4.5 margin efficiency, with leverage and operational efficiency as relative weaknesses. Explore the full breakdown on our Quality Analysis page.
Peer Analysis: How Does It Stack Up?
Note: The peer comparison uses trailing twelve-month (TTM) metrics rather than full-year figures, which accounts for slight differences from the quality analysis above.
AppLovin ranks in the 72nd percentile among 87 technology sector peers with an overall peer score of 4.1, indicating strong competitive positioning. The company's standout advantage lies in profitability excellence, ranking in the 100th percentile for net profit margin at 57.4%, meaning literally no peer matches AppLovin's ability to convert revenue into profit.
Return on equity at 249.2% places AppLovin in the 98th percentile, demonstrating exceptional capital efficiency versus competitors. Revenue growth of 46% trailing twelve months ranks in the 95th percentile, confirming AppLovin isn't sacrificing growth for profitability; it's achieving both simultaneously.
These metrics reveal a company with significant competitive advantages, likely stemming from its AI-driven advertising platform and network effects in mobile app monetization. When a business consistently outperforms 95% of peers on growth while maintaining best-in-class profitability, it suggests genuine competitive moats rather than temporary market conditions.
The 72nd percentile overall ranking, despite dominance in growth and profitability, is dragged down by a few dimensions. Valuation multiples score just 1.5 out of 5.0 against peers, reflecting the premium the market has placed on AppLovin's growth (more on it in the next section). Leverage and coverage scores 2.5, with a debt-to-equity ratio of 1.66 and debt-to-capital ratio of 62.4%, meaning the business is more leveraged than most peers. And operational efficiency at 3.5 echoes the same asset turnover and collections concerns. In other words, the market is already pricing in AppLovin's strengths, and the balance sheet and operations haven't quite caught up to the profitability story.
The strengthening fundamentals versus peers indicate AppLovin is widening its competitive advantages rather than merely riding sector tailwinds.
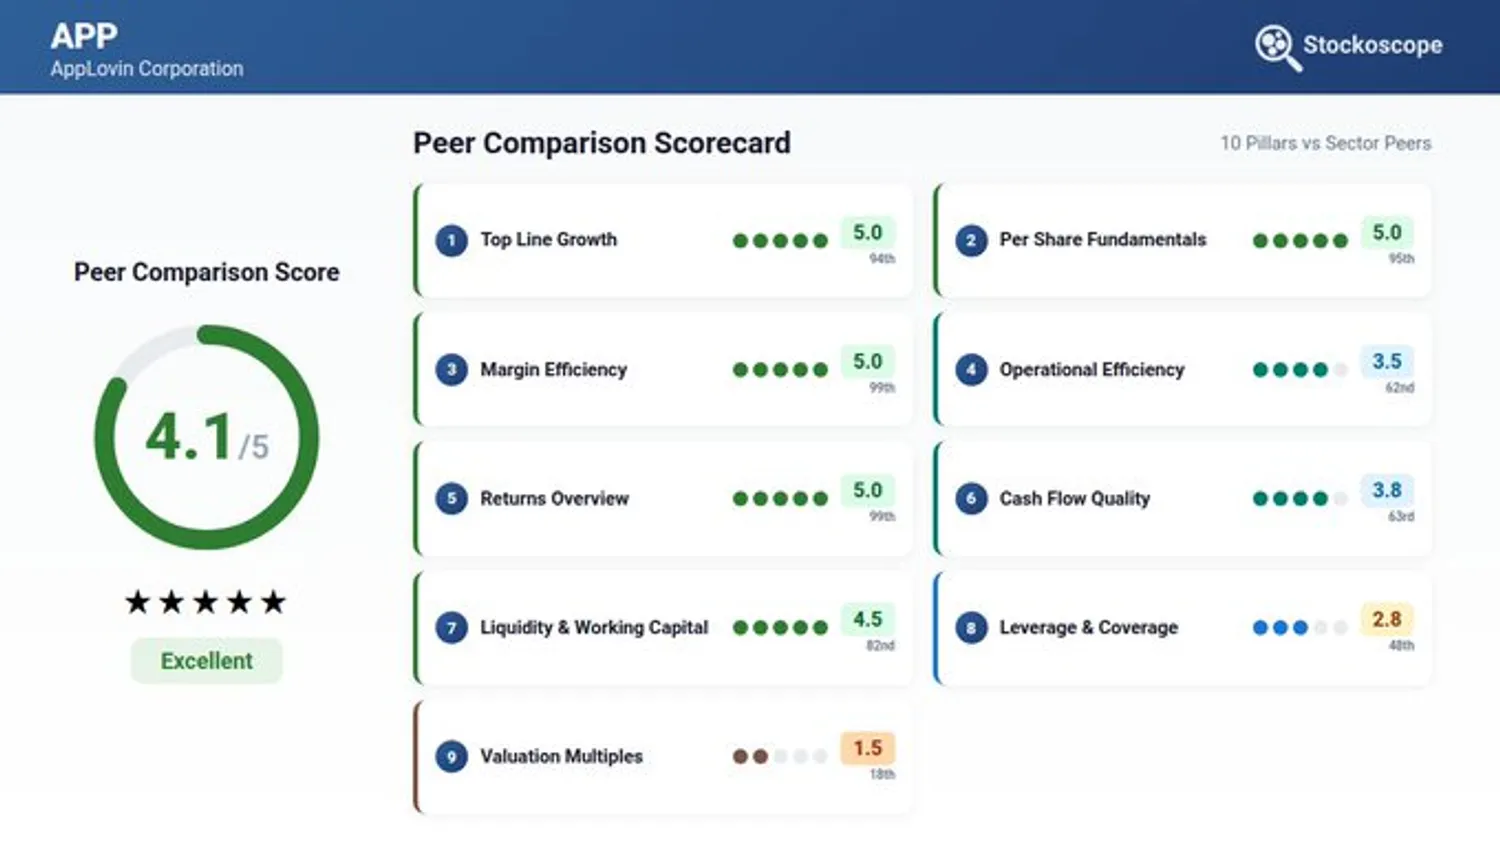 Figure 3. AppLovin ranks in the 72nd percentile among 87 technology sector peers. Best-in-class profitability and top-decile growth are offset by premium valuation multiples and above-average leverage. Full breakdown on our Peer Comparison page.
Valuation Analysis: What's It Worth?
Here lies AppLovin's central investment tension. Our DCF analysis yields an intrinsic value of $409.81 per share versus the current price of $434.77, suggesting 5.7% downside based on fundamental valuation. The DCF assumptions appear reasonable with an 8% discount rate and 2% terminal growth rate, though the 26% Phase 1 revenue growth rate seems conservative given current 46% growth.
The valuation multiples tell a more complex story. AppLovin trades at 44.1x P/E, placing it in just the 32nd percentile among tech peers, suggesting 68% of peers have better valuations on an earnings basis. EV/EBITDA sits at 35.5x, a more meaningful measure for software businesses since it strips out the effects of capital structure and taxes. The EV/Sales multiple of 25.5x ranks in the 1st percentile, indicating AppLovin commands the highest revenue multiple in its peer group and 99% of peers have better valuations. Free cash flow yield of 2.7% rounds out the picture, modest for a company generating $3.9 billion in cash, but reflecting the premium baked into the share price.
The 40% drawdown from highs has compressed some of these multiples, but even after the sell-off, AppLovin remains one of the most expensive names in its peer group on a revenue basis. This valuation pattern reveals what the market is pricing in: expectations that AppLovin's exceptional profitability and growth trajectory will continue expanding. The market is essentially betting that current margins and growth rates represent the new baseline, not a peak to revert from.
The divergence between reasonable earnings multiples and extreme revenue multiples suggests investors are paying premium prices for access to AppLovin's profit conversion machine. Whether this premium is justified depends on the sustainability of the company's competitive advantages and margin profile.
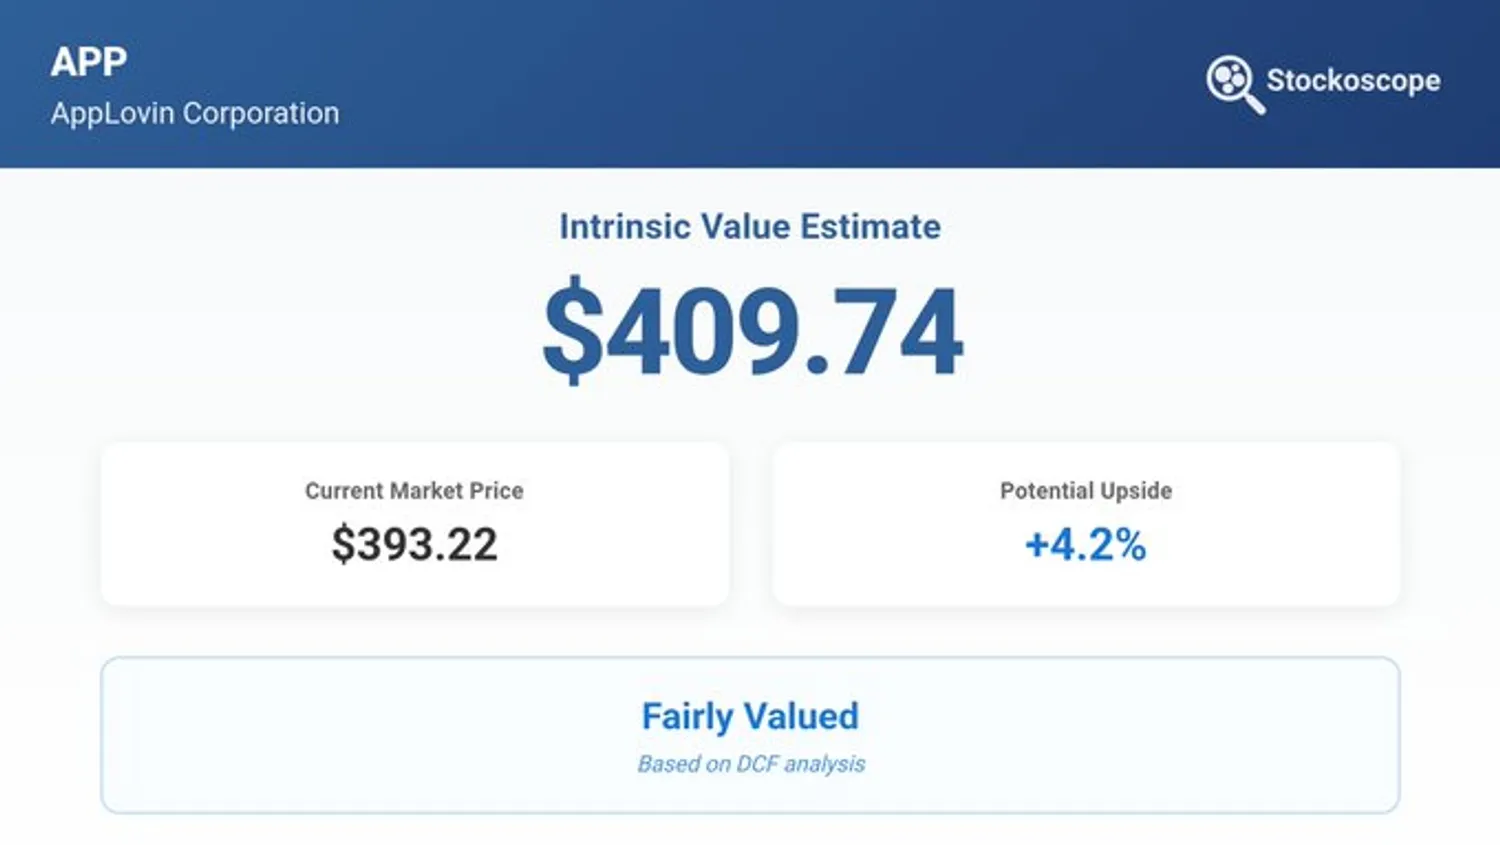 Figure 4. DCF intrinsic value of $409.81 versus current price of $434.77 suggests the stock is trading near fair value rather than at a meaningful discount. Run your own scenarios on our Valuation Analysis page.
Analyst Sentiment: What Does Wall Street Think?
Wall Street demonstrates strong conviction with 88% of 26 analysts rating AppLovin a "Buy," creating a clear consensus recommendation. The price target distribution tells an even more bullish story: a consensus target of $690.93 implies 59% upside from current levels, with the median target at $700 and the high reaching $835.
This price target spread suggests analysts see significant value creation potential, with even the most conservative target at $543 providing 25% upside. The narrow distribution of ratings (only one sell and 2 hold recommendations among 26 analysts) indicates unusual consensus for a high-growth technology stock.
The earnings estimates show what's underpinning that conviction. Across 17 analysts, consensus revenue for 2026 is $7.94 billion, representing 44.8% year-over-year growth, with estimates ranging from $7.79 billion to $8.12 billion. On the earnings side, 15 analysts project EPS of $15.53, a 57.8% jump from FY2025's $9.84, with a range of $14.16 to $17.55. The forward estimates continue climbing through 2028, with revenue approaching $13 billion and EPS nearing $27. In other words, analysts aren't just bullish on where AppLovin is today; they're pricing in a business that roughly doubles over the next three years.
The uniformity of bullish sentiment does raise questions about potential groupthink or whether contrarian perspectives are adequately represented in the analyst community. When nearly everyone agrees, the risk often lies in what the consensus is missing. We applied the same sentiment framework to ten S&P 500 names with unanimous analyst upside in a separate analysis.
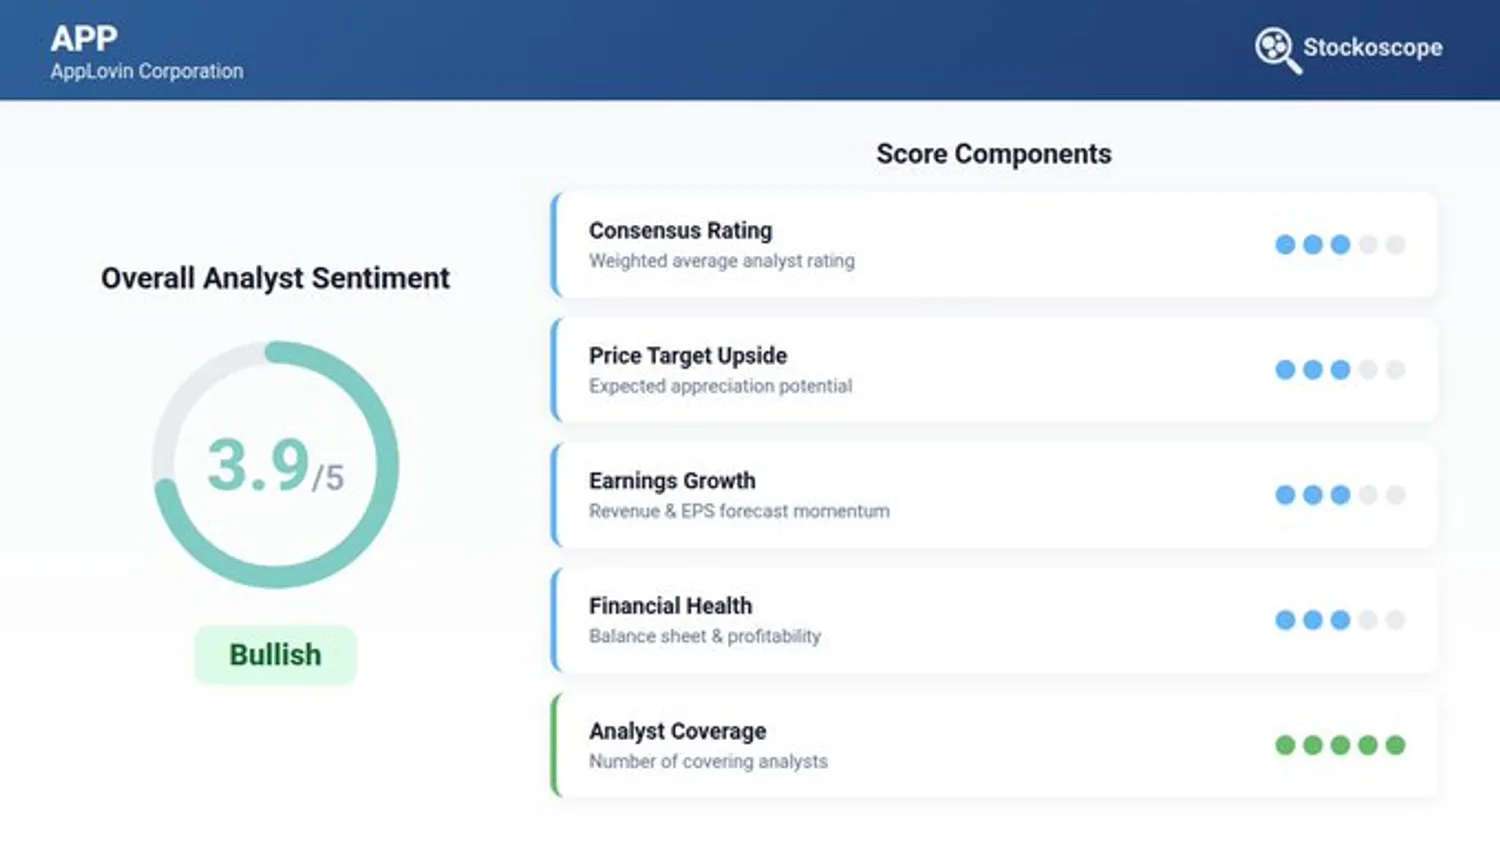 Figure 5. 88% of analysts rate APP a Buy with a consensus price target of $690.93, 59% upside from current levels. Explore the full earnings estimates and rating history on our Analyst Estimates page.
Holdings Activity: What Is Smart Money Doing?
Institutional ownership stands at 70.8%, with $161.4 billion invested across 1,654 institutions, reflecting high institutional interest in AppLovin. Over the past 12 months, net institutional flows have been strongly positive at $95.4 billion, driven by a massive ~$100 billion inflow in Q3 2025 as the stock was surging toward its December highs.
However, the most recent quarter tells a different story. Q4 2025 saw net institutional outflows of $11.1 billion, a notable reversal from the prior quarter's buying spree. While position counts still showed more buyers than sellers (278 new and 921 increased positions versus 553 reduced and 167 closed), the dollar flows reveal that larger institutions were trimming. The count says accumulation; the money says distribution.
Major holders include passive index funds like Vanguard (7.43%), BlackRock (7.15%), and State Street (3.52%), meaning a significant portion of institutional ownership reflects indexing rather than active conviction. That said, active managers like FMR LLC (Fidelity) maintaining a 3.87% stake signals genuine belief in the thesis.
On the insider front, the pattern has been consistent net selling across every quarter. Q4 2025 saw 396,917 shares disposed versus 84,190 acquired, and the trend holds across 2025. The recent February 2026 transactions from the CEO, CFO, CTO, and others were F-InKind (shares withheld for tax on vesting), not voluntary sales, so those shouldn't be read as bearish signals. The actual open market sales over the past 90 days were more modest, roughly 11,600 shares from the CTO, a director, and the corporate secretary, notably at prices between $525 and $693, well above where the stock sits today.
The overall picture: long-term institutional interest remains high, but the most recent signals from both institutions and insiders suggest smart money has been taking some chips off the table. The fact that voluntary insider sales clustered near the highs adds context to the current drawdown.
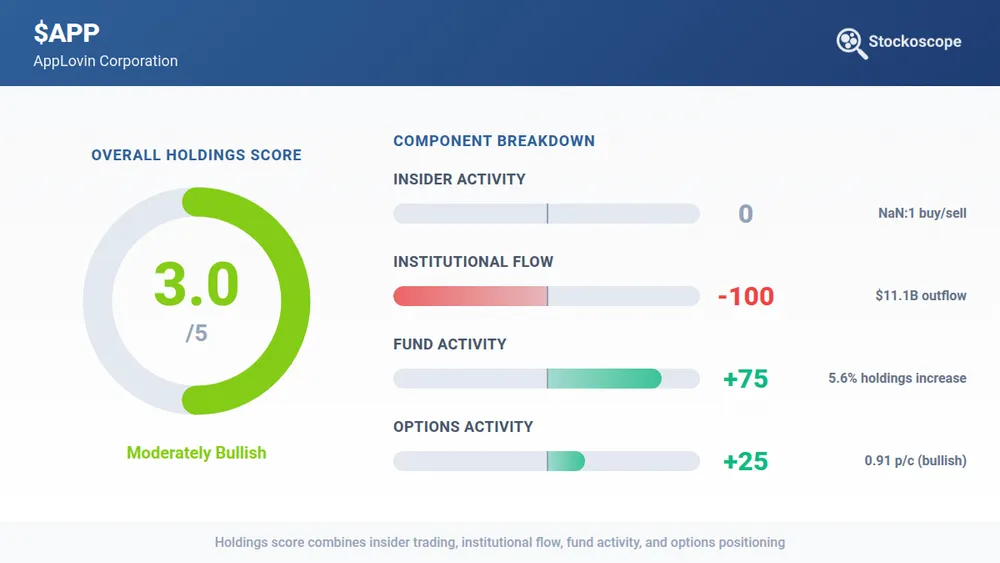 Figure 6. Institutional ownership at 70.8%, but Q4 2025 saw $11.1 billion in net outflows after a massive Q3 buying spree. The count says accumulation; the money says distribution. Full breakdown on our Holdings Analysis page.
Integration & Investment Thesis
The 5D Framework reveals a clear split. Three dimensions align strongly: exceptional business quality (3.9/5.0), dominant peer positioning with best-in-class profitability and growth, and near-unanimous analyst bullishness with consensus targets implying 59% upside. These point to a company with genuine competitive advantages and a business model that is delivering.
The other two dimensions inject caution. The DCF analysis places intrinsic value at $409.81 versus the current price of $434.77, suggesting the stock is trading near fair value rather than at a significant discount. While AppLovin trades at a reasonable 44.1x P/E, it commands the highest EV/Sales multiple in its peer group. On the smart money side, Q4 2025 saw $11.1 billion in net institutional outflows after a massive Q3 buying spree, and insider sales have consistently outpaced acquisitions, with voluntary sales clustering near the stock's highs.
Beyond the framework, there are additional factors worth weighing. The active SEC investigation into data collection practices remains unresolved. Competitive pressure is building from both Meta and CloudX, the latter offering an SDK-less model that challenges AppLovin's core distribution advantage. And the broader "AI replaces software" narrative continues to weigh on sentiment across the sector. These don't contradict the strong fundamentals; they represent the risks that will determine whether the business can sustain them.
Analysts clearly think it can, projecting revenue to nearly double by 2028 and EPS to grow from $9.84 to over $25. If that trajectory holds, the current 40% drawdown from highs would leave a wider gap between price and the analyst-implied trajectory. If the risks materialise, the premium valuation leaves limited room for error.
These dynamics carry different implications depending on time horizon and volatility tolerance: fundamentals would need time to grow into valuations, and at current pricing the margin between price and our DCF intrinsic-value estimate is limited.
You can run the same 5D Framework analysis on any S&P 1500 stock, starting with Quality, Peers, Valuation, Analysts, and Holdings.
This article was originally published on X on 28 February 2026. We have retained the original publication date on this platform for consistency. All data, prices, and results reflect information available at the time of publication.
This analysis is for informational purposes only and should not be considered personalised investment advice.