
This Chart Changed How I Think About Costco
Costco makes $275 billion in annual revenue. But it's not until you see where that money actually goes that the real business model becomes impossible to miss.
Costco makes $275 billion in annual revenue. To put that in context: Microsoft, one of the most valuable companies ever built, did $281.7 billion in 2025. Costco, a warehouse full of bulk toilet paper and $5 rotisserie chickens, sits in the same revenue neighbourhood as the company behind Windows, Azure, and Xbox.
That number barely registers until you look at it a different way. And once you do, you can't unsee it.
A Different Way to Look at a Business
Most people know bar charts and pie charts. But there's another type called a Sankey diagram that does something neither of those can: it shows you where money goes, not just how much there is.
Imagine money as water flowing through pipes. The diagram starts on the left with a wide stream (total revenue) and splits into smaller flows as costs are paid and taxes are taken, with whatever's left trickling out on the right as profit. The width of each flow is proportional to the dollar amount. Big cost? Wide pipe. Small profit? Thin trickle.
Applied to a company's income statement, it becomes almost uncomfortably revealing. You can't hide behind a number in a Sankey. You can see where the money disappears. Our guide Reading the Money Map walks through how to read one in detail.
Following the Money
Costco's FY2025 total revenue: $275.24 billion. A wide, imposing stream on the left.
Almost immediately, the largest flow peels off: Cost of Revenue at $239.89 billion. That's 87.2 cents of every dollar earned, gone before anything else happens. Gross Profit lands at $35.35 billion. Then SG&A expenses take another $24.97 billion. Taxes and interest trim what remains, and the final ribbon on the right is Net Income: $8.1 billion.
On $275 billion of revenue, Costco keeps $8.1 billion. A net margin of 2.9%. That thin green line on the right? That's it.
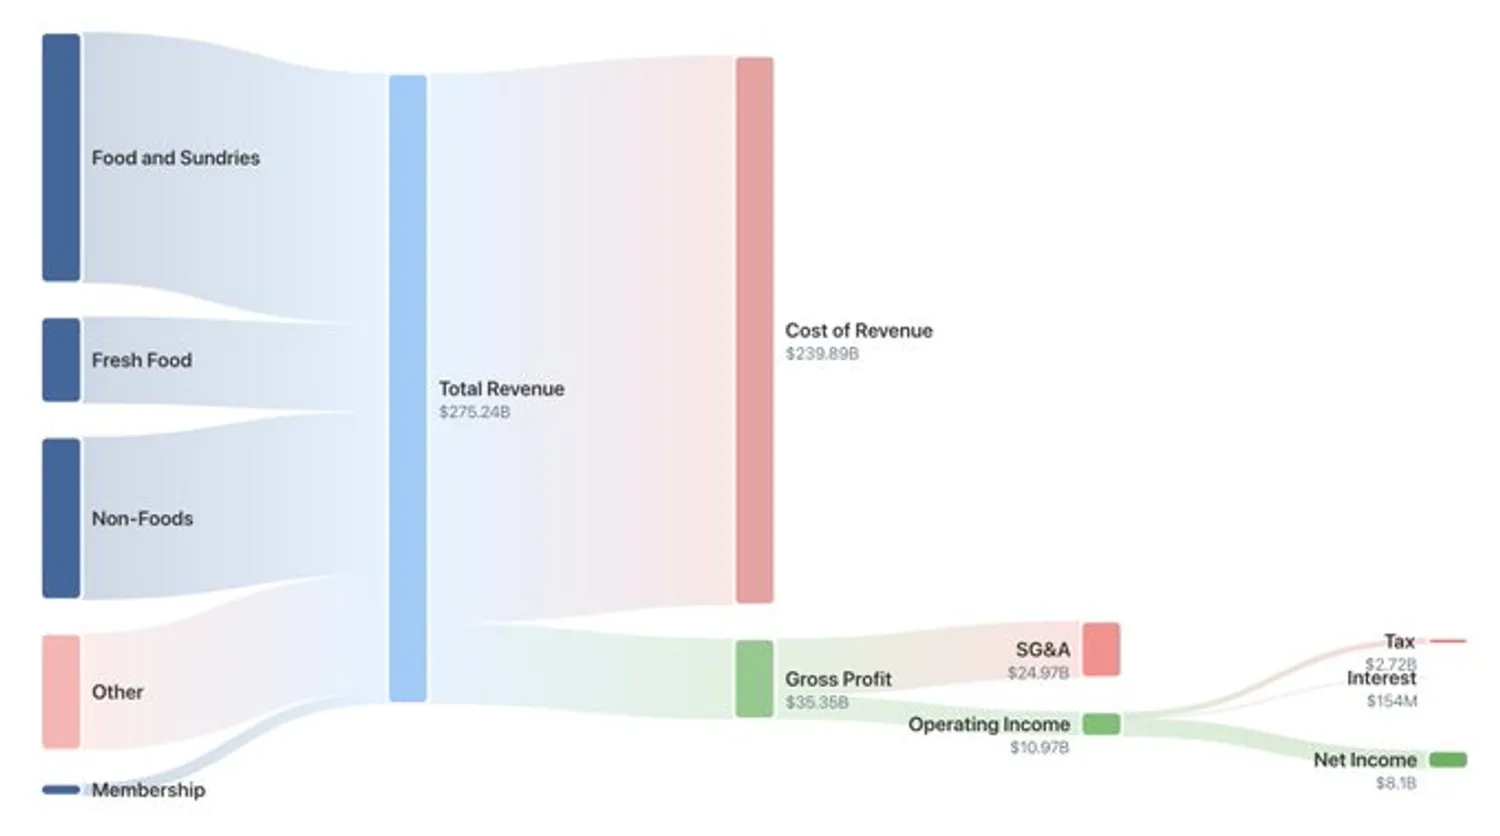 Figure 1. Costco's FY2025 revenue flow: $275.24B enters on the left, 87.2 cents of every dollar drains to cost of revenue, and a thin $8.1B ribbon emerges as net income on the right. The membership fee flow at the bottom (just $5.32B) is nearly as wide as that final profit ribbon.
Membership Fees
Now look at the bottom of the diagram. Tucked at the very bottom left, almost easy to miss, is a small flow labelled Membership: just $5.32 billion, or 1.93% of total revenue.
Now look at that net income ribbon again: $8.1 billion.
Costco's membership fees (the annual charge it collects just to let you through the door) amount to 65.7% of its entire net profit.
That is not a coincidence. That is the business model.
This Isn't a One-Year Fluke
| Year | Net Income | Membership Fees | Membership as % of Net Income |
|---|---|---|---|
| 2025 | $8.10B | $5.32B | 65.70% |
| 2024 | $7.37B | $4.83B | 65.50% |
| 2023 | $6.29B | $4.58B | 72.80% |
| 2022 | $5.84B | $4.22B | 72.30% |
| 2021 | $5.01B | $3.88B | 77.40% |
Table 1. Costco membership fees versus net income, FY2021–FY2025.
In 2021, membership fees covered 77 cents of every dollar of net income. The ratio has eased slightly as Costco has scaled, but the structure has not changed: membership is the profit engine, and everything else is infrastructure.
What Costco Actually Is
Costco is not a retailer that charges membership fees. It is a membership business that operates a retail store to justify the fee.
The Sankey makes it impossible to miss. Numbers in a table are easy to gloss over. But when you watch $239.89 billion drain away and a modest green ribbon emerge on the right, and then notice the membership line is nearly as wide as that ribbon, the insight lands differently.
Sankey diagrams like this one are available for most S&P 1500 companies on our Overview Dashboard.
This article was originally published on X on 19 February 2026. We have retained the original publication date on this platform for consistency. All data, prices, and results reflect information available at the time of publication.
Data sourced from Costco (COST) FY2021–FY2025 annual filings via Financial Modeling Prep API. This article is for informational purposes only and does not constitute financial advice.