
Paycom: When a Self-Disrupting Innovation Breaks the Growth Story
Paycom built a product so effective that it cannibalized its own revenue. Trading at a fraction of historical multiples with minimal debt and 39% EBITDA margins, the 5D Framework reveals whether the market has overcorrected or correctly repriced a decelerating business.
Paycom Software (PAYC) was a 30%-growth compounder trading at premium multiples. Then it built BETI.
BETI (Better Employee Transaction Interface), launched in 2021, lets employees verify their own paychecks before payday, catching errors upstream. The product did exactly what it was supposed to: payroll mistakes dropped, corrective runs disappeared, and client satisfaction improved. But those corrective runs and the ancillary services around them were a meaningful source of recurring revenue. BETI solved a client problem and created a revenue headwind at the same time.
From a peak near $560, the stock has fallen 77% to $125.71. Revenue growth decelerated from 30% to 9%, with guidance for 6-7% in 2026. Yet the company still scores 3.94/5.0 on business quality, generates $408 million in annual free cash flow, and has minimal debt. Paycom scored highest on the value lens across the S&P 500 in March 2026.
This creates a genuinely interesting analytical question. We applied the 5D Framework to see what the data reveals across all five dimensions.
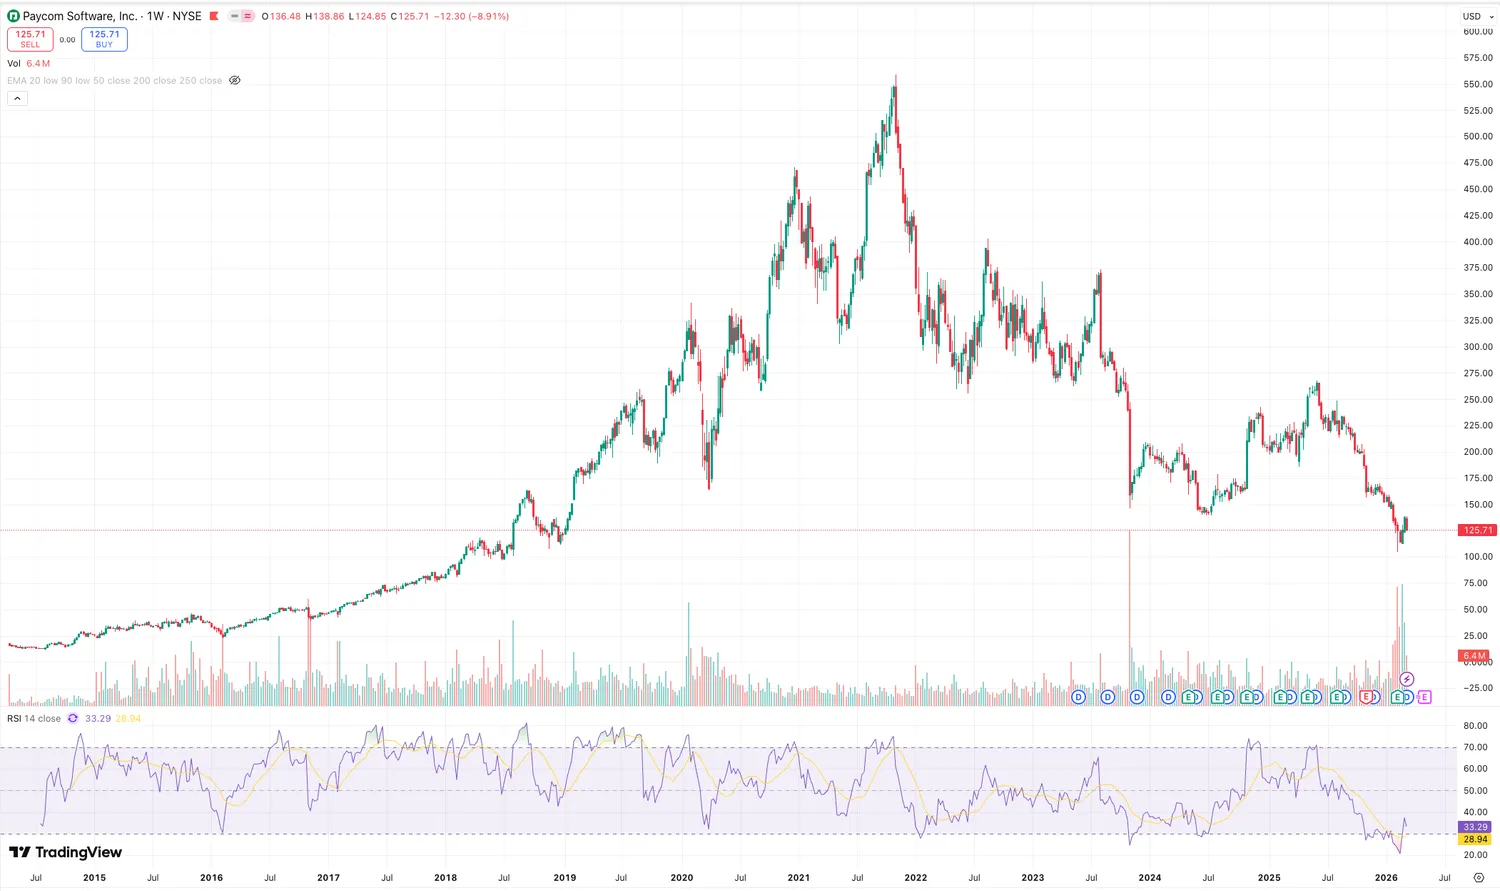 Figure 1. Paycom’s share price has fallen roughly 77%, from a peak near $560 in 2021 to about $126 currently.
Dimension 1: Business Quality - 3.94/5.0
The quality score places Paycom among the top tier of S&P 500 businesses, and several metrics fully support that positioning. The balance sheet is exceptional: debt-to-equity of 0.09 and interest coverage of 167x. In a software industry where acquisitions have loaded many competitors with debt, this financial conservatism stands out. Over the decade, revenue grew 6x from $329 million (2016) to $2.05 billion (2025), EPS expanded from $0.75 to $8.13, and free cash flow reached $408 million. These pillars earn perfect 5.0 scores and the track record justifies them.
Margins remain strong in absolute terms. EBITDA margins of 39% and net margins of 22% reflect genuine pricing power and the high-margin economics of a single-platform HCM business. ROE of 26% and ROIC of 18% demonstrate a business that converts capital into shareholder returns at rates most companies never achieve.
Where the ten-year scores deserve context is on trajectory. Gross margins have come down from 85.3% (2020) to 78.6% (2025). Net income declined from $502 million to $453 million in 2025 despite revenue growing 9%, a reversal from the consistent profit expansion of prior years. Revenue growth has decelerated from 30% (2018-2019, 2022) through 22%, 11%, 9%, and now 6-7% guided for 2026. ROE and ROIC, while strong, have declined from peaks of 41% and 49% earlier in the decade.
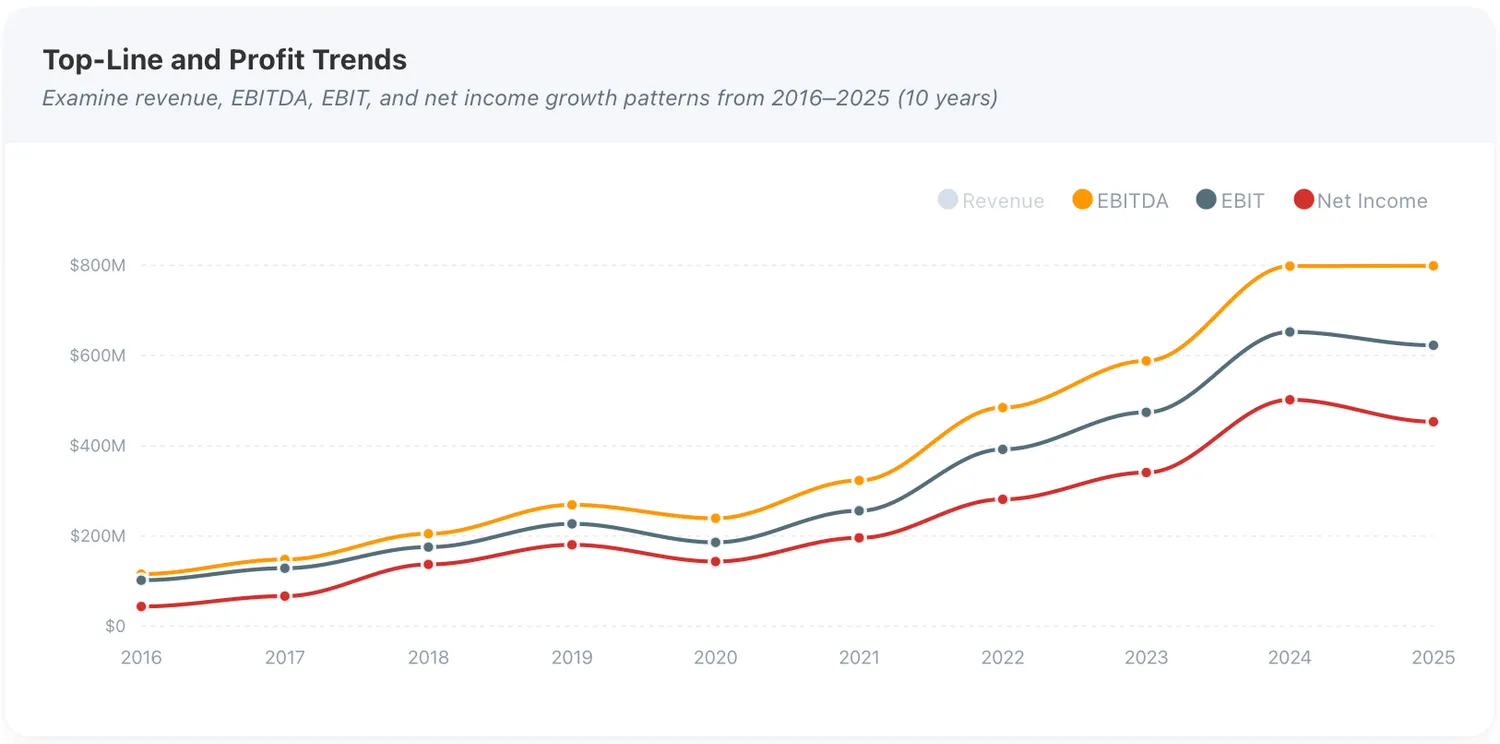 Figure 2. Paycom’s EBITDA, EBIT, and net income grew steadily over the past decade but have recently begun to plateau and, or decline.
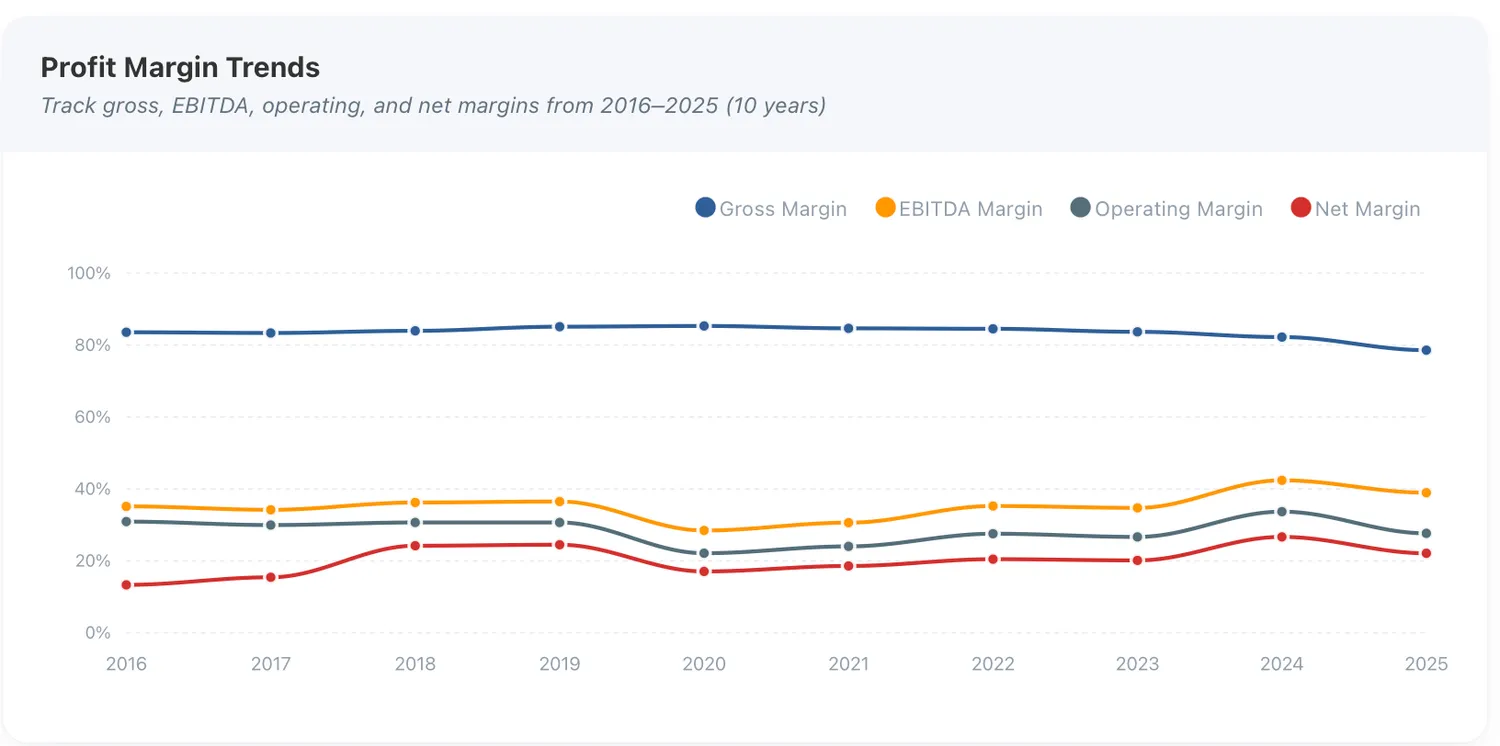 Figure 3. Figure 3. Gross margin has declined from 85.3% in 2020 to 78.6% in 2025.
A 3.94 score accurately reflects a decade of strong compounding and currently strong fundamentals. The underlying data adds the context that growth, margins, and returns are trending lower from their peaks. Both the strength and the trend are part of the picture.
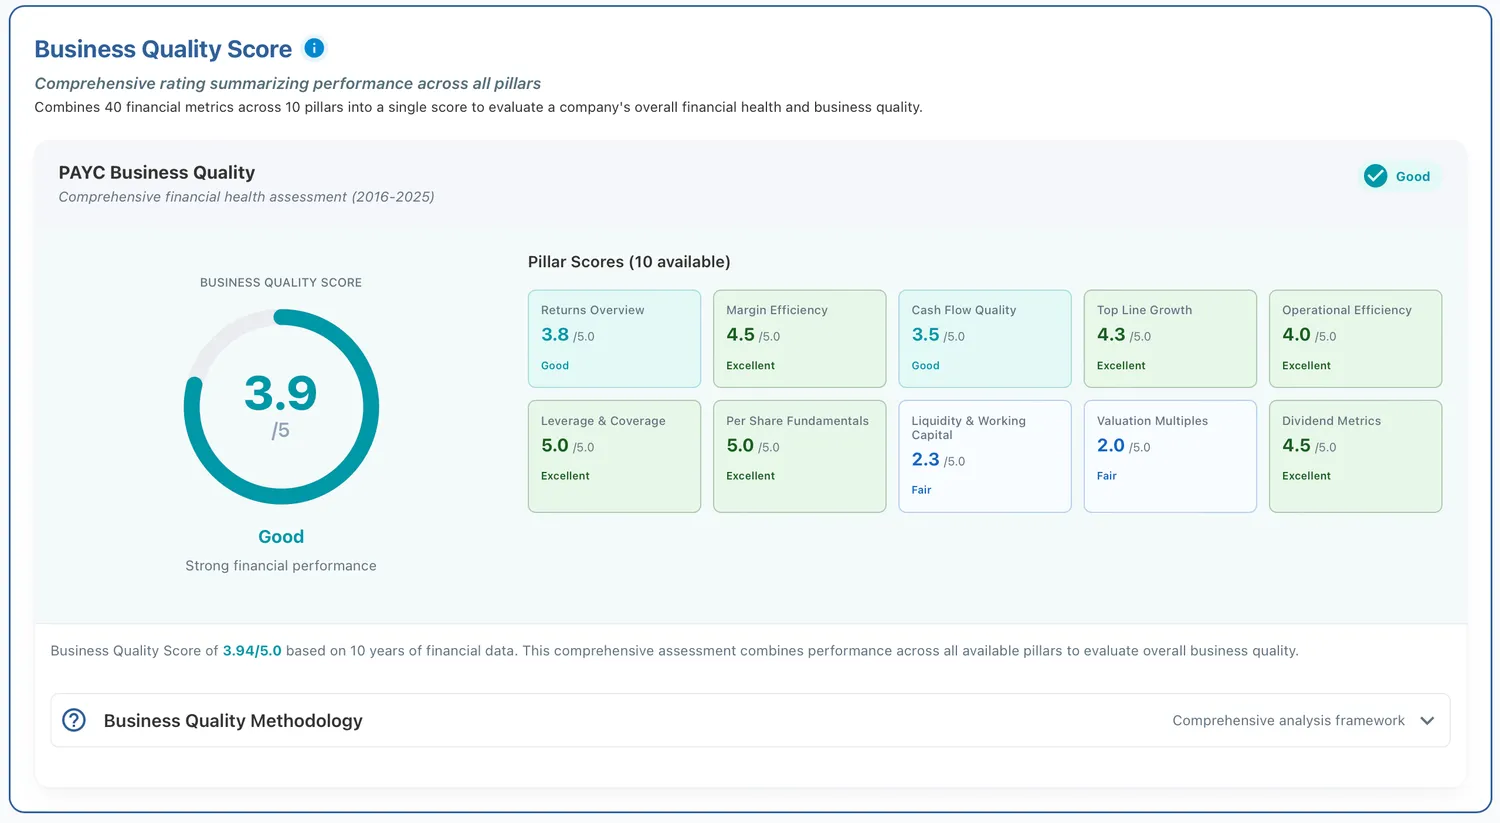 Figure 4. Paycom earns a 3.94/5.0 quality score. Fortress balance sheet and strong per-share fundamentals anchor the profile. Full breakdown on our Quality Analysis page.
Dimension 2: Peer Comparison - 3.45/5.0 (Sector) | 3.18/5.0 (Industry)
Among 80 Technology sector peers and 13 direct Software Application competitors (Workday, Paylocity, Dayforce, and others), Paycom's profile splits into clear strengths and weaknesses.
Financial discipline is where Paycom leads. Debt ratios rank in the 86th to 100th percentile. Gross margins sit at the 87th percentile, ROIC at the 78th. Among its 13 direct industry peers, Paycom ranks 100th percentile on debt, meaning it carries less leverage than every single competitor. On profitability, it ranks above most of its peer group.
Growth is where Paycom lags. Revenue growth ranks in the 0th to 37th percentile against both sector and industry peers. Among direct competitors, it currently sits at the bottom on this metric. In a sector that rewards growth with premium multiples, this gap is significant.
The peer scores of 3.45 (sector) and 3.18 (industry) capture a company that is the most financially conservative and one of the most profitable in its competitive set, but also the slowest growing. Whether this profile represents a temporarily mispriced quality business or a structural shift in competitive positioning is something the peer data alone cannot resolve.
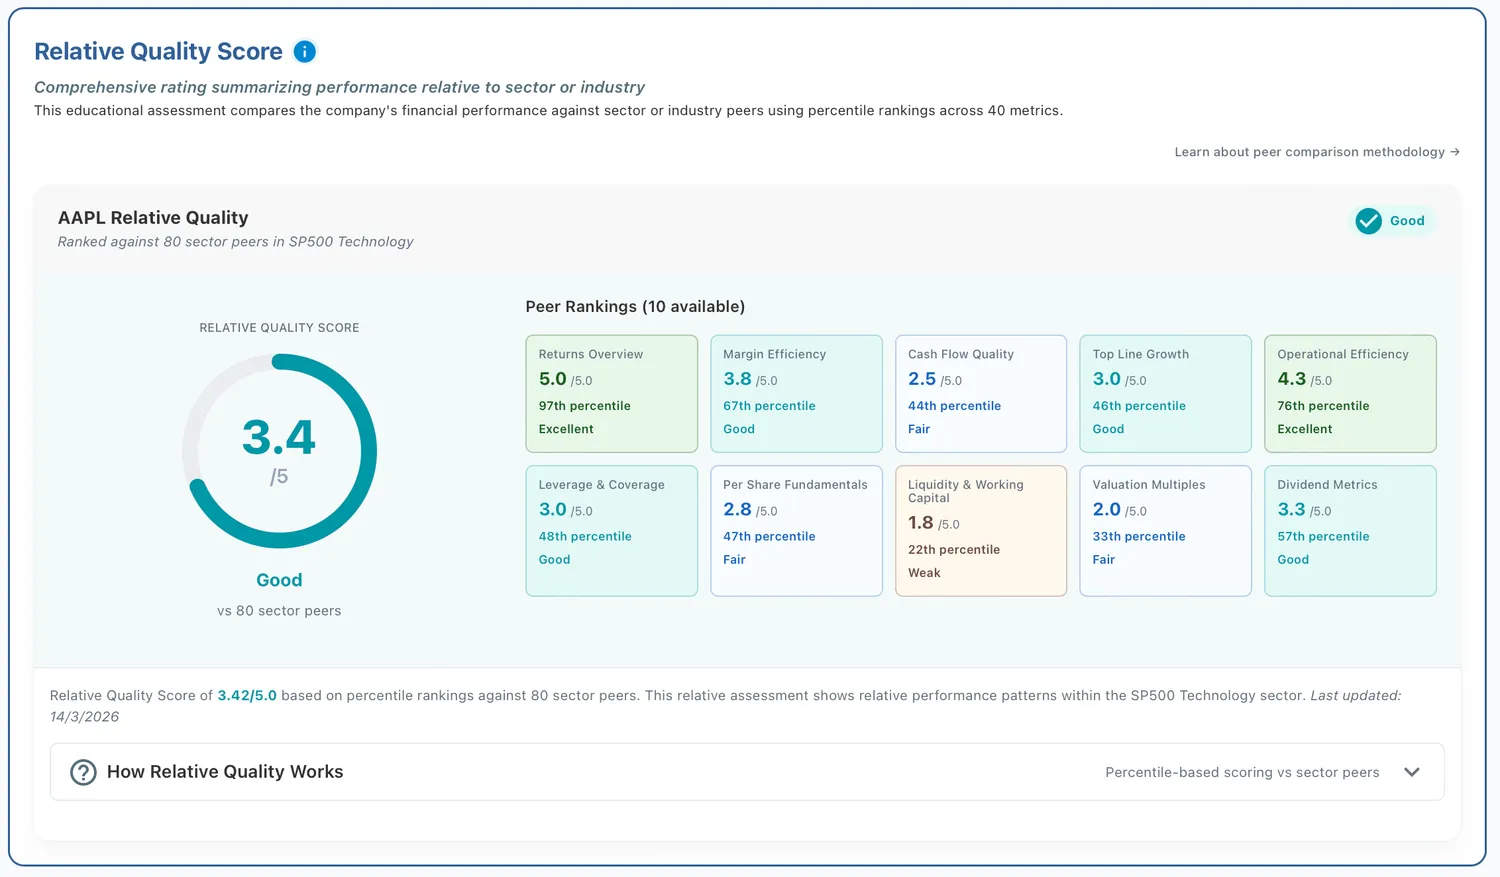 Figure 5. Paycom ranks above the 84th percentile on balance sheet and profitability but lags its peer group on growth. Full breakdown on our Peer Comparison page.
Dimension 3: Valuation - The Numbers from Multiple Angles
Our DCF model produces an intrinsic value of $259.87, implying significant upside from the current $125.71. FMP's independent model corroborates at $278.49. Both use a WACC between 7.6% and 9.2% with growth tapering to a 3-4% terminal rate over a 10-year forecast.
On multiples, Paycom trades at 15.2x trailing P/E and 8.36x EV/EBITDA. Software Application peers typically trade at 30-50x P/E and 20-30x EV/EBITDA, placing Paycom at a 50-70% discount to industry norms. For a company with 39% EBITDA margins, minimal debt, and nearly $2 billion in recurring revenue, this is a notable compression. The 5.88% free cash flow yield and 1.19% dividend yield (initiated in 2023, already grown from $1.12 to $1.52 per share, covered 5.5x by earnings) add further value characteristics.
It is worth noting that the DCF's blended growth rate of 17.75% sits well above management's 6-7% guidance. A growth rate of 7% reduces the intrinsic value to $158.96 and upside to 26.5%. Two alternative models highlight the sensitivity to assumptions: the Dividend Discount Model values Paycom at $56.67 (reflecting its short dividend history) and the Excess Returns model at $85.35 (reflecting the declining return trajectory). The range between $56.67 and $278.49 across four models illustrates how much the valuation conclusion depends on growth expectations.
Multiple frameworks estimate Paycom priced below its intrinsic-value estimate relative to current fundamentals and profitability. How much weight to place on DCF optimism versus the more conservative models depends on one's view of the growth outlook.
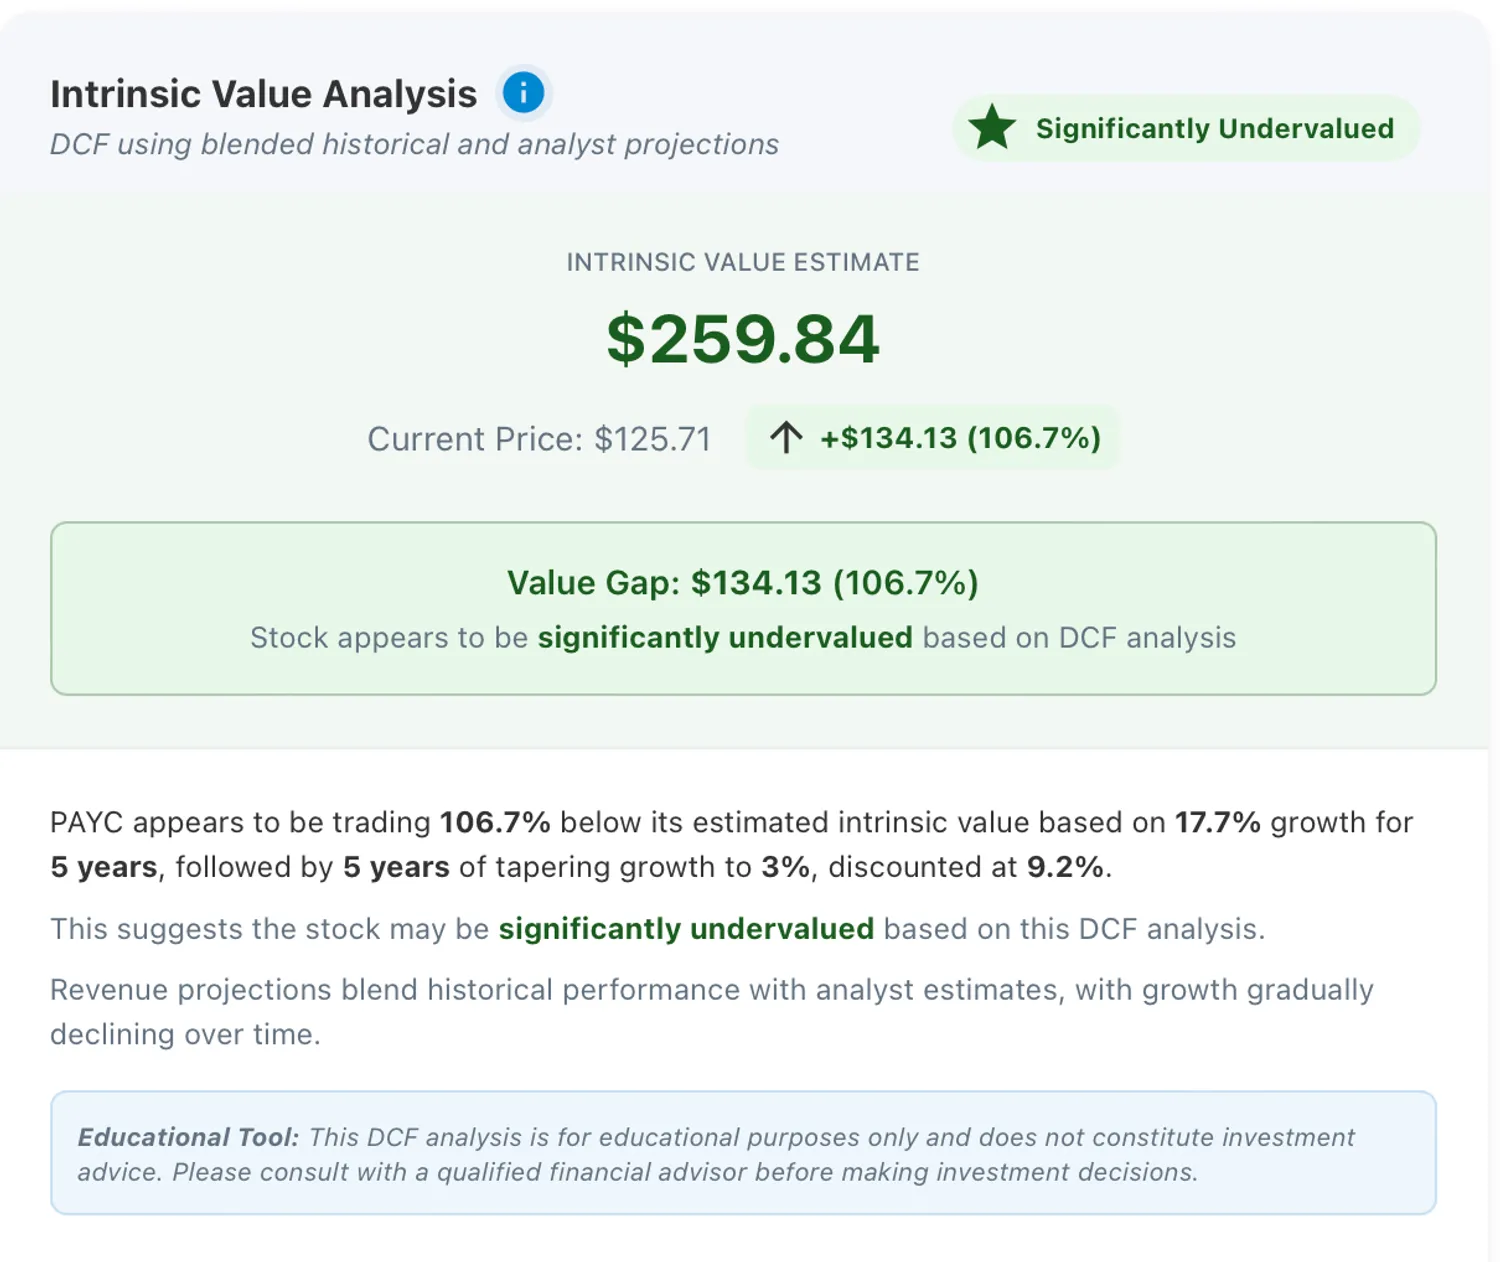 Figure 6. DCF intrinsic value of $259.87 implies 107% upside. The range across multiple valuation models spans from $56 to $278, reflecting high sensitivity to growth assumptions. Run your own scenarios on our Valuation Analysis page.
Dimension 4: Analyst Sentiment - 3.20/5.0
The consensus among 36 analysts is Hold (17 Buy, 18 Hold, 1 Sell), with a price target of $151.82 implying 20.8% upside. The range spans $115 to $210. Every analyst target sits below the DCF intrinsic value, suggesting the Street is anchoring closer to management's 6-7% guidance than to historical regression.
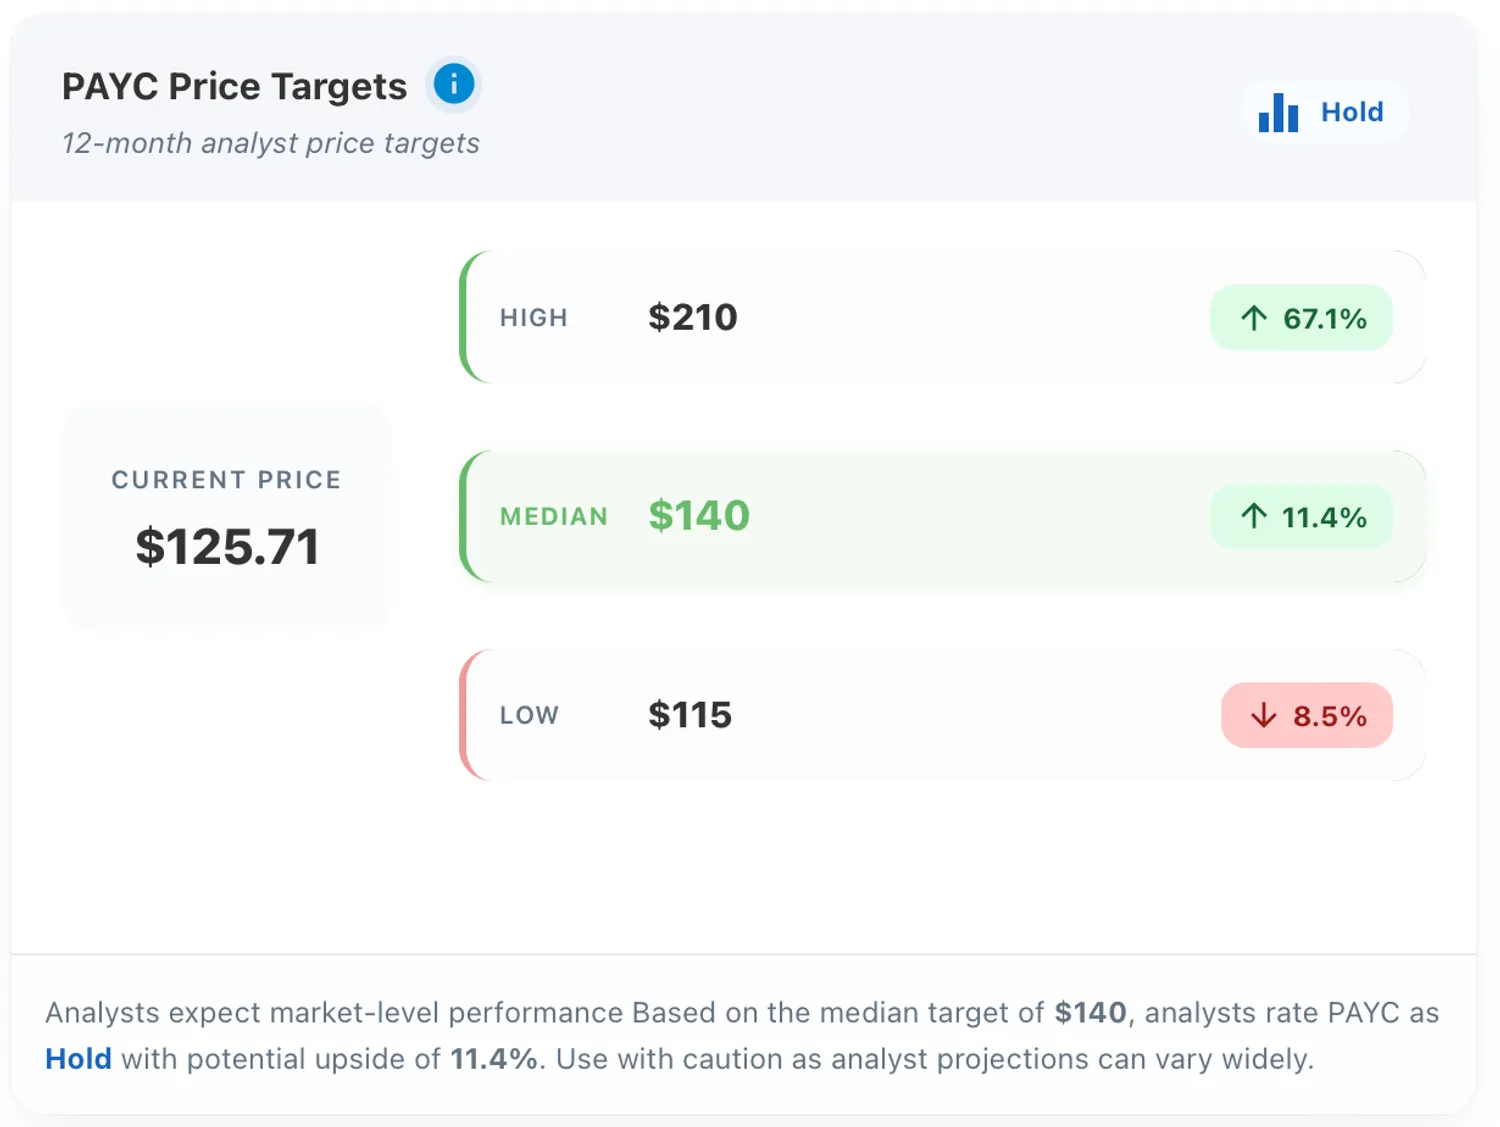 Figure 7. Analyst price targets imply moderate upside, with a median target of $140, about 11% above the current share price.
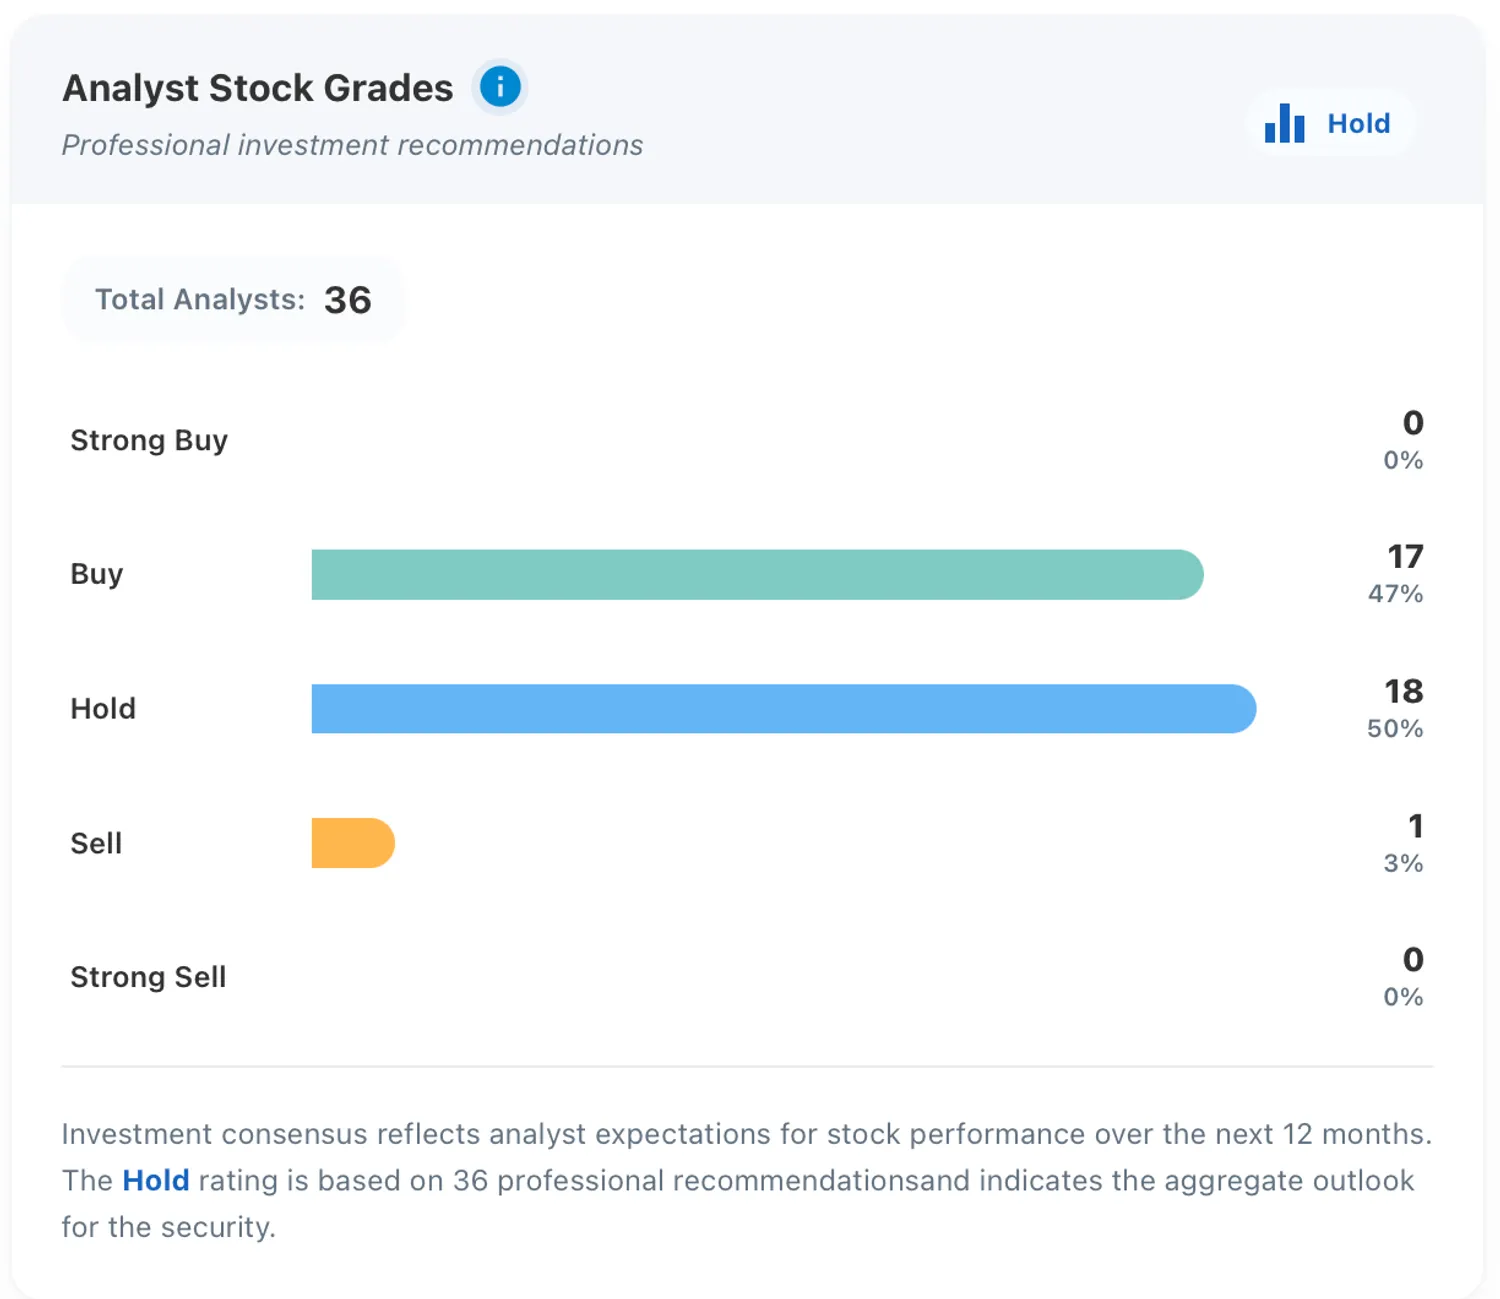 Figure 8. Analyst ratings are mixed, with the consensus at Hold across 36 analysts (17 Buy, 18 Hold, 1 Sell).
Recent actions lean cautious: Citi lowered to $128, Mizuho to $120, Barclays cut from $210 to $185. But forward estimates tell a more constructive story. Analysts project revenue of $2.19 billion in 2026 (7% growth), $2.35 billion in 2027 (7.3%), and $2.54 billion in 2028 (8.1%), with EPS climbing from $9.24 to $12.56 over three years. This suggests the consensus view is stabilization rather than continued deterioration.
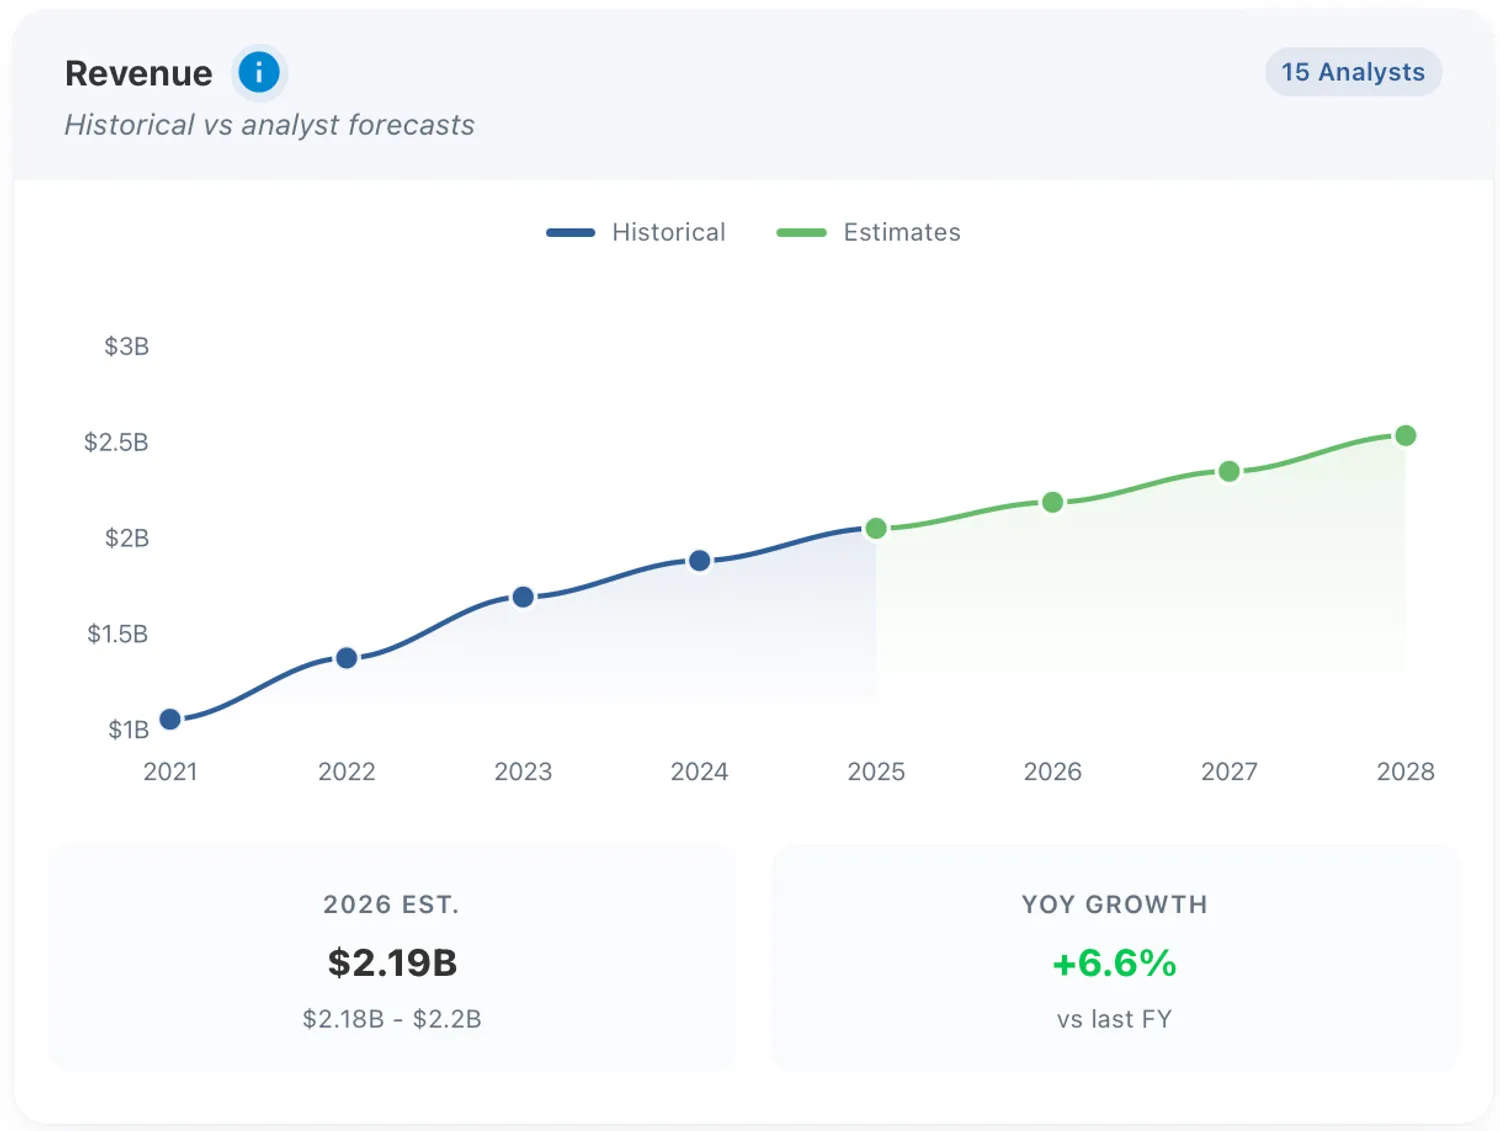 Figure 9. Analysts expect revenue growth to remain moderate over the next several years, generally in the high-single-digit range.
The financial health rating of A- (4.2/5.0) is the strongest component, reflecting broad agreement on the quality of the underlying business. The near-even split between Buy and Hold ratings reflects genuine disagreement about the trajectory, not the fundamentals.
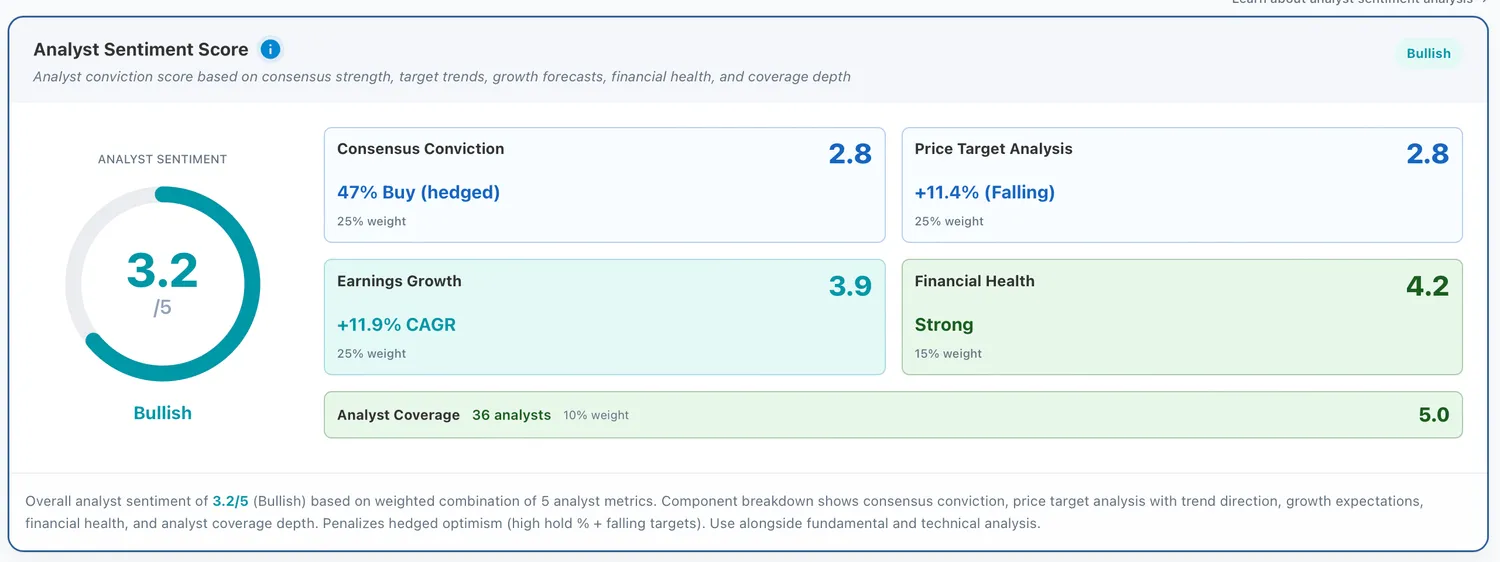 Figure 10. A- financial health and constructive earnings estimates contrast with cautious consensus ratings. Explore the full estimates on our Analyst Estimates page.
Dimension 5: Holdings Analysis - 2.80/5.0
Insider activity over the past eight quarters shows consistent selling: over $99 million disposed, headlined by a $53.3 million sale in Q2 2025. Insider buying in the same period totalled 150 shares for $21,852. Some of this selling likely reflects pre-scheduled compensation plans, but the absence of voluntary open-market buying at these price levels is notable.
Institutional ownership has risen from 78.6% to 91.4%, and the composition of holders is shifting. Harris Associates (deep value) increased its stake 71.9%. Reinhart Partners increased 886%. On the other side, Polen Capital (quality-growth) reduced holdings 29%. This rotation from growth mandates to value mandates follows naturally from the repricing of the stock.
The put/call ratio improved from 2.08 to 1.15, and fund data shows 93 funds buying against 85 selling. The holder base is transitioning rather than abandoning the stock.
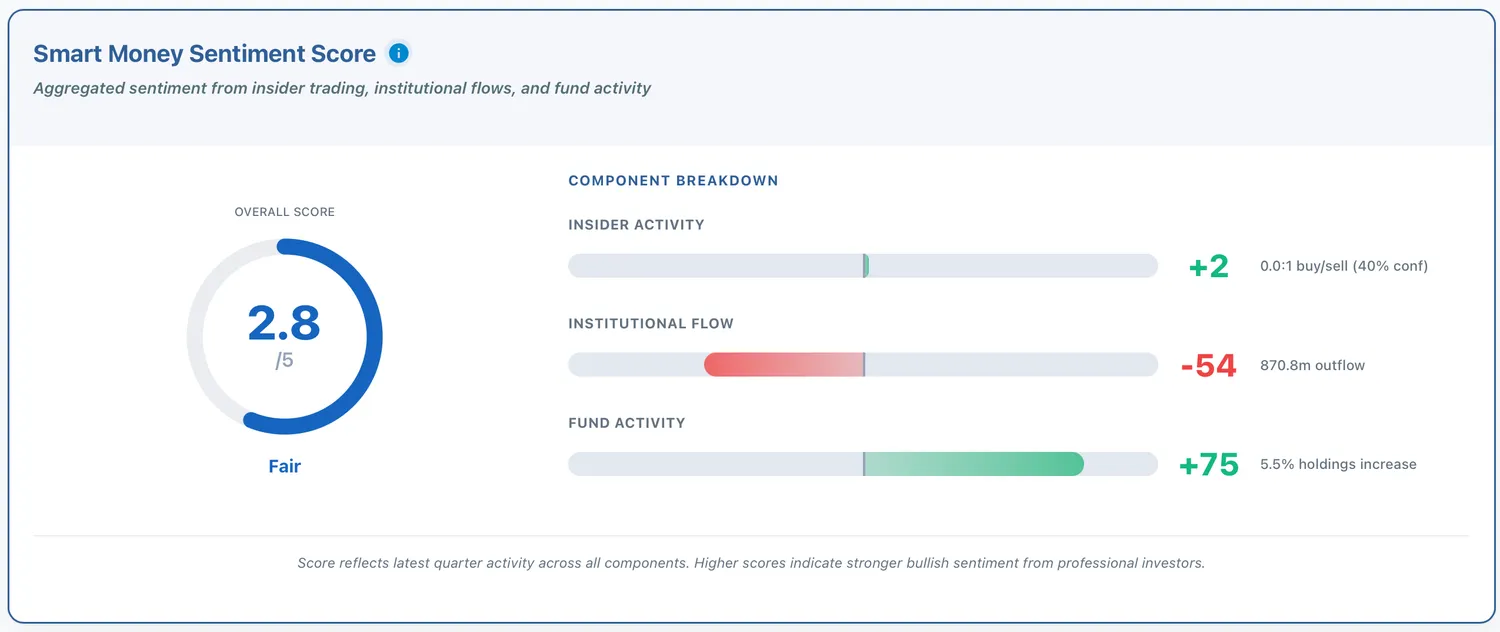 Figure 11. Institutional rotation is the key signal, with value-oriented investors replacing growth-oriented holders. Full breakdown on our Holdings Analysis page.
What the Five Dimensions Tell Us
Across all five dimensions, a consistent pattern emerges. The backward-looking metrics are strong: near-4.0 quality, minimal debt, $408 million in free cash flow, A- financial health, peer-leading profitability and balance sheet strength. The forward-looking signals carry more uncertainty: decelerating growth, 0th percentile revenue growth among peers, analyst caution, and insider selling.
BETI sits at the center of this tension. It created the growth headwind that triggered the repricing, the peer-relative weakness, and the holder rotation. But management argues that BETI deepens switching costs by embedding the entire workforce (not just HR) into Paycom's platform, and client retention has improved. The company has replaced sales leadership, launched IWant (an AI-driven command engine), and bought back $223.4 million in stock in Q3 2025 alone.
At 15x earnings with minimal debt and $408 million in free cash flow, the market is pricing in significant pessimism about the growth trajectory. The question is whether that pessimism is justified. BETI is a known, finite disruption to the revenue model, not a sign that the business is broken. Paycom isn't losing clients to competitors; it stopped charging for something clients hated paying for. If growth stabilises in the mid-single digits and margins hold, a stock trading at half its sector's multiple with this balance sheet quality raises the question of whether the market overcorrected.
Explore the full analysis: Quality | Peers | Valuation | Analysts | Holdings
You can build and explore your own quality, value, and dividend scores, with full scoring breakdowns, on the Strategies page of our platform.
All financial data sourced from Stockoscope's database, powered by Financial Modeling Prep API. Market context informed by public reporting from Motley Fool, TIKR, Morningstar, and Investing.com. Prices and scores as of 15 March 2026.
This analysis is for informational purposes only and should not be considered personalised investment advice. Past performance does not guarantee future results.