
ServiceNow at Half Price: What Five Dimensions of Data Show Behind the AI Panic
ServiceNow stock has fallen 50% from its highs as AI disruption fears collide with 21% revenue growth and $4.6B in free cash flow. The 5D Framework examines where the five dimensions agree and where they diverge.

ServiceNow (NOW) has spent a decade building itself into the operating system of enterprise IT. From its origins as a cloud-based IT ticketing platform, the company expanded into HR workflows, customer service, security operations, and more, growing revenue from $1.4 billion in 2016 to $13.3 billion in 2025. That is nearly a 29% compound annual growth rate sustained across nine years. Free cash flow hit $4.6 billion in 2025. The business has been, by nearly every metric, an elite compounder.
Then came the AI disruption narrative. In late 2025 and early 2026, investors began repricing the entire enterprise software sector on fears that advancing AI models, particularly agentic AI systems capable of handling complex workflows autonomously, could erode the value of platforms like ServiceNow. The stock fell from a peak near $225 (split-adjusted) to around $110, a decline of roughly 50%.
The tension is real. ServiceNow's business is posting 21% subscription revenue growth, analysts project $16 billion in revenue for 2026, and the CEO just bought $3 million in stock. Yet the market has repriced the stock from 153x trailing earnings to 66x in barely a year. We applied the 5D Framework to see what the data reveals across all five dimensions.
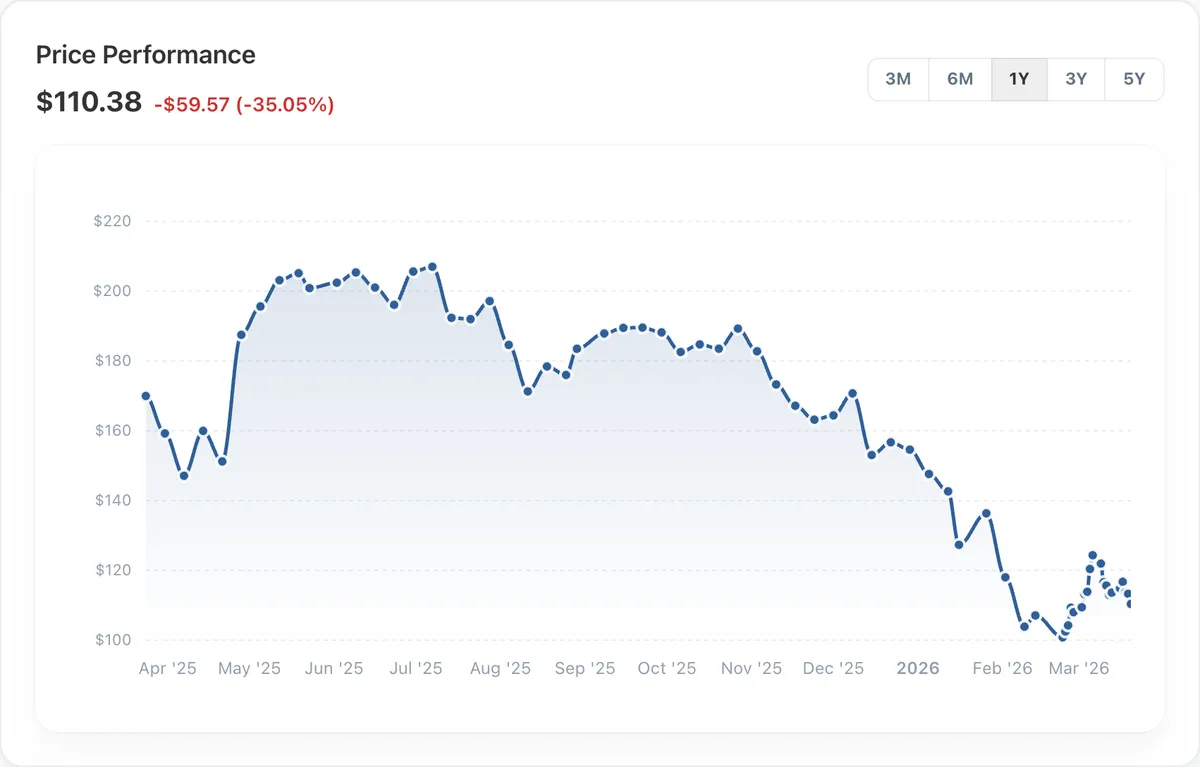 Figure 1. ServiceNow shares have fallen roughly 50% from their 52-week high, driven largely by AI disruption fears and a broader software sector rotation.
Dimension 1: Business Quality, 3.34/5.0
ServiceNow scores 3.34/5.0 on business quality, which reflects an unusual profile: elite growth and cash generation sitting alongside low profitability relative to the company's scale. The pillar breakdown tells the story clearly. Top-line growth earns a perfect 5.0, and for good reason. Revenue grew from $1.39 billion (2016) to $13.28 billion (2025), with per-share revenue climbing from $1.69 to $12.80. Cash flow quality also scores 4.25/5.0, supported by $4.58 billion in free cash flow (2025), up from $32 million in 2016.
Leverage earns a 5.0. Debt-to-equity sits at 0.25, down from 1.51 in 2017, and net debt-to-EBITDA is negative at -0.17, meaning the company holds more cash than debt. Interest coverage of 101x (TTM) is effectively impenetrable. Per-share fundamentals also earn 5.0, reflecting the sustained compounding in revenue, earnings, and book value per share over the decade.
Where the score is pulled lower is profitability. ROE of 13.5% and ROIC of 9.0% are respectable but not exceptional for a software company. The returns overview pillar scores just 1.75/5.0. The trajectory here is positive: the company was unprofitable through 2018 (net income of -$27 million, ROE of -2.4%), turned profitable in 2019, and has seen steadily improving margins since. Gross margin has held steady around 77-78% across the decade, while EBITDA margin expanded from -24% in 2016 to 22.6% in 2025. Net margins reached 13.2%, up from negative territory just seven years ago.
The margin trajectory creates a nuance the score partially captures. ServiceNow is not a company with peak margins declining; it is a company with margins still expanding from a long period of heavy investment. Operating margin went from -30% (2016) to 13.7% (2025). Whether margins continue expanding, as management guides, or plateau, as the aggressive acquisition pace might suggest, is an open question.
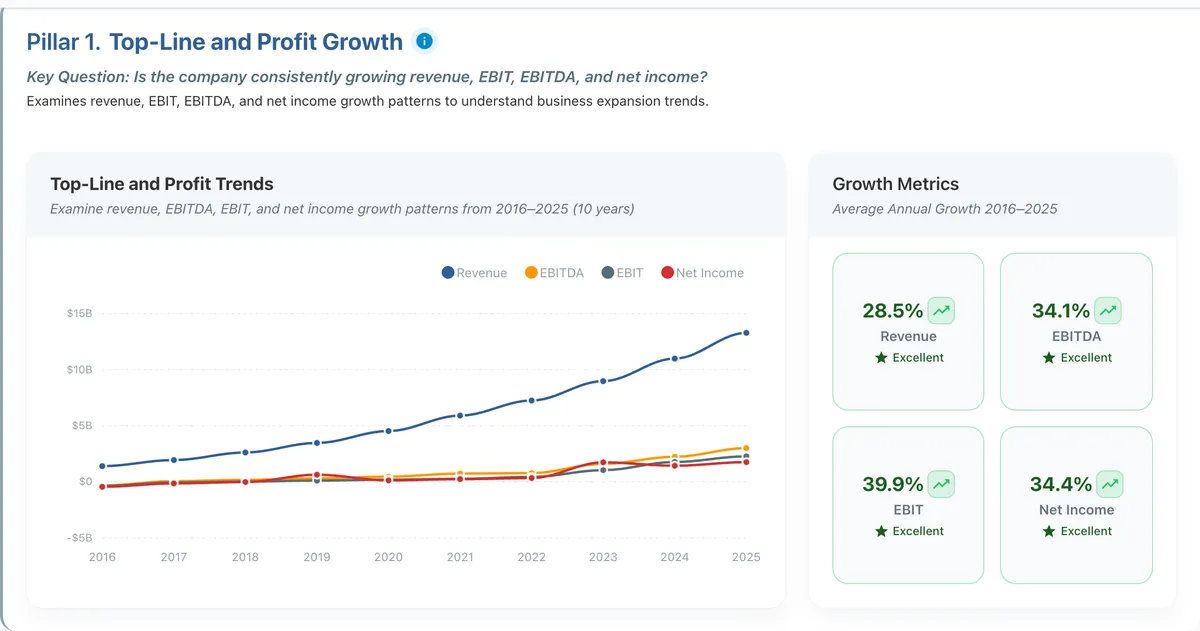 Figure 2. Revenue has grown roughly 10x over the past decade while EBITDA and net income have inflected sharply upward in recent years.
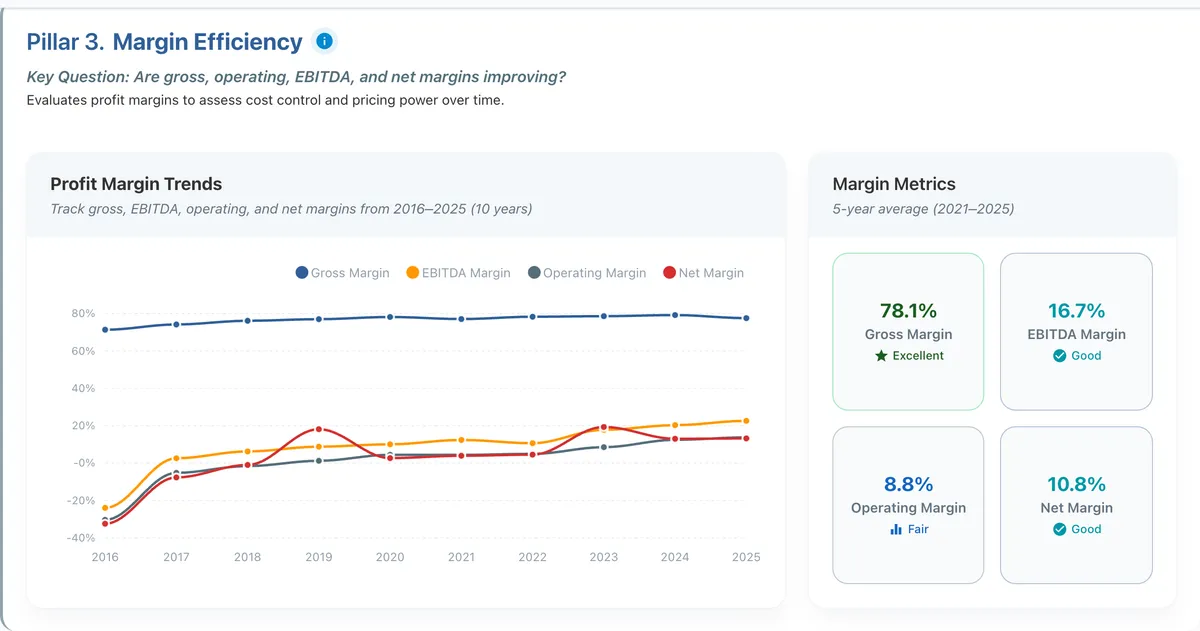 Figure 3. Gross margin has held steady at 77-78%, while operating and net margins have expanded meaningfully from negative territory to 13.7% and 13.2% respectively.
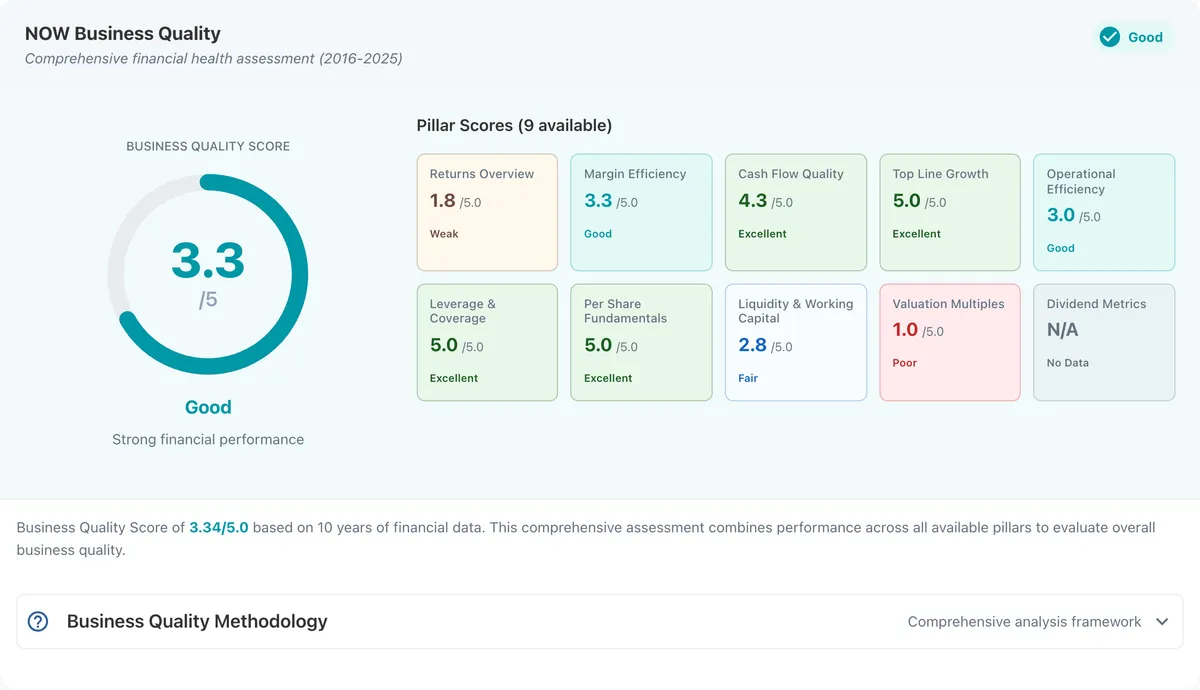 Figure 4. ServiceNow earns 3.34/5.0 on quality. Perfect scores on growth, leverage, and per-share fundamentals, offset by lower profitability returns. Full breakdown on our Quality Analysis page.
Dimension 2: Peer Comparison, 3.28/5.0 (Sector) | 2.74/5.0 (Industry)
Among 80 Technology sector peers and 13 Software Application competitors, ServiceNow's profile shows clear bifurcation between growth leadership and profitability lag.
Growth is where ServiceNow stands out. Revenue growth ranks in the 75th percentile against the Technology sector, with EBITDA growth at the 67th percentile and free cash flow growth at the 62nd. Among its 13 direct industry peers, revenue growth sits at the 77th percentile. These rankings reflect the 21% revenue growth rate that few companies of this size can sustain.
Financial discipline also ranks highly. Debt-to-equity sits in the 75th percentile against both sector and industry, and interest coverage ranks at the 89th percentile versus the sector. Income quality, a measure of how well cash flow supports reported earnings, sits at the 92nd percentile, the highest of any metric.
Profitability is where ServiceNow lags. Gross margin ranks at the 80th percentile in the sector (strong), but EBITDA margin drops to the 31st percentile and operating margin to the 25th. Net margin ranks at the 40th percentile for the sector and just 15th percentile among direct industry peers. ROE ranks 41st percentile in the sector, ROIC 39th. Among its 13 direct competitors, return on invested capital sits at just the 31st percentile.
The peer data surfaces a company that is growing faster and compounding revenue better than nearly all its peers, but converting less of that revenue into profit. For a $115 billion market cap company, the gap between top-line growth rankings and bottom-line profitability rankings is unusually wide. Whether the improving margin trajectory closes that gap is a forward-looking question the peer data alone does not answer.
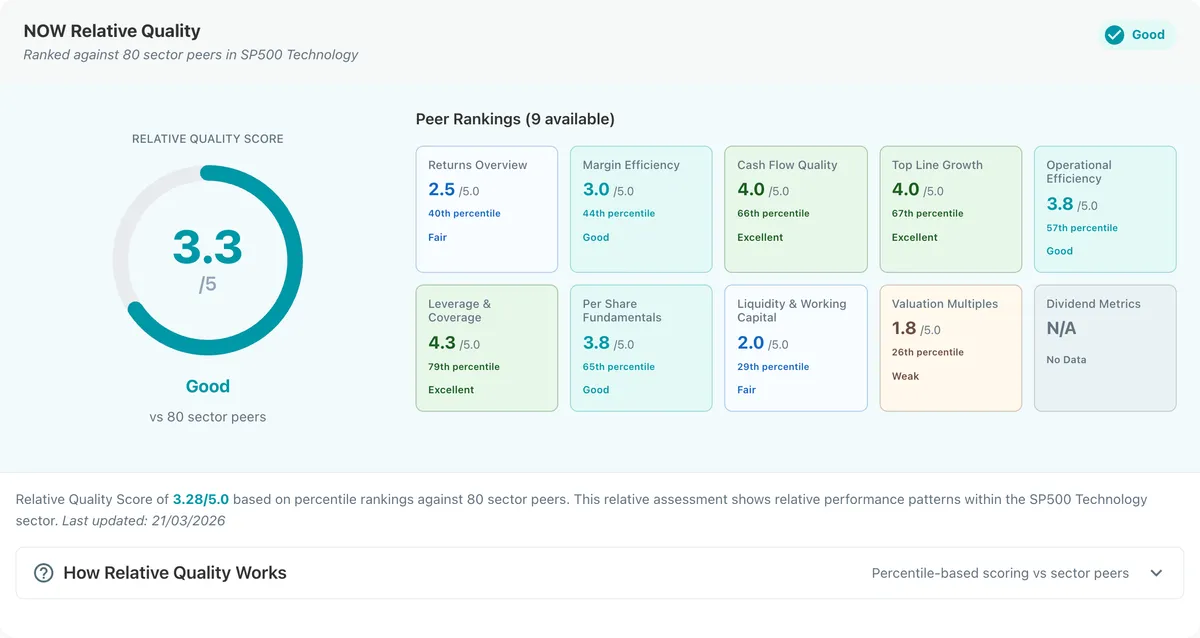 Figure 5. ServiceNow leads on growth and financial discipline but lags on profitability versus both sector and industry peers. Full breakdown on our Peer Comparison page.
Dimension 3: Valuation, Multiple Models, One Theme
Our DCF model produces an intrinsic value of $125.80, implying 14% upside from the current $110.38. The model uses a WACC of 8.67%, an analyst-consensus revenue growth rate of 22.9% (based on 33 analysts covering estimates out to 2030), and a 3% terminal growth rate. The growth input is anchored by analyst estimates that project revenue reaching $30.3 billion by 2030.
On peer multiples, ServiceNow trades at 65.6x trailing P/E, 38.1x EV/EBITDA, and 8.7x EV/Sales. These are high in absolute terms but represent a massive compression from historical levels: the five-year median P/E was 153x, EV/EBITDA was 175x, and EV/Sales was 13.7x. The stock is trading at roughly half its historical valuation multiples. Against sector medians of 29.3x P/E and 19.7x EV/EBITDA, ServiceNow still commands a premium, placing it in the 15th percentile on P/E relative to peers (meaning 85% of peers trade at lower multiples).
Free cash flow yield has improved to 4.0% (TTM), the highest in the company's history as a public company, though still below the sector median of 4.5%. The composite peer-implied price of $68.52 suggests the stock trades at a 38% premium to what peers would command at similar multiples, while the historical composite implies $254.50. The blended implied price across all models settles at $97.16, roughly 12% below current levels.
The Excess Returns model produces a much lower value of $14.76, reflecting the combination of a 13.9% cost of equity and a current ROE of only 13.5%, which barely exceeds the required return. For a model that values spread between ROE and cost of capital, ServiceNow's still-maturing profitability profile produces a structurally low output.
A note on EBITDA margins in the DCF: the model uses a 35.4% EBITDA margin derived from analyst consensus estimates, which reflects adjusted EBITDA (adding back stock-based compensation). ServiceNow's GAAP EBITDA margin is 22.6%, the gap being $1.96 billion in SBC. Using GAAP EBITDA would lower the intrinsic value to roughly $80, implying the stock is overvalued by about 27%. However, GAAP EBITDA also overstates the cost, because ServiceNow repurchased $1.84 billion in stock in 2025, nearly offsetting the dilution from SBC. The true economic EBITDA margin sits somewhere between 22.6% (GAAP, which double-counts SBC when paired with diluted shares) and 35.4% (adjusted, which ignores SBC entirely). Neither extreme is fully accurate, but the adjusted figure is closer to reality for a company actively buying back shares at this scale.
The valuation picture is one of a stock that has cheapened dramatically relative to its own history but remains expensive relative to peers. The key variable is whether ServiceNow's 20%+ growth rate and expanding margins justify the premium, or whether AI disruption fears warrant a further compression toward sector medians.
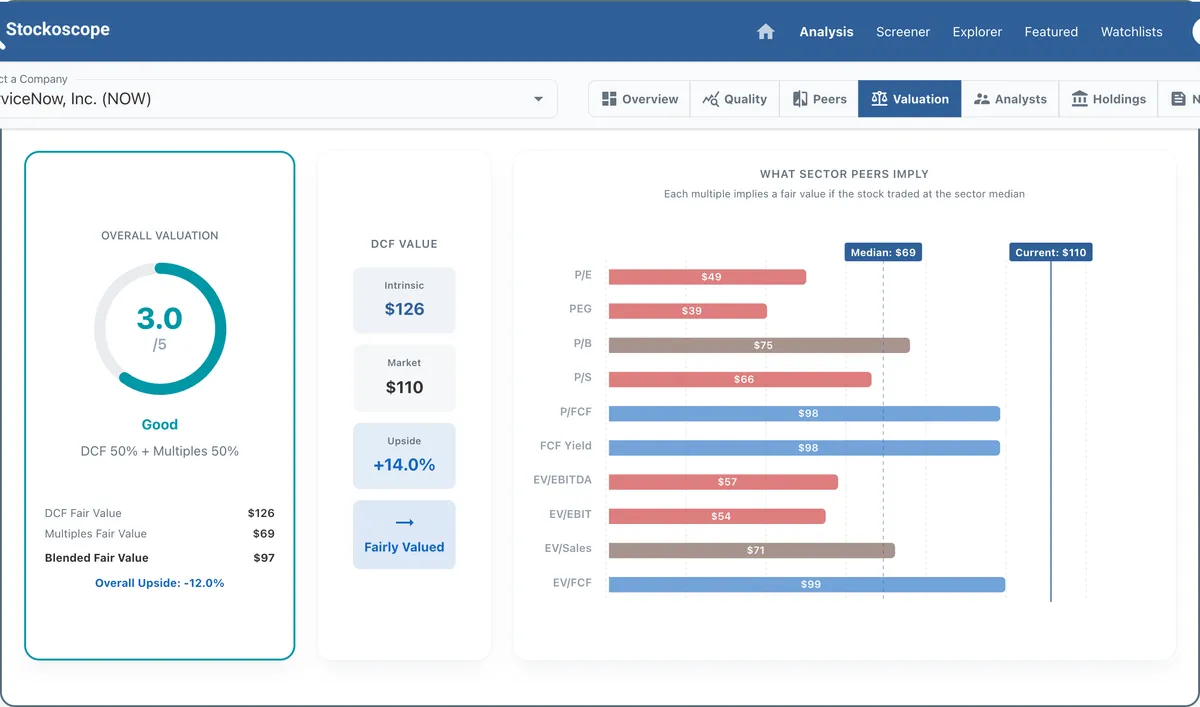 Figure 6. The DCF model implies 14% upside, but the range across models spans from $14.76 (Excess Returns) to $254.50 (historical multiples). Run your own scenarios on our Valuation Analysis page.
Dimension 4: Analyst Sentiment, 4.00/5.0
Analyst sentiment is the strongest dimension in ServiceNow's profile. Of 67 analysts covering the stock, 58 rate it Buy, 8 Hold, and 1 Sell. The consensus price target of $196.29 implies 78% upside from current levels. The target range spans $115 (KeyBanc) to $263 (high), with a median of $195.
Recent price target actions show the split in conviction. On January 29, 2026, Kirk Materne at Evercore ISI lowered his target to $175 from $225 but maintained an Outperform rating. Keith Bachman at BMO Capital cut to $170 from $175. Jackson Ader at KeyBanc lowered to $115, the most bearish on the Street. On the other side, Gil Luria at D.A. Davidson reiterated Buy with a $220 target, citing strong growth outlook. Cantor Fitzgerald maintained Overweight, noting ServiceNow is well-positioned for agentic AI adoption.
Forward estimates tell a growth story that contrasts with the stock's decline. Analysts project 2026 revenue of $16.0 billion (20% growth from 2025), rising to $18.9 billion in 2027 and $22.6 billion in 2028. EPS estimates climb from $1.69 (2025 actual) to $4.19 in 2026, $5.05 in 2027, and $6.17 in 2028. At the 2026 EPS estimate of $4.19, the forward P/E drops to roughly 26x, a fraction of the stock's historical trading range.
The financial health rating of B (3.0/5.0) is the weakest component within the analyst dimension, reflecting middling scores on P/E and P/B (both 1.0/5.0) offset by strong DCF, ROE, and ROA scores (all 4.0/5.0). Analyst coverage earns a perfect 5.0, reflecting 30+ analysts providing estimates, and earnings growth scores 4.5/5.0.
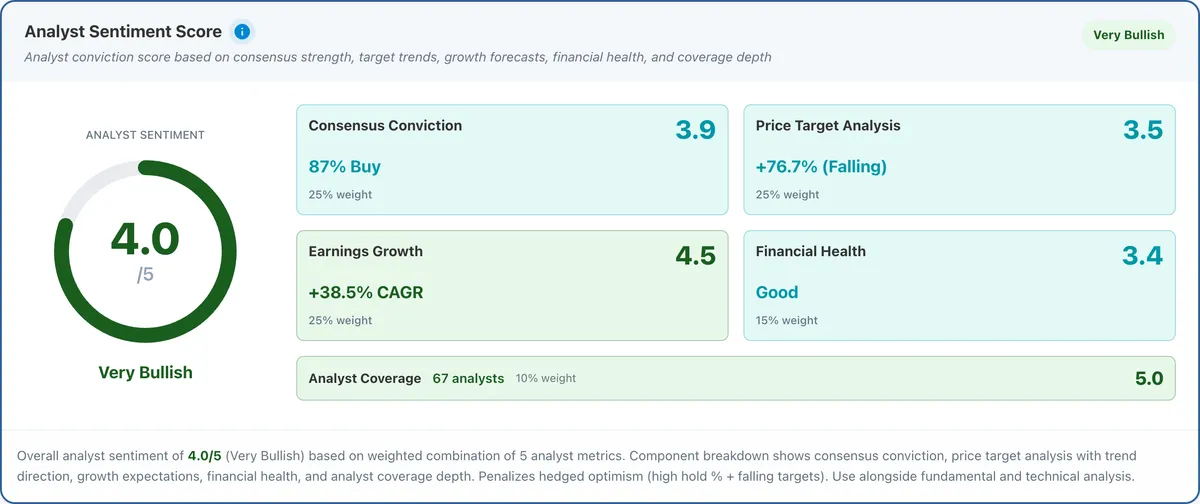 Figure 7. The consensus price target of $196.29 implies 78% upside from current levels, with significant dispersion between bulls and bears.
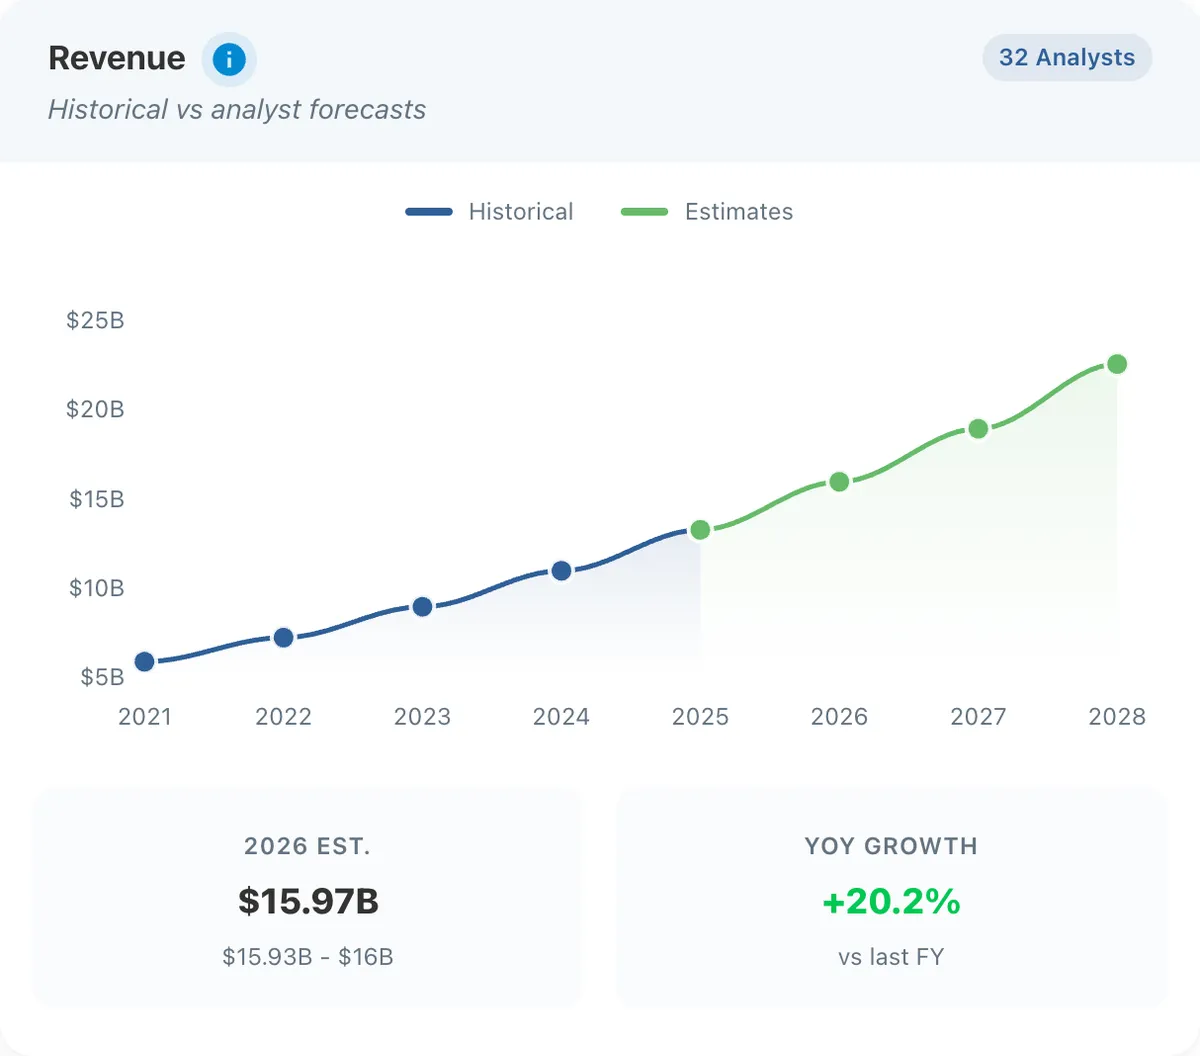 Figure 8. Analysts project continued 20%+ revenue growth through 2028, with 30+ analysts covering the stock.
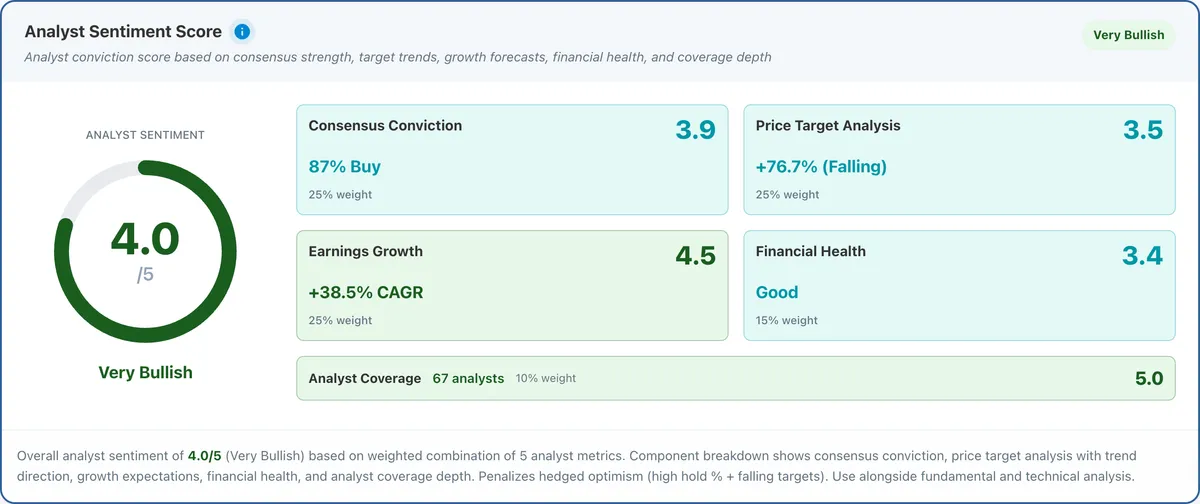 Figure 9. Analyst sentiment is the strongest dimension at 4.0/5.0. Near-unanimous Buy ratings and 78% consensus upside contrast with the stock's 50% decline. Explore the full estimates on our Analyst Estimates page.
Dimension 5: Holdings Analysis, 3.60/5.0
The most notable insider signal is a $3 million open-market purchase by CEO Bill McDermott on February 26, 2026, at approximately $104.60 per share. This was the first significant insider buy in recent quarters, following a period dominated by selling. In Q1 2026 to date, insider acquisitions totalled $3 million (28,682 shares) against $1.7 million in dispositions (16,237 shares), a net positive. This contrasts sharply with prior quarters: Q1 2025 saw $35.4 million in insider selling with zero buying, and Q4 2024 saw $42.4 million in dispositions.
The selling context matters. Much of the prior selling occurred at prices between $808 and $863 (pre-split adjusted), reflecting routine compensation-related sales at much higher levels. CFO Gina Mastantuono sold 415 shares at $850 in December 2025. Director Lawrence Jackson sold 265 shares at $810. These were small, routine dispositions. McDermott's purchase at $104.60, after the stock had fallen more than 40%, is a voluntary conviction signal.
Institutional ownership stands at 87.1%, with 2,381 institutions holding positions. The most recent quarter (Q4 2025) showed 312 new positions opened and 2,246 increased, against 269 closed and 36 reduced. Norway's sovereign wealth fund (Norges Bank) established a new 13.2 million share position worth $2 billion. Goldman Sachs increased its stake by 14.2%. DZ Bank increased 9.6%. On the selling side, Wellington Management reduced 28.1%, Franklin Resources cut 35.8%, and Jennison Associates reduced 24.2%.
Vanguard (9.8% ownership), BlackRock (9.2%), and State Street (4.6%) remain the three largest holders. T. Rowe Price holds 3.1%, and JPMorgan 3.7%. The total institutional investment declined by $25.6 billion in Q4, reflecting the price drop rather than share sales, as total shares held actually increased by 725 million (reflecting the stock split adjustment).
Fund participation surged in Q4 2025, with 584 funds holding the stock (up from 9 in Q3), 344 funds buying and 82 selling. The put/call ratio declined to 1.01, close to neutral.
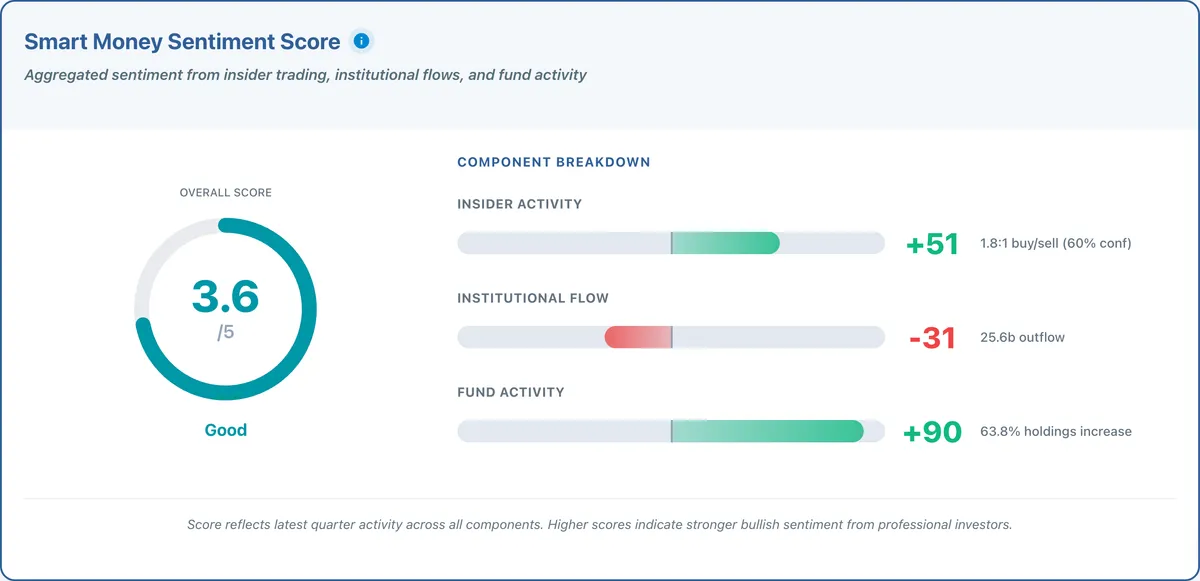 Figure 10. The CEO's $3M purchase stands out against a backdrop of strong institutional accumulation and broadening fund participation. Full breakdown on our Holdings Analysis page.
What the Five Dimensions Tell Us
Four of the five dimensions lean positive. Business quality shows 21% revenue growth, $4.6 billion in free cash flow, improving margins, and a clean balance sheet. Peer comparison confirms ServiceNow leads its competitive set on growth and financial discipline. Analyst sentiment is the strongest signal: 58 out of 67 analysts rate it Buy, the consensus target implies 78% upside, and forward estimates project continued 20%+ growth through 2028. Holdings activity shows institutional accumulation, a brand new $2 billion position from Norway's sovereign wealth fund, and a CEO putting $3 million of his own money into the stock at $104.60. Across these four dimensions, there is no evidence that the business is deteriorating.
The fifth dimension, valuation, is where the picture gets complicated. The stock has halved from its historical multiples, but it still trades at a premium to sector peers on nearly every metric. The DCF implies just 14% upside, and that figure uses adjusted EBITDA margins that exclude $1.96 billion in stock-based compensation. Profitability remains below the industry median, with ROE of 13.5% and ROIC of 9.0% placing ServiceNow in the bottom third of its peer group. This is not a classic value setup where a high-quality business trades at a bargain. It is a premium business at a less-premium price.
Then there is the AI disruption question that triggered the sell-off. Here, the data suggests the market narrative may have it backwards for this particular company. ServiceNow is not being displaced by AI; it is spending over $10 billion (Moveworks, Veza, Armis) to become the orchestration layer that AI agents run on. Every recent press release points to partners deploying AI on top of ServiceNow's platform, not around it. The real risk is not that AI replaces ServiceNow's workflows, but that AI eventually makes enterprise workflows simple enough that companies no longer need a platform of this scale to manage them. That is a legitimate long-term structural question. But it is a theoretical one. In the near term, the increasing complexity of managing AI agents, their identities, their access, and their interactions across enterprise systems is actually expanding the demand for exactly what ServiceNow provides.
The weight of evidence across the five dimensions leans toward the market having overreacted. But the thin DCF margin of safety, still-premium peer multiples, and maturing profitability profile mean this is a conviction call on growth continuation, not a wide margin-of-safety value play. If 20%+ growth holds and margins keep expanding, the current price will look like an opportunity. If growth decelerates or the acquisition integration stumbles, the premium valuation leaves less room for error than the 50% drawdown might suggest.
Explore the full analysis: Quality | Peers | Valuation | Analysts | Holdings
All financial data sourced from Stockoscope's database, powered by Financial Modeling Prep API. Market context informed by public reporting from Motley Fool, Trefis, TIKR, and CNBC. Prices and scores as of 22 March 2026.
This analysis is for informational purposes only and should not be considered personalised investment advice. Past performance does not guarantee future results.