
Mastercard Through the Quality Lens: A December Breakdown
How strong profitability and peer rankings drove MA's quality score in December 2025, the second time it scored this high since our quality algorithm launched in August 2025.
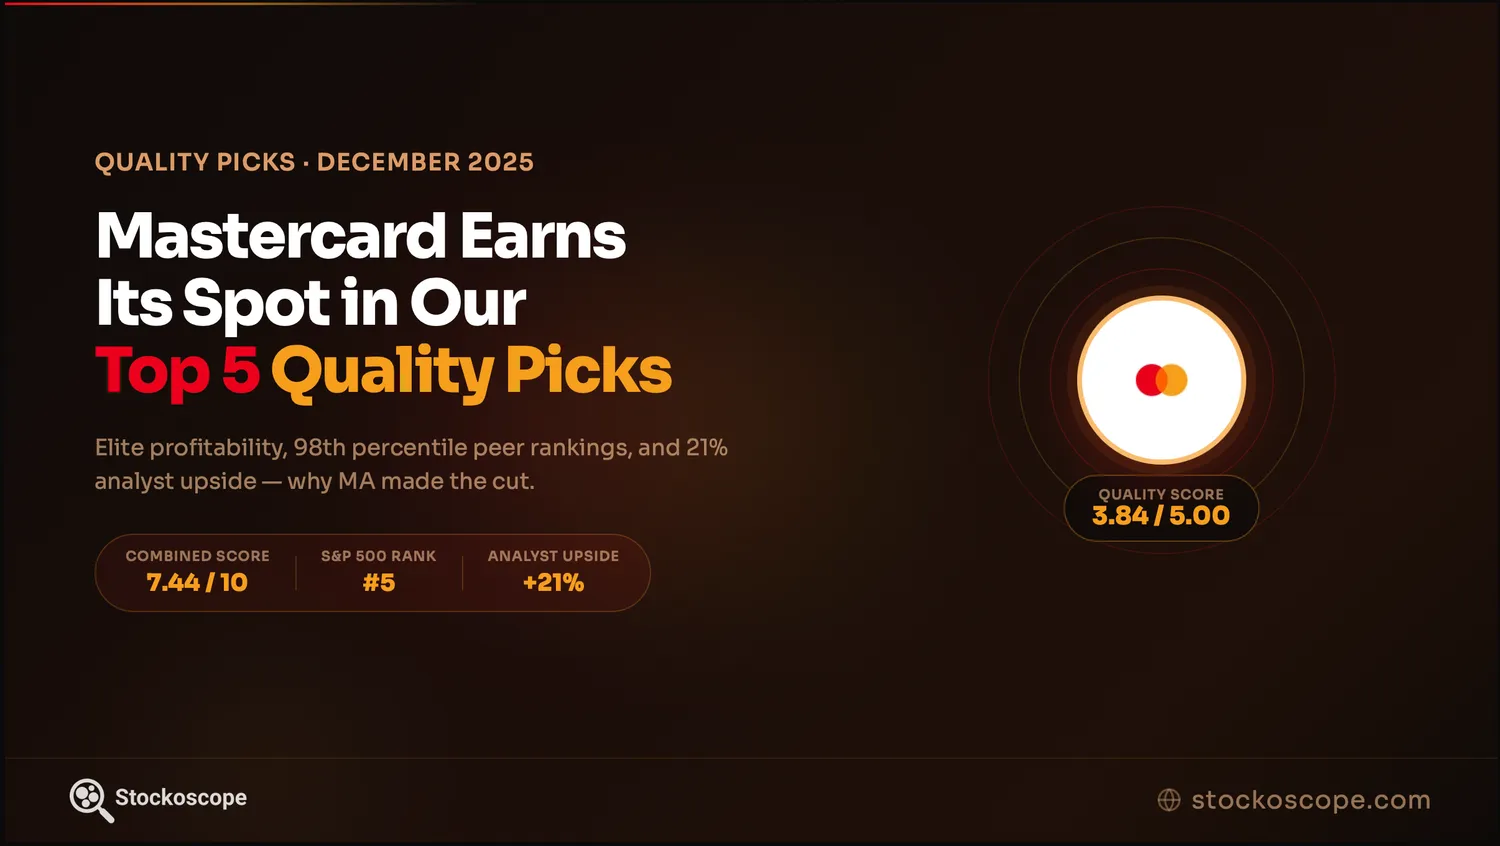
Mastercard (MA) scored among the five highest on the quality lens for December 2025. It's the second time it has scored this high since we launched this methodology in August 2025. Trading at $550.53 at the time of analysis (1 December 2025), this payments technology giant scored well through a combination of exceptional fundamental strength and solid peer rankings within the highly competitive Financial Services sector.
Why This Matters
Since launching our quality scoring algorithm four months ago, we've been scoring S&P 500 companies through a rigorous, data-driven process. Each month the same method re-ranks the universe on the quality lens, and Mastercard has now scored among the five highest twice. Its December score is particularly remarkable because MA scored fifth while competing against a universe that includes some of the market's most dominant technology companies.
The Scoring Framework: A Two-Score System with Five Critical Checks
Our algorithm evaluates stocks through two complementary lenses:
1. Investment Quality Score (Pillar Score): 3.84/5.00
This score measures a company's absolute fundamental strength across 10 key pillars. Mastercard's breakdown reveals a company firing on nearly all cylinders, with perfect 5.0/5.0 scores in both Returns Overview and Margin Efficiency, the two pillars that matter most for profitability. Strong ratings in Cash Flow Quality (3.75) and Operational Efficiency (3.75) round out a picture of operational excellence.
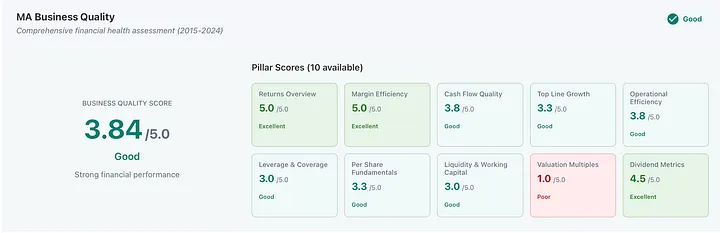
Figure 1. Mastercard's Investment Quality Breakdown (2015–2024). Perfect 5.0 scores in Returns Overview and Margin Efficiency validate MA's operational excellence. The 1.0 Valuation Multiples score reflects the premium investors pay for quality, consistent with our DCF showing MA trading 31% above intrinsic value.
These perfect scores aren't accidental; they reflect Mastercard's incredible business model efficiency. With a return on equity of 196.9% and a net profit margin of 45.3%, MA operates in rarified air that few companies can match. The only weak spot? Valuation Multiples at just 1.0/5.0, signalling that investors pay a steep premium for this quality.
2. Relative Quality Score (Peer Score): 3.89/5.00
This score compares Mastercard against 68 peers in the Financial Services sector. The peer rankings tell a compelling story: MA ranks in the 98th percentile for Returns Overview and 93rd percentile for Margin Efficiency, near the top among financial services companies. Strong showings in Operational Efficiency (69th percentile) and Per Share Fundamentals (68th percentile) demonstrate consistent outperformance across multiple dimensions.
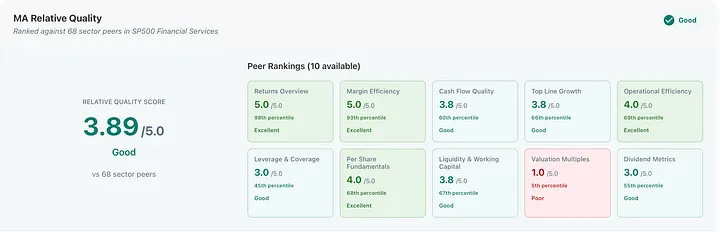
Figure 2. Mastercard's Peer Rankings Within the Financial Services Sector. MA ranks in the 98th percentile for returns and 93rd percentile for margins among 68 Financial Services peers. The 5th percentile valuation ranking confirms the market pays a steep premium for this exceptional quality.
Again, the valuation story appears: MA ranks in just the 5th percentile for Valuation Multiples versus peers, confirming the market recognises, and prices in, this exceptional quality.
Combined Overall Score: 7.44/10.0
This places Mastercard as the 5th highest-scoring stock on the quality lens in our entire S&P 500 universe for December.
The Five Critical Validation Checks
A high quality score alone isn't the whole picture. To rank among the highest on the quality lens, stocks also need to pass at least 3 of 5 validation checks. Mastercard passed exactly 3:
Check 1: Analyst Upside ≥10% (Passed: 21.06% upside)
Wall Street analysts see meaningful upside potential, with consensus price targets of $666.45 suggesting MA is undervalued relative to its growth prospects. The wide analyst target range ($616–$730) reflects varying views on how regulatory challenges and growth opportunities will balance out, but the overall bullish sentiment is clear.
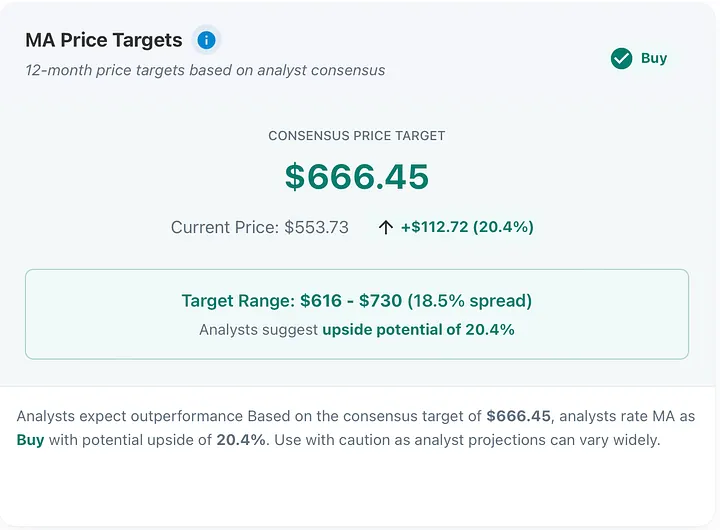
Figure 3. Analyst Price Targets and Consensus Rating. Wall Street's consensus target of $666.45 implies 20.4% upside from current levels. This analyst optimism contrasts with our DCF value of $381.90, highlighting the gap between fundamental valuation and Street expectations.
Check 2: Buy Consensus Rating (Passed)
The analyst community's conviction is strong: 49 of 62 analysts rate Mastercard "Buy," with one "Strong Buy" and 12 "Hold" ratings. Notably, zero analysts recommend selling MA, reflecting broad confidence in the company's competitive positioning despite regulatory headwinds.
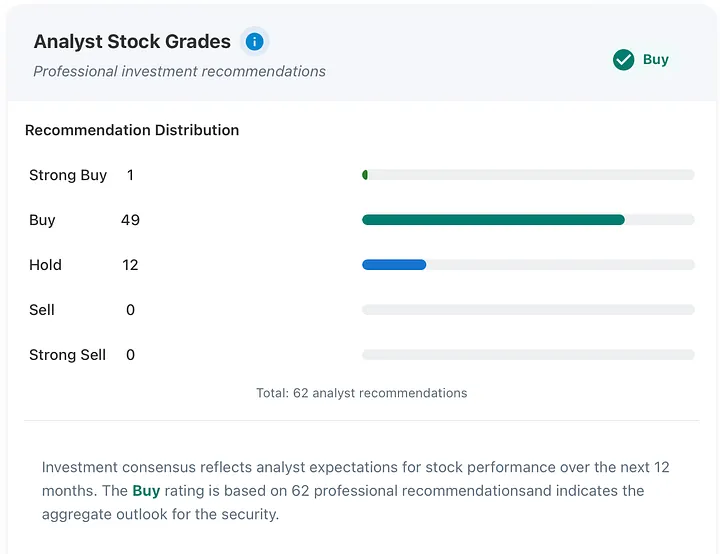
Figure 4. Analyst Recommendation Distribution. 49 of 62 analysts (79%) rate MA a "Buy" with zero "Sell" ratings, reflecting broad confidence despite regulatory challenges.
Check 3: Financial Health Score ≥3 (Passed - 3.00/5.00)
Mastercard earns a "B" grade in comprehensive financial health analysis. With an interest coverage ratio of 24.0x, a current ratio of 1.12x, and a debt-to-equity ratio of 2.40, MA demonstrates solid financial stability for a financial services company: adequate, though not exceptional compared to its very high profitability metrics.
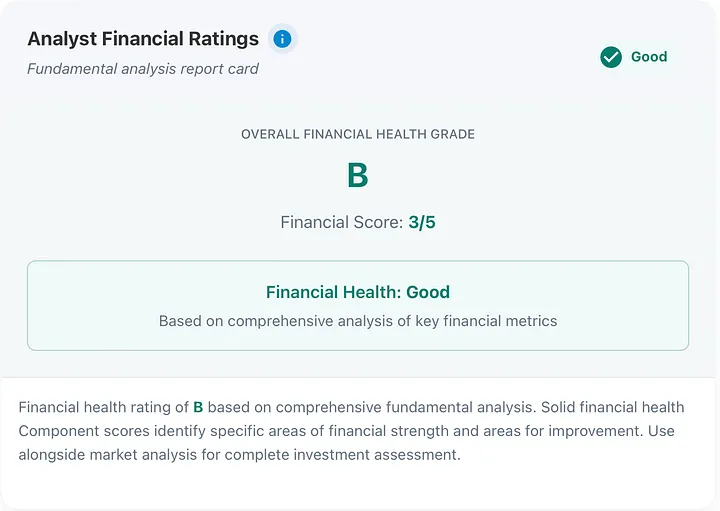
Figure 5. Financial Health Assessment. MA's "B" grade (3.0/5.0) reflects solid but unexceptional balance sheet strength: adequate to pass our validation check, but less impressive than its very high profitability metrics.
Check 4: DCF Fairly Valued (±20% range): Failed (-30.6% vs. intrinsic value)
Our DCF model values MA at $381.90 per share versus its current price of $550.53, indicating significant overvaluation. This 31% premium to intrinsic value highlights an important reality: the market is willing to pay significantly above fundamental value for Mastercard's exceptional returns and competitive moat. The divergence between our DCF ($381.90) and analyst targets ($666.45) shows that Street expectations price in sustained dominance and successful execution of growth initiatives.
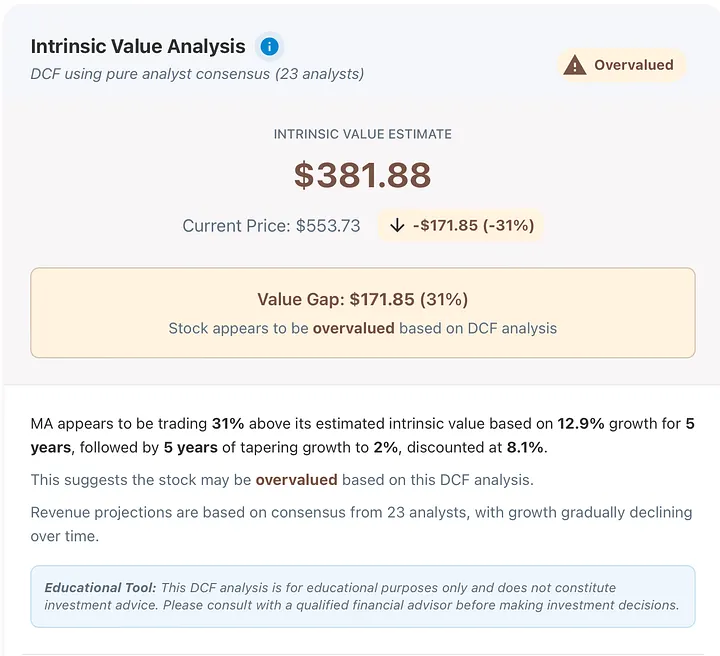
Figure 6. DCF Valuation Analysis. Our model estimates intrinsic value at $381.88 versus the current price of $553.73, a 31% overvaluation. This gap explains MA's failed DCF check and 1.0 Valuation Multiples scores throughout our assessment.
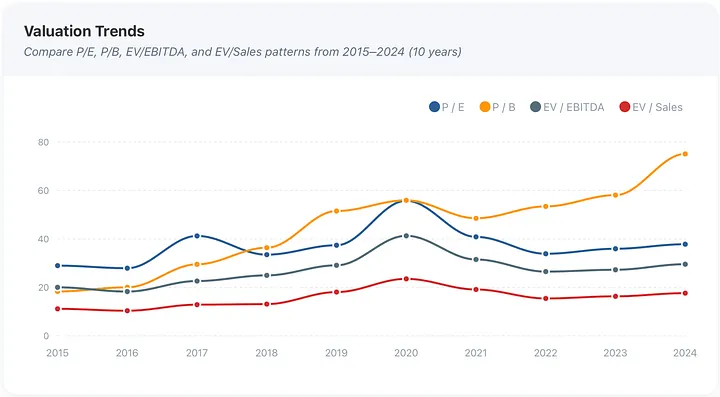
Figure 7. Valuation Trends (2015–2024). All valuation metrics have expanded significantly over the decade: P/E rose from ~29x to ~38x, P/B surged from ~20x to ~75x, EV/EBITDA climbed from ~18x to ~28x, and EV/Sales increased from ~11x to ~17x. The dramatic P/B expansion (nearly 4x) far outpaces other metrics, indicating the market pays increasingly higher premiums for MA's capital-light, high-return business model.
Check 5: Positive Ownership Flows: Failed (Mixed signals)
Insider Trading showed minimal activity with an acquired/disposed ratio of 0.87% (Q4 2025: 45 shares acquired vs. 5,148 disposed). Institutional ownership saw a slight decline of -7.17M shares in Q3 2025, though institutions still own 85.9% of shares with $457.4B total invested (+$24.6B change), showing continued conviction despite slight share reduction. The ownership data reveals institutions are rebalancing rather than abandoning; they still control nearly 86% of the float.
Explore MA's full holdings data, including institutional flows and insider transactions, on our platform: MA Holdings Analysis
Risk Factors: What Could Go Wrong
While Mastercard's quality metrics are exceptional, several risks warrant attention.
- Regulatory Pressure: Ongoing scrutiny of interchange fees could weigh on margins.
- Rising Costs: Operating expenses and rebates are growing faster than revenue, pressuring profitability.
- Competition: BNPL, digital wallets, real-time payments, and fintech alternatives threaten to bypass card networks.
- Technology Disruption: Stablecoins and CBDCs could reduce reliance on traditional cross-border payment rails.
- Valuation Risk: Trading at a premium, leaving limited room for regulatory or competitive setbacks.
Looking Ahead
Mastercard's December score reflects a business operating at the intersection of financial services and technology, exactly where some of the strongest returns have been generated over the past decade. With a combined quality score of 7.44, strong analyst support (21% upside), and demonstrated financial health, MA scored well through methodical execution rather than speculative hype.
However, investors must weigh these exceptional fundamentals against meaningful risks: regulatory pressure on interchange fees, rising operating expenses, competitive threats from alternative payment rails, and long-term uncertainty around cryptocurrency. The 30.6% premium to intrinsic value is significant and leaves limited room for disappointment.
The investment case comes down to two beliefs: (1) traditional card networks will remain dominant despite technological disruption, and (2) Mastercard's diversification into Value-Added Services and emerging markets can offset mature market headwinds. For quality-focused investors comfortable with premium valuations and regulatory risk, Mastercard combines very high profitability, defensive characteristics, and secular tailwinds.
Explore the full 5D analysis for Mastercard on Stockoscope: Quality · Peers · Valuation · Analysts · Holdings
Methodology Note
Our quality scores are generated using a systematic, rules-based approach, which we walk through in full in Build Your Own Quality Score.
- Universe: S&P 500 stocks
- Scoring: Combination of Investment Quality (10 fundamental pillars) and Relative Quality (sector peer comparison)
- Validation: Minimum 3 of 5 checks required (DCF valuation, analyst upside, consensus rating, financial health, ownership flows)
- Ranking: Stocks ordered by combined quality score, with validation status shown alongside.
You can build and explore your own quality score, with the full scoring breakdown, on the Strategies page of our platform.
This article was originally published on Medium on 8 December 2025. We have retained the original publication date on this platform for consistency but updated the intro paragraph to correct an error. All other data, prices, and results reflect information available at the time of publication.
This article is for informational and educational purposes only and does not constitute financial advice or a recommendation to buy, sell, or hold any security. The analysis presented reflects our proprietary methodology and data as of December 2025. Past performance does not guarantee future results. All investments carry risk, including potential loss of principal. Always conduct your own research and consult with a qualified financial advisor before making investment decisions.