
Fiserv Through the Value Lens: A Breakdown After a 75% Crash
Broken Business or Bargain of the Decade?

The Stunning Collapse
In late October 2025, Fiserv (FI/FISV) experienced one of the most dramatic single-day crashes in fintech history. On October 29, 2025, the stock plummeted 44% in a single trading session, closing at $70.60, down from $126.17 the day before. Trading volume exploded from 5.8 million shares to over 100 million as panic selling intensified.
The carnage continued the next day, with Fiserv dropping to $65.19 before settling at $66.69 by month-end. For context, this is a company that processes payments for 6 million merchants globally and provides core banking technology to 42% of U.S. banks.
By 1 December 2025, when our algorithm ran its monthly screening, Fiserv was trading at $63.80, down nearly 50% from the post-crash October levels and representing a massive decline from pre-crash prices above $125. The market cap had fallen to $34.3 billion. The question our value investing algorithm had to answer: Is this a broken business in terminal decline, or a quality company temporarily mispriced by panic?
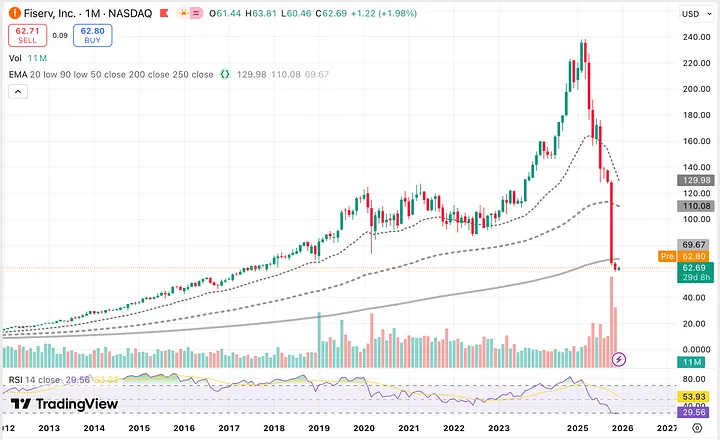
Figure 1. The fall from grace: Fiserv crashes from $240 to $63 in 2025
Note: On November 11, 2025, Fiserv moved its listing from the NYSE to NASDAQ and changed its ticker symbol from FI to FISV. Throughout this analysis, we refer to the company by its full name (Fiserv) rather than the ticker symbol to avoid confusion.
What Happened? The Q3 2025 Disaster
The collapse wasn't random. In Q3 2025, Fiserv reported results that shocked Wall Street:
- Revenue miss: $4.92B actual vs. $5.36B expected
- Earnings miss: $2.04 EPS vs. $2.64 expected
- Guidance slashed: Full-year adjusted EPS cut from $10.15-$10.30 to $8.50-$8.60
- Revenue growth: Revised down from 10% to just 3.5-4%
New CEO Mike Lyons, who took over in February 2025, admitted after a broad business review that the company had been "relying too heavily on short-term initiatives rather than building sustainable client relationships." Management acknowledged that deferred investments and cost cuts designed to boost quarterly margins had compromised their ability to serve clients effectively.
Why Our Algorithm Still Likes It
Despite the panic, our quantitative scoring system scored Fiserv highly on the value lens. This is the first time since launching our algorithm in August 2025 that Fiserv has scored in the top 5 on the value lens. It didn't score that high in August ($138.18), September ($130.45), October ($66.69 post-crash), or November ($60.80). The algorithm only flagged it on 1 December at $63.80.
This is value investing in action: our system doesn't chase popular stocks; it finds quality companies on sale. Even at $63, Fiserv had to pass profitability and quality filters. This is the opposite of growth investing or momentum trading. Our system specifically looks for quality businesses that have been beaten down to bargain prices.
Here's the breakdown of how it scored:
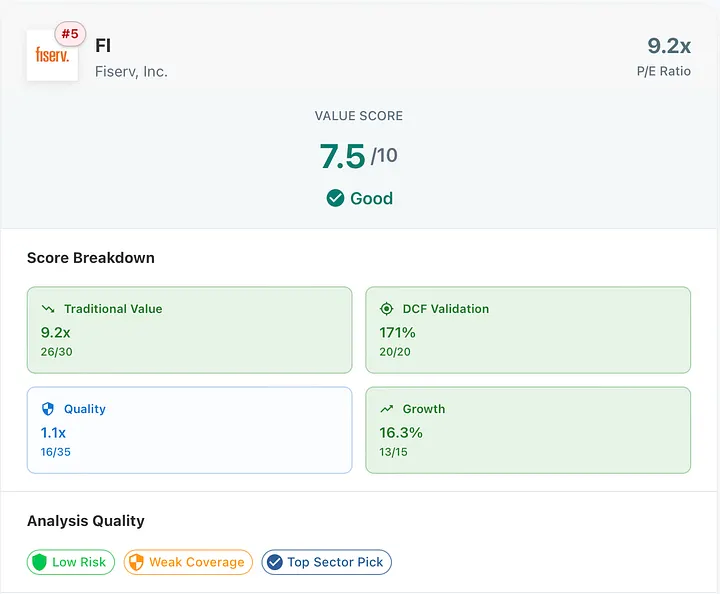
Figure 2. Fiserv at 9.2x earnings with 171% DCF upside, scoring fifth on the value lens in December.
1. Traditional Value Metrics: 26/30 points
This is where Fiserv truly shines:
P/E Ratio: 9.23 (scored 12/12 points): Fiserv is trading at less than 10x earnings, a remarkable discount for a company that traded at 37.97x P/E in 2024, 26.49x in 2023, and 25.66x in 2022. Even looking at the pre-pandemic years of 2017-2018, Fiserv typically traded at 21-25x earnings. The current 9.23x multiple represents a perfect score on the P/E component and is cheaper than the S&P 500 average of ~20x.
P/B Ratio: 1.33 (scored 8/10 points): The stock trades well below its recent historical levels of 4.39x (2024), 2.72x (2023), and 2.11x (2022). At just 1.33x book value, the market is pricing Fiserv close to its tangible assets with minimal premium for the business franchise.
EV/EBITDA: 7.08 (scored 6.4/8 points): Enterprise value multiples are at multi-year lows. Fiserv traded at 16.13x EV/EBITDA in 2024 and 12.96x in 2023. The current 7.08x multiple is less than half of recent levels, reflecting extreme market pessimism.
Key Insight: Fiserv received the highest traditional value score (26 points) among the five top-scoring names on the December value lens. This is a company trading at distressed valuations despite maintaining profitable operations.
2. Quality Metrics: 16/35 points
Here's where the crash shows impact, but the business isn't broken:
ROE: 13.97% (scored 6/15 points on returns): Interestingly, Fiserv's current return on equity of 13.97% is actually higher than recent years (11.57% in 2024, 10.28% in 2023, 8.21% in 2022). The business remains profitable and is generating acceptable returns on equity. While this is down from the exceptional 2017-2018 levels of 45-52%, current ROE demonstrates that the core business model still works.
ROIC: Return on invested capital matches the 2024 level of 8.70% and is higher than 2023 (6.94%) and 2022 (5.31%). The positive ROIC indicates the company continues to generate returns above its cost of capital.
Financial Health: 6.4/16 points: The balance sheet metrics show some pressure but remain manageable. The Current Ratio of 1.08 provides adequate liquidity to meet short-term obligations. Debt-to-Equity of 1.20 is elevated but reasonable for a financial services company with predictable cash flows. Interest Coverage of 4.21x demonstrates a comfortable ability to service debt: the company earns more than 4x its interest expense.
Profitability: 3.2/4 points: Net Margin of 17.05% shows strong profitability has been maintained despite operational challenges. The company converts 17 cents of every revenue dollar into profit, a healthy margin for the fintech industry. FCF Yield of 17.78% is exceptional: this means the company generates free cash flow equal to nearly 18% of its market cap annually, demonstrating robust cash generation.
Key Insight: The quality scores are lower than peak levels, but they show a profitable, cash-generating business, not a company in terminal decline. The fundamentals took a hit, but they didn't collapse. Fiserv's current pillar-by-pillar breakdown is on our Quality Analysis page.
3. Growth Score: 13/15 points
Surprisingly strong given the circumstances:
Revenue Growth: 16.30% YoY (scored 10/12 points): Despite all the turmoil and guidance cuts, Fiserv is still growing revenue at 16.30% year-over-year. To put this in context, the company has grown from $5.3 billion in revenue in 2015 to $20.5 billion in 2024, a near-quadrupling driven by both organic growth and the transformative 2019 First Data merger (which took revenue from $5.8B to $10.2B). Post-merger, the company has continued expanding from $10.2B (2019) to $20.5B (2024), demonstrating successful integration and market share gains. This is critical: broken businesses don't grow at double digits. The problem wasn't that current growth disappeared; rather, management lowered expectations for future growth from 10% to 3.5-4%.
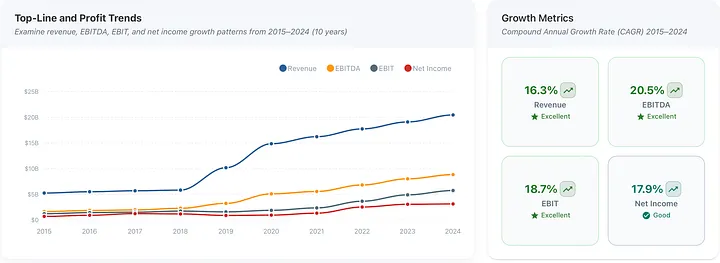
Figure 3. Consistent compounding: 16.3% revenue CAGR, 18.7% EBIT CAGR over 10 years. The market ignored it all.
FCF Trend (scored 3/3 points): Free cash flow generation tells an even more impressive story. FCF has grown from $1.0 billion in 2015 to $5.1 billion in 2024, a 5x increase. More importantly, FCF jumped 34% year-over-year from $3.8B (2023) to $5.1B (2024), demonstrating improved cash conversion even as the stock crashed. The current 17.78% FCF yield means the company generates free cash flow equal to nearly 18% of its market cap annually, an exceptional level that indicates a significant pricing disconnect between market price and intrinsic value.
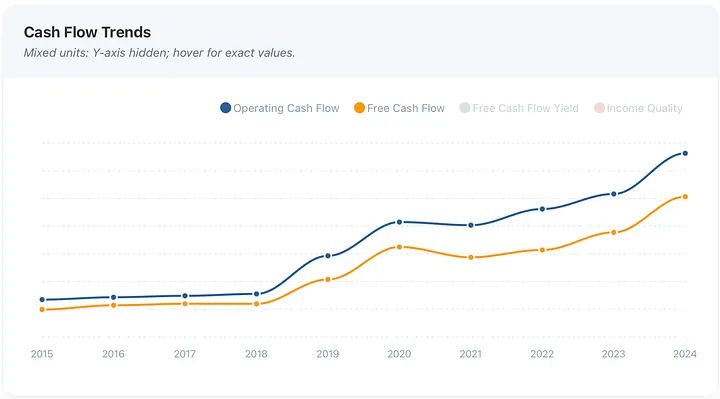
Figure 4. Cash generation machine: FCF grew from $1B (2015) to $5.1B (2024), a 5x increase in 9 years.
Key Insight: The company grew revenue from $19.1B to $20.5B (7% growth) and FCF from $3.8B to $5.1B (34% growth) in 2024. The business is not only growing but generating more cash than ever. The market panic created the opportunity.
4. DCF Analysis: 20/20 points
Our discounted cash flow model tells the most compelling story: Stockoscope's algorithm calculated an intrinsic value of $172.64 per share compared to the current price of $63.80, implying a margin of safety of 170.59%. This earned a perfect 20/20 score: 15 points for the massive upside potential and 5 points for high confidence, given the availability of historical data and estimates from 17 analysts.
What this means: if the business simply returns to normalized profitability levels, the model estimates 170% upside from current prices.
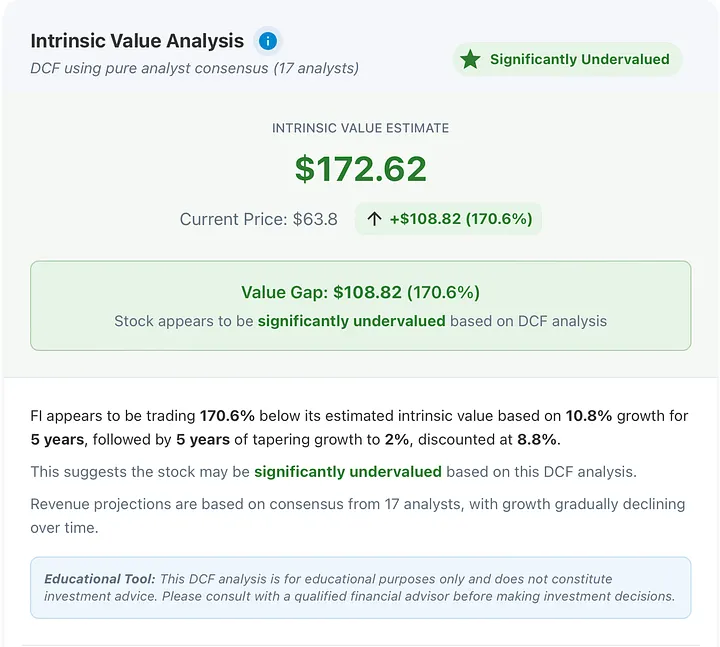
Figure 5. The math that earned our perfect 20/20 DCF score: 171% upside to intrinsic value based on analyst consensus. Run your own assumptions on our Valuation Analysis page.
The Competitive Moat Remains Intact
What our algorithm can't fully quantify, but what makes this case especially compelling:
Market Position Unchanged: Still the #1 core banking provider (serves 42% of U.S. banks and 31% of credit unions), still the #2 merchant acquirer in the U.S. (processing 41 billion transactions annually), and still the global fintech leader ranked #1 by IDC in 2025 for the third consecutive year.
High Switching Costs: Core banking systems and payment processing platforms are deeply embedded in clients' operations. The cost and risk of switching providers is enormous, creating a powerful moat that doesn't disappear because of one bad quarter.
Recurring Revenue Model: Fiserv earns transaction-based and account-based fees, creating a highly predictable revenue stream. As long as people keep using credit cards and banks keep serving customers, Fiserv makes money.
Growing Markets: Digital payments adoption is a secular trend that accelerates regardless of Fiserv's execution hiccups. The total addressable market is expanding, not contracting.
The Risk Case: Why This Could Be Wrong
Our algorithm is quantitative, but investors must consider qualitative risks:
Management Execution Risk: New CEO Mike Lyons has to prove he can fix the business. His October 2025 confession about past mismanagement doesn't inspire confidence. The company added new co-presidents and a new CFO; multiple leadership changes can be disruptive.
Structural Business Headwinds: What if the slowdown isn't just execution, but competition? Fintechs like Stripe and Square, and cloud-native providers like Temenos, are winning share with modern architectures.
Debt Levels: With a debt-to-equity ratio of 1.20, Fiserv has less financial flexibility if things worsen. Interest coverage of 4.2x is adequate but not comfortable.
Competitive Threats: FIS, Jack Henry, and Global Payments are circling. If clients lose confidence during this turbulent period, switching costs matter less.
Value Trap Possibility: Maybe the market is right. Maybe this is a slow-motion disruption story, not a temporary setback. Digital-first competitors may be structurally advantaged.
The Final Word
Our algorithm flagged a classic Benjamin Graham setup: a quality business priced below intrinsic value following execution issues and panic selling. This is what value investing is about: buying dollars for fifty cents. At $63.80, you're paying 9.2x earnings for a business that historically traded at 20-25x, 1.3x book value for a business with significant intangible assets, and 7x EV/EBITDA for the global leader in financial technology infrastructure.
The market is pricing Fiserv as if the business is permanently impaired. Our analysis estimates the price sits below intrinsic value, consistent with an overreaction to fixable execution problems.
Can it drop further? Absolutely. At 9.23x earnings, the stock could theoretically fall to 6-7x P/E (around $40-50) in a worst-case panic scenario. Value stocks can stay below the model's intrinsic-value estimate for extended periods, and there's no guarantee of an immediate rebound.
However, a company that processes 41 billion transactions annually, serves 42% of U.S. banks, generates 17% net margins and 18% FCF yields, and still grows revenue at 16% should not stay at 9x earnings forever, unless something is fundamentally broken.
The next 6-12 months will tell the tale. If new management executes even reasonably well, the gap between price and the model's intrinsic-value estimate could close. If they stumble further, we'll learn expensive lessons about catching falling knives.
Want to see how our algorithm works? Check out our methodology blog on how we automated Benjamin Graham's principles to systematically score companies on value.
Want to build and explore your own value score? Visit the Strategies page of our platform.
This article was originally published on Medium on 3 December 2025. All data, prices, and results reflect information available at the time of publication. We have retained the original publication date on this platform for consistency.
Disclaimer: This analysis is for educational purposes only and does not constitute investment advice. Our algorithm is a quantitative screening tool based on historical financial data and does not account for qualitative factors, competitive dynamics, or future events. Past performance does not guarantee future results. Fiserv represents a higher-risk value opportunity due to recent execution issues and management changes. Investors should conduct their own due diligence and consider their risk tolerance before investing.
Data Source: Stockoscope proprietary value screening algorithm (December 2025 run). Scoring Methodology: 100-point system across Traditional Value (30), DCF Validation (20), Quality Metrics (35), and Growth (15). Analysis Date: 1 December 2025. Price as of Analysis: $63.80.