
Separating Value Stocks from Value Traps: Lessons from REGN's Earnings Beat
A data-driven approach to separating durable value stocks from value traps.
Yesterday, Regeneron Pharmaceuticals (REGN) crushed earnings expectations, reporting $11.83 per share versus analyst estimates of $9.44, a 25% beat that sent the stock up 11% in a single day.
This outcome highlights a fundamental challenge in value investing: how do you systematically separate genuine value opportunities, such as REGN, from value traps? The answer lies in understanding what traditional metrics miss, and what additional filters can dramatically improve your success rate.
The Starting Point: Traditional Value Metrics (And Why They're Not Enough)
Every value investor starts with the same playbook:
- Screen for low P/E ratios
- Look for low Price-to-Book multiples
- Check EV/EBITDA relative to peers
Run these screens and you'll get a list of "cheap" stocks. The problem? Half might be genuinely undervalued companies temporarily out of favor. The other half are value traps: stocks that are cheap for very good reasons like deteriorating margins, unsustainable debt levels, or dying business models.
Here's the challenge: a stock trading at 6x earnings because it's headed toward bankruptcy shows up on the same screener as a stock trading at 6x earnings because the market temporarily mispriced it. Traditional valuation metrics alone cannot distinguish between the two.
We've all experienced this. You find what looks like a bargain: 8x earnings, solid dividend yield, trading below book value. Six months later, you're down 30% and realize the low valuation was a warning sign, not an opportunity.
So what separates value stocks from value traps? Three additional filters.
The Three Differentiators
1. DCF Analysis: Are There Real Cash Flows?
Traditional metrics tell you the current price. Discounted cash flow analysis tells you if there's actual value being created, and more importantly, if that value creation is sustainable.
When a stock shows 50%+ upside to its intrinsic value based on cash flow projections, even if DCF assumptions prove overly optimistic by 30%, there's still a meaningful cushion. This isn't about achieving false precision with DCF models. It's about ensuring enough room for error to generate positive returns even when some assumptions prove wrong.
Value traps often reveal themselves through DCF analysis. That "cheap" P/E ratio exists because future cash flows are deteriorating or becoming less certain. A robust DCF analysis exposes these weaknesses before they show up in the rear-view mirror metrics of traditional valuation multiples.
2. Quality Assessment: The Real Differentiator
This is where value stocks and value traps truly diverge.
Returns on Capital (ROE and ROIC)
A company generating 15%+ return on equity (ROE) while trading at a discount is fundamentally different from a company with 2% ROE at the same valuation. The former demonstrates pricing power, competitive advantages, and efficient capital allocation. The latter is barely covering its cost of capital and likely trapped in a commoditized, low-return business.
Return on invested capital (ROIC) adds another layer by showing how efficiently management deploys all capital, not just shareholder equity. Companies that consistently generate high ROIC have structural advantages that protect them during downturns and position them for superior long-term performance.
The Profitability Foundation
Quality assessment should start with a fundamental requirement: the company must actually be profitable. The focus should be on identifying profitable companies temporarily trading below intrinsic value, not on betting that broken businesses will fix themselves. Value traps typically exhibit weak or deteriorating quality metrics, which is why this filter is so effective.
Margin Sustainability
Are the profits real, recurring, and sustainable? Net profit margins reveal whether the business model genuinely works or if the company is barely profitable. Sustainable margins above industry averages indicate pricing power and operational excellence. Thin or deteriorating margins often signal commoditization, intense competition, or structural problems with the business model.
Balance Sheet Strength
Can the company weather an economic storm? This is where many value traps are exposed. Three critical metrics matter:
Current ratio: Measures short-term liquidity. A ratio of 4:1 means the company has $4 of liquid assets for every $1 of near-term obligations: fortress-like safety. A ratio of 0.8:1 means they're one hiccup away from a liquidity crisis.
Debt-to-equity: Shows financial leverage and risk. A ratio of 0.10 indicates minimal debt and maximum financial flexibility. A ratio of 3.0 indicates that the company is overleveraged and vulnerable to business disruptions.
Interest coverage: Reveals whether the company can comfortably service its debt. High coverage ratios indicate safety; low ratios signal distress.
3. Growth Sustainability: Avoiding the Melting Ice Cube
Here's what many traditional value investors miss: you don't want zero growth; you want sustainable growth. A company in terminal decline might look statistically cheap on a P/E basis today, but it's getting cheaper for a reason as the business is shrinking. Growth sustainability focuses on two key areas:
Revenue Growth Trajectory: The goal isn't chasing hypergrowth or momentum stocks. It's simply ensuring the business isn't in structural decline. Modest, sustainable revenue growth indicates healthy demand for the company's products or services. Declining revenues often signal loss of market share, technological obsolescence, or changing customer preferences.
Free Cash Flow Trends: Are they converting reported earnings into actual cash? This distinction matters enormously. Some companies report accounting profits while burning cash operationally. Free cash flow trends reveal the truth about business quality and sustainability.
The goal isn't to find the next 50% revenue grower. It's to avoid buying a melting ice cube, a business whose economics are deteriorating even as the P/E ratio looks attractive.
Putting It Into Practice: A Systematic Framework
The principles discussed above, combining traditional value metrics with quality assessment, cash flow analysis, and growth sustainability, echo Benjamin Graham's foundational work on intelligent investing. Graham taught us to seek a margin of safety and focus on business fundamentals, not market sentiment.
After years of testing these concepts, we developed a quantitative framework that systematizes this approach. The framework scores stocks across all four dimensions with specific weightings:
- Traditional Value Metrics: 30%: The starting point for identifying candidates
- DCF Analysis: 20%: Ensuring real cash flows with a margin of safety
- Quality Assessment: 35%: The largest weight, because this is where value traps are exposed
- Growth Sustainability: 15%: Avoiding terminal decline
The system analyzes over 1,500 stocks monthly (S&P 500, 400, and 600), requiring profitability thresholds before any stock qualifies, then scoring each across these four pillars. Stocks are ranked on a 100-point scale, with sector diversification limits to manage concentration risk.
Quality receives the highest weighting intentionally. This is where the separation between value and value traps becomes most apparent. You can have attractive traditional metrics and even reasonable DCF projections, but if quality metrics are weak, you're likely looking at a trap.
REGN scored 90/100 in our September framework and maintained that exact score in October. We've documented our complete methodology, including REGN's strong September value score, in our framework deep dive.
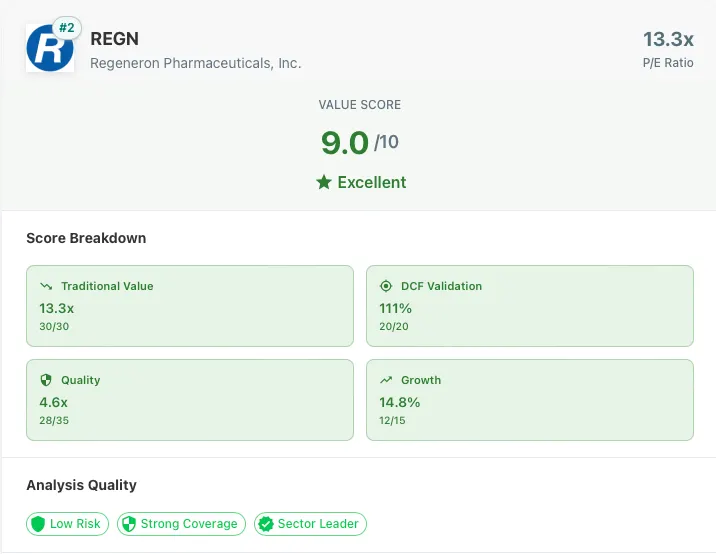
Figure 1. Our Value Framework scored REGN second on the value lens for two consecutive months, before it surged 11% in a single day following its earnings beat.
The REGN Case Study: How It All Came Together
Two months ago, Regeneron was under pressure from concerns about competition facing its flagship Eylea franchise. The stock had been declining, and sentiment was negative. Traditional value screens would have flagged it: P/E of 13.25, quite cheap for a biotech company with REGN's profile.
But was it a value trap or genuine value? Let's examine it through the three differentiators:
DCF Analysis: Massive Margin of Safety
Discounted cash flow analysis calculated a fair value of $1,186 per share versus a market price of $562, indicating 111% upside potential. Even if this DCF proved significantly optimistic, the margin of safety was enormous. The market was pricing in catastrophic outcomes; the fundamentals suggested much better scenarios.
Quality Metrics: Fortress-Like Fundamentals
Returns on Capital:
- ROE of 15.1%: Demonstrating efficient capital deployment and strong underlying profitability, well above the threshold that separates quality businesses from mediocre ones
- ROIC of 10.5%: Solid returns on all invested capital, indicating sustainable competitive advantages
Profitability and Margin Sustainability:
- Net margin of 31.4%: Exceptional profitability showing the business model works extremely well, with pricing power and operational excellence
- FCF yield of 6.6%: Strong free cash flow generation relative to market cap, confirming that profits convert to actual cash
Balance Sheet Strength:
- Current ratio of 4.6: Fortress balance sheet with overwhelming liquidity: $4.60 in liquid assets for every $1 of near-term obligations
- Debt-to-equity of 0.09: Virtually no debt, providing maximum financial flexibility and eliminating financial risk
- Interest coverage of 108x: The company generates 108 times more operating income than needed to cover interest expenses, essentially no debt burden whatsoever
These aren't just numbers on a spreadsheet. They're signals that when a company reports earnings, it has the financial flexibility to beat expectations and invest in growth simultaneously.
Growth Sustainability: Not a Melting Ice Cube
14.8% revenue growth: Solid, sustainable growth trajectory showing the business was expanding, not contracting, despite competitive concerns
This was clearly not a value trap. It was a high-quality company temporarily mispriced by a market overly focused on one competitive threat while ignoring the broader business strength.
The Traditional Value Metrics
And yes, traditional metrics looked attractive too: P/E of 13.25, reasonable P/B, and compelling EV/EBITDA. These metrics identified REGN as a candidate worth investigating. The three differentiators suggested our model estimated it priced below intrinsic value, not a trap.
The Result
The framework scored REGN second on the value lens for two consecutive months (September and October) with a score of 90/100. In the 28 days from the October score, its price has struggled to rise. Then came yesterday's earnings beat: an additional 11% in a single day.
When companies possess these fundamental characteristics (strong cash flows, quality operations, and sustainable business models), they don't stumble into earnings beats by accident. They execute consistently because the underlying business quality drives performance.
Traditional Value Metrics: The Starting Point, Not the End Point
To be clear: traditional valuation metrics still matter. Evaluating P/E relative to sector and historical norms, Price-to-Book multiples, and EV/EBITDA compared to peers remains essential.
The key is applying sector context. A P/E of 15 might be expensive for utilities but cheap for biotech. A P/B of 3.0 might be reasonable for asset-light software businesses but expensive for capital-intensive industrials.
But these metrics are the starting point, not the ending point. They identify candidates for deeper analysis. The three differentiators (DCF, quality, growth) identify which candidates are actually worth buying.
In the systematic framework, traditional metrics receive 30% of the total weight, appropriately balanced with the other three components.
The LEN Story: Same Framework, Same Result
Our top-scoring August value name tells a similar story. Lennar Corporation (LEN) scored 88/100 with an 80% margin of safety. Like REGN, it earned perfect scores on traditional value (30/30) and DCF validation (20/20).
Trading at just 7.7x earnings with a P/B of 1.34, LEN was absurdly cheap for a homebuilder with 15.6% ROE, a current ratio of 3.65, and minimal debt. Our DCF valued it at $204 versus a market price of $116.
A few weeks after LEN's August score, Berkshire Hathaway disclosed a position. In the 89 days since, the stock has gained over 10%.
The pattern is clear: identify quality companies at attractive prices, and the market eventually recognizes what the numbers were saying all along.
The Systematic Advantage
What separates our approach from gut-feel investing or single-metric screening?
-
Comprehensive Analysis: We evaluate nine core metrics across 1,500+ stocks monthly. No stone goes unturned.
-
Consistency: Human biases don't enter the equation. The same rigorous criteria apply to every stock, every month.
-
Risk Management: By requiring strong profitability and financial health, we automatically filter out most value traps. We also enforce sector diversification (maximum two stocks per sector).
Transparency: Our methodology is published and systematic. No black boxes, no after-the-fact rationalizations.
The Reality Check
Not every high-scoring name is a winner. That's not how markets work. Some stocks the framework scored highly haven't performed well over these three months. Value investing requires patience, and three months is barely enough time to assess any investment thesis.
But what matters is the systematic process over time. In this instance, a high-scoring name later attracted interest from Berkshire Hathaway, which disclosed a position in LEN.
The Broader Lesson
Value traps and value stocks look virtually identical on traditional screeners. Both show low P/E ratios, depressed price-to-book multiples, and seemingly low valuation multiples. The difference emerges when you dig deeper.
The three additional filters work together:
-
DCF Analysis reveals whether there are real, sustainable cash flows with a meaningful margin of safety
-
Quality Assessment separates well-run businesses from deteriorating ones through returns on capital, balance sheet strength, and margin sustainability
-
Growth Sustainability ensures you're not buying terminal decline disguised as value
When all four components align (traditional value metrics plus these three differentiators), you're not gambling on mean reversion or hoping for sentiment improvement. You're systematically identifying quality businesses trading at meaningful discounts to intrinsic value.
That's when probabilities stack in your favor. That's when earnings beats become less surprising and more inevitable. And that's how you build a value investing approach that compounds wealth over time while avoiding the traps that ensnare purely quantitative, metric-driven strategies.
The next time you find a stock trading at an attractive valuation multiple, ask yourself:
-
Does it have sustainable cash flows with a margin of safety? (DCF)
-
Does it demonstrate quality through returns on capital, balance sheet strength, and margins? (Quality)
-
Is the business sustainable or in terminal decline? (Growth)
If the answer to all three is yes, you might have found genuine value. If any answer is no, you might be looking at a value trap.
The market will occasionally misprice quality companies. When it does, and when you have the systematic filters to identify those opportunities, that's when superior long-term returns become possible.
Our value framework evaluates US stocks on a 100-point scale across traditional value, DCF analysis, quality metrics, and growth sustainability. You can build and explore your own value score, with detailed scoring breakdowns, on the Strategies page of the platform.
This article was originally published on Medium on 29 October 2025. All data, prices, and results reflect information available at the time of publication. We have retained the original publication date on this platform for consistency
Disclaimer: This article is for informational purposes only and does not constitute investment advice. All investments involve risk, including potential loss of principal. Past performance is not indicative of future results. The stocks and strategies discussed should not be considered recommendations to buy or sell any security. Performance data represents historical results that may not be repeated. Individual circumstances vary, and investors should conduct their own research and consider consulting a qualified financial advisor before making investment decisions. The authors may hold positions in the securities discussed. Market conditions change, and strategies that performed well historically may not perform similarly in the future.