
The River of Money: How Apple's Revenue Flows to the Bottom Line
Apple made $112 billion in profit last year. But most people never see the journey that $416 billion in revenue takes as it flows through the business. We built a visualization to trace every dollar.
Apple made $112 billion in profit last year. To put that in perspective: Apple's net income alone exceeds the total annual revenue of hundreds of Fortune 500 companies. But here's what most people don't see: the journey that $416 billion in revenue takes as it flows through Apple's business, getting carved up by manufacturing costs, research budgets, marketing spend, and taxes before landing as profit.
We built an interactive diagram to visualize this exact journey. What we discovered surprised us, and it might change how you think about Apple's business model.
The Visualization
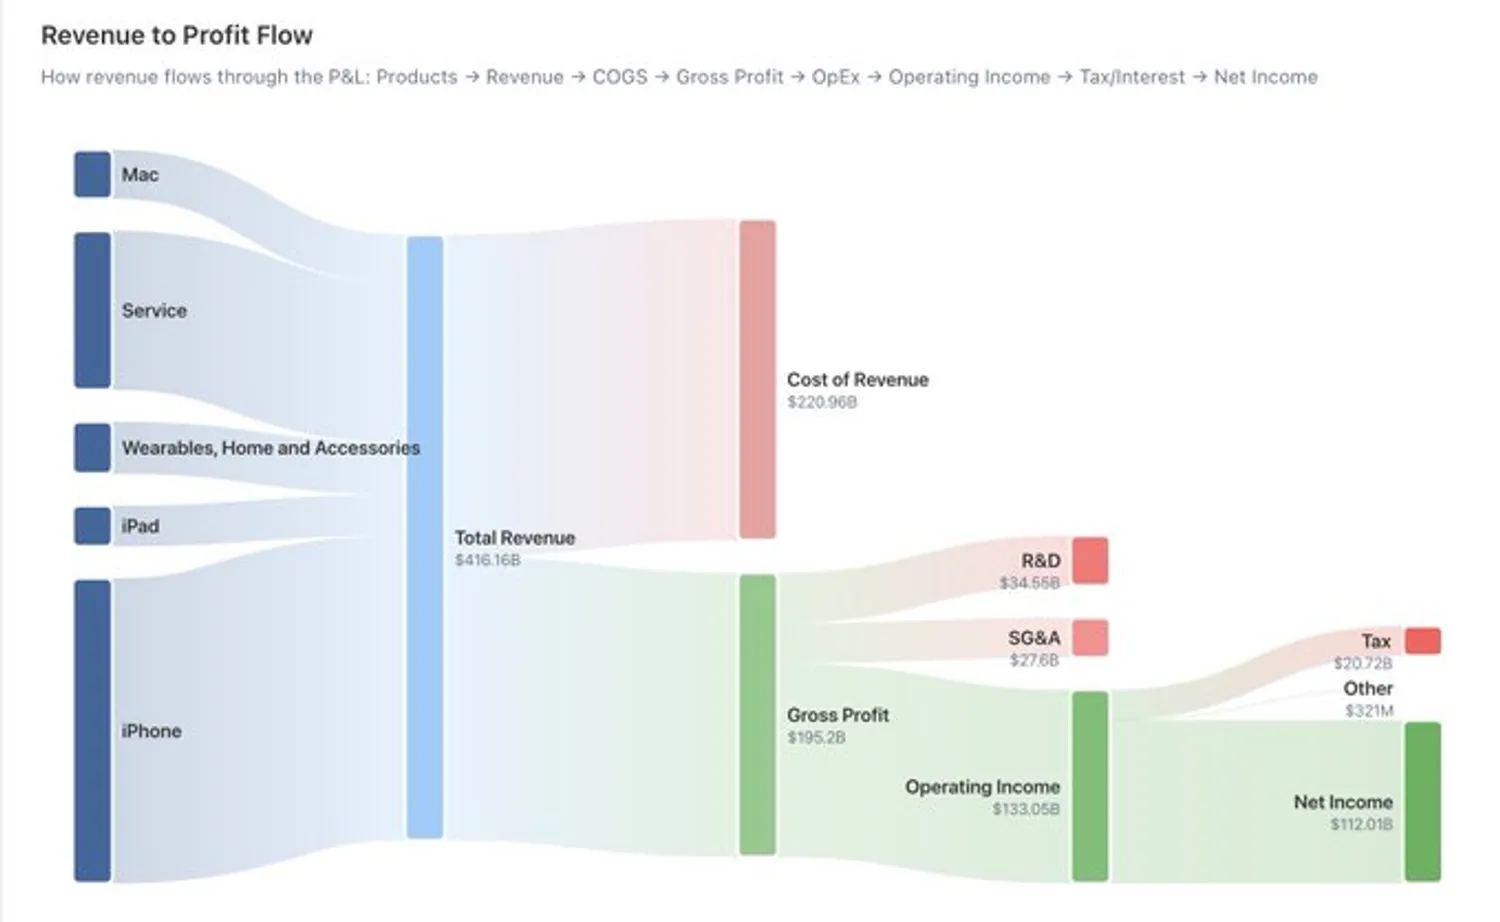
Figure 1. The iPhone's $200B revenue stream drives Apple's profit machine. This Sankey diagram reveals how 47% gross margins and disciplined operating expenses convert $416B in revenue into a stunning $112B profit.
This diagram traces every dollar from its source (iPhone, Services, Mac, etc.) through Apple's complete profit and loss statement. The width of each flow represents the dollar amount, and the colors follow a simple logic: Blue = Revenue streams, Red/Pink = Expenses, Green = Profit.
If you're new to reading these diagrams, our guide Reading the Money Map: How to Analyze Any Company's Profit Flow explains the methodology in detail.
Let's walk through what this reveals.
Layer 1: The iPhone Still Rules Everything
The first thing that jumps out: iPhone dominates at roughly 50% of total revenue. Despite years of "Apple is diversifying" headlines, despite the explosive growth of Services, despite new product categories like AirPods and Apple Watch, the iPhone remains the gravitational center of Apple's solar system.
This creates both Apple's greatest strength and its biggest vulnerability. On one hand, the iPhone is a money-printing machine with industry-leading margins. It's the entry point to Apple's ecosystem and the platform that makes Services revenue possible. On the other hand, the smartphone market is maturing. Global smartphone shipments have been flat to declining for years. If iPhone revenue dropped just 10%, that's a $20 billion hole to fill, larger than the entire revenue of many companies.
Layer 2: The 47% Gross Margin Mystery
Apple takes in $416 billion in revenue. After subtracting the Cost of Revenue ($221B), they're left with $195 billion in Gross Profit. That's a 47% gross margin. For a company that manufactures and ships physical hardware products (phones, laptops, tablets), a 47% gross margin is extraordinary.
The visualization makes this tangible: that massive green "Gross Profit" bar shows that Apple keeps nearly half of every dollar that comes in. Before they've paid for R&D, marketing, retail stores, or anything else.
Layer 3: Where the Money Goes
From that $195B in gross profit, Apple has to fund operations. This is where we see their strategic priorities:
- Research & Development: $34.5B
- SG&A: $27.6B - retail stores, marketing, and overhead
- Other Operating Expenses: $99.3B - various operational costs
Operating Income: $133B (32% operating margin)
This is where Apple's business model truly shines. A 32% operating margin means for every $100 in revenue, $32 becomes operating profit (before interest and taxes). Apple sits in the elite tier of operating efficiency alongside Microsoft.
Layer 4: The Tax Man Cometh
From that $133B in operating income, Apple faces income tax of $20.7B (effective tax rate of ~18.5%), interest expense of $2.4B, and other non-operating items of $321M. After all deductions:
Net Income: $112B (27% net margin)
$112 billion in profit. On $416 billion in revenue. A 27% net margin.
This is the holy grail of business: massive scale combined with exceptional profitability.
Geographic Lens: Americas Dominance with China Risk
The same P&L can be viewed through a different lens. While product segmentation reveals what Apple sells, geographic segmentation shows where the money comes from. And this tells an equally important story.
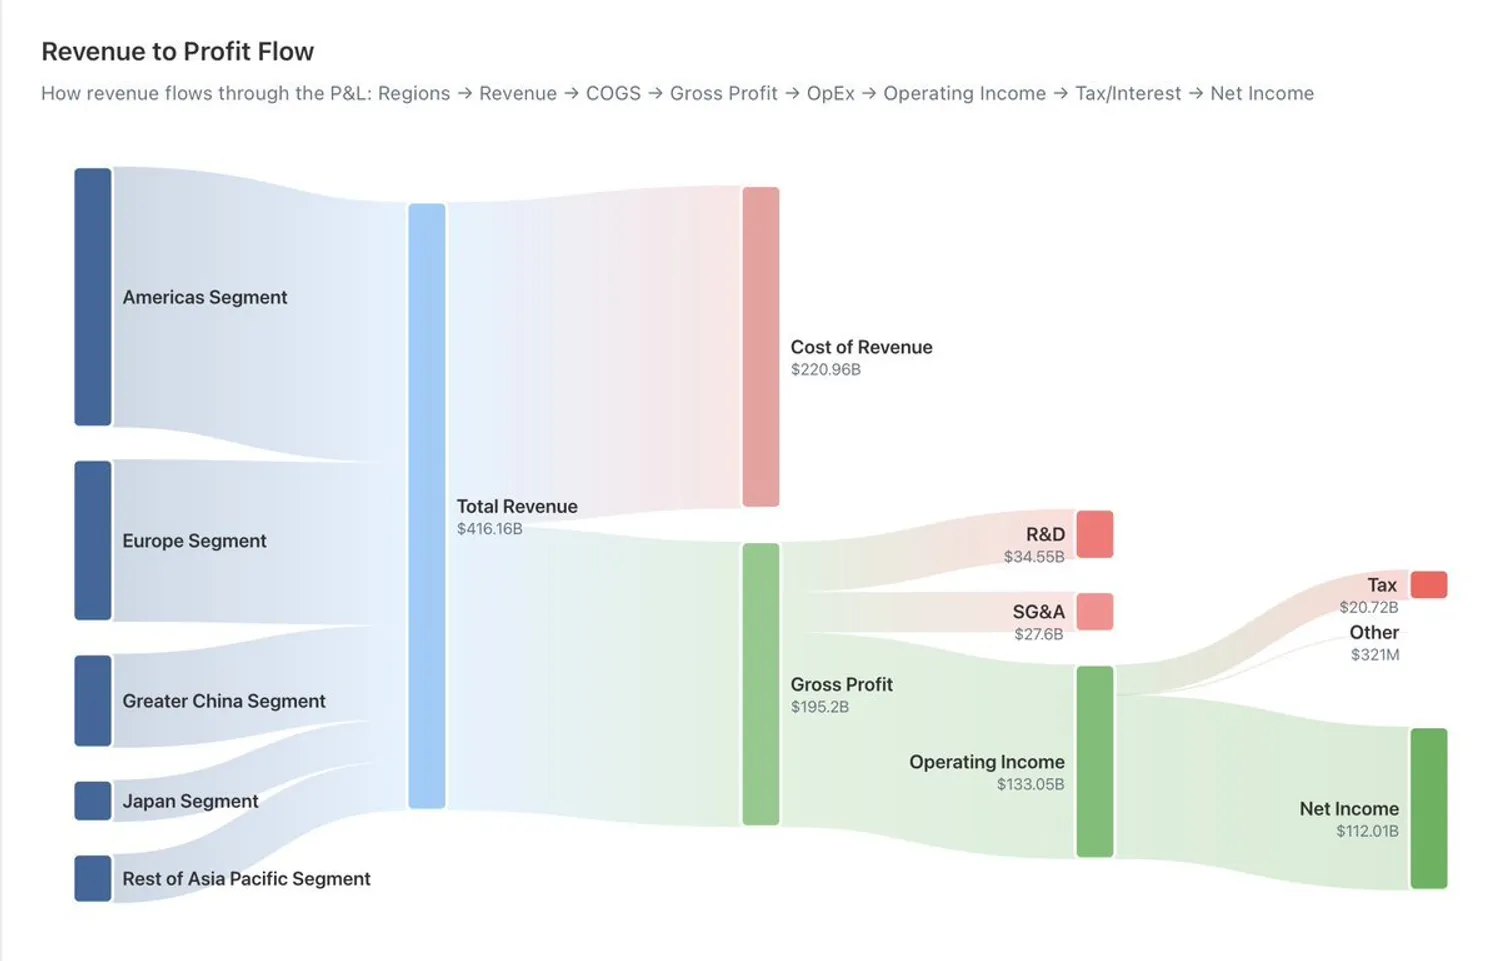
Apple's geographic revenue breakdown: The Americas lead, followed by Europe and Greater China.
The Americas segment (primarily the US) generates the largest revenue flow, representing Apple's home market strength. Europe contributes significantly as Apple's second-largest market. But notice the Greater China segment, a substantial flow that represents both enormous opportunity and significant geopolitical risk.
The relatively smaller Japan and Rest of Asia Pacific segments suggest room for growth in developing markets, though penetration in price-sensitive regions remains challenging given Apple's premium positioning.
What This Tells Us About Apple's Moat
Warren Buffett (Berkshire Hathaway is one of Apple's largest shareholders) talks about economic "moats", i.e., sustainable competitive advantages that protect a company's profits. This visualization reveals Apple's moat in stark detail:
Brand Power (Visible in Pricing): The 47% gross margin exists because people choose to pay premium prices. They're not forced to buy Apple but they want to.
Ecosystem Lock-in (Services Growth): Services revenue ($96B) is largely tied to the iPhone user base. Once you're in the Apple ecosystem (iMessage, iCloud, App Store), switching costs are high. This creates recurring, high-margin revenue.
Operational Excellence (High Operating Margins): Apple's supply chain management, manufacturing efficiency, and operational discipline allow them to maintain 32% operating margins at massive scale. This is incredibly difficult to replicate.
Innovation Investment (R&D Spending): That $34.5B in R&D maintains the moat. It funds the next generation of products that will keep customers loyal and justify premium pricing.
Curious to explore this visualization interactively or see similar breakdowns for other companies? We've built it into our Company Overview, with coverage for most S&P 1500 companies.
This article was originally published on X on 23 January 2026. All data, prices, and results reflect information available at the time of publication and have not been updated. We have retained the original publication date on this platform for consistency.
All financial data sourced from Financial Modeling Prep API, based on Apple's FY2025 10-K filing.
This is not investment advice. Do your own research before making investment decisions.