
The Crossover Signal: When Quality Stocks Become Value Opportunities
How our dual-algorithm approach identified Adobe at the intersection of business excellence and market mispricing.
This month, something unusual happened across our scoring lenses. Adobe (ADBE) scored highest on the quality lens and high on the value lens simultaneously. This crossover demanded investigation.
Quality stocks trade at premium valuations. Value stocks often fail quality filters. When both frameworks identify the same company, it means either a quality business has become temporarily mispriced, or a value stock has demonstrated the sustained profitability and financial strength that our quality framework requires.
The Adobe case study demonstrates how our dual-algorithm methodology works in practice, using systematic analysis to confirm when both business quality and valuation alignment exist simultaneously.
Two Frameworks, One Stock
Our investment platform runs three independent scoring algorithms each month: quality, value, and dividend frameworks. This case study focuses on the convergence between our quality and value frameworks, both designed to capture different market inefficiencies.
The quality algorithm uses two scoring components: a pillar score measuring absolute business quality across 10 financial dimensions (returns, margins, cash flow, growth, operational efficiency, leverage, liquidity, per-share metrics, valuation, and dividends), and a peer score measuring relative performance against sector competitors using the same 10 pillars on a percentile basis. In addition, companies must pass at least three of five validation checks (DCF valuation, analyst upside, financial health scores, buy consensus, and positive institutional flows) before scoring among the highest on the lens.
The value algorithm aims to implement Benjamin Graham's principles through a 100-point framework that converts to a 0-10 scale. Before any scoring begins, companies must pass profitability gates requiring positive return on equity and net profit margins. The scoring then evaluates traditional value metrics (30 points), DCF validation (20 points), quality assessment (35 points), and growth consistency (15 points).
These frameworks do not converge often. Quality stocks like Microsoft and Apple consistently pass quality filters but fail value screens due to premium valuations. Value stocks often show attractive price ratios but fail quality gates due to inconsistent profitability or weak balance sheets.
When a stock tops both lenses at once, it is worth a closer look. For complete methodology details, see our previous publications on Quality Score Methodology and Value Score Methodology.
The Quality Recognition: What the Data Revealed
Our quality framework analyzes 10 years of financial history (2015-2024) using dual scoring: pillar scores measure absolute business quality while peer scores measure relative performance against 79 Technology sector companies. Adobe's overall scores (4.03/5 pillar, 4.18/5 peer) reflect sustained excellence from both perspectives.
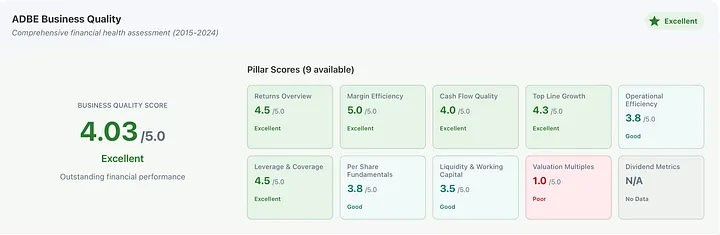
Figure 1. What 'Excellent' business quality looks like: Adobe scores 4.0+ on 6 of 9 pillars measured across 10 years (2015-2024), with perfect margin efficiency (5.0) and strong leverage management (4.5).
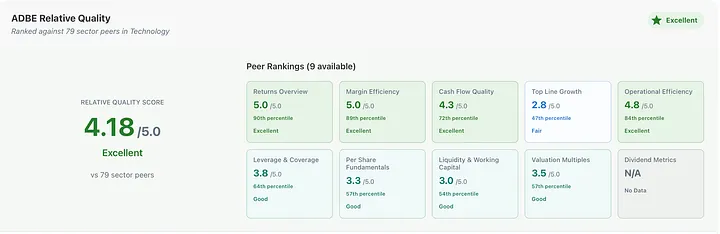
Figure 2. Adobe's peer score of 4.18/5 ranks it 'Excellent' against 79 tech sector companies, with top-decile performance in returns (90th percentile) and margins (89th percentile)
Margin Efficiency: Perfect Performance
Pillar Score: 5.0/5 | Peer Score: 5.0/5 (89th percentile)
Adobe's profitability metrics rank at the absolute top tier in both systems. Over the past decade, gross profit margins averaged 86-89%, operating margins expanded from 19% in 2015 to 31% by 2024, and net profit margins climbed from 13% to 26%. The most recent trailing twelve months show gross margins of 89%, EBITDA margins of 41%, and net margins of 30%.
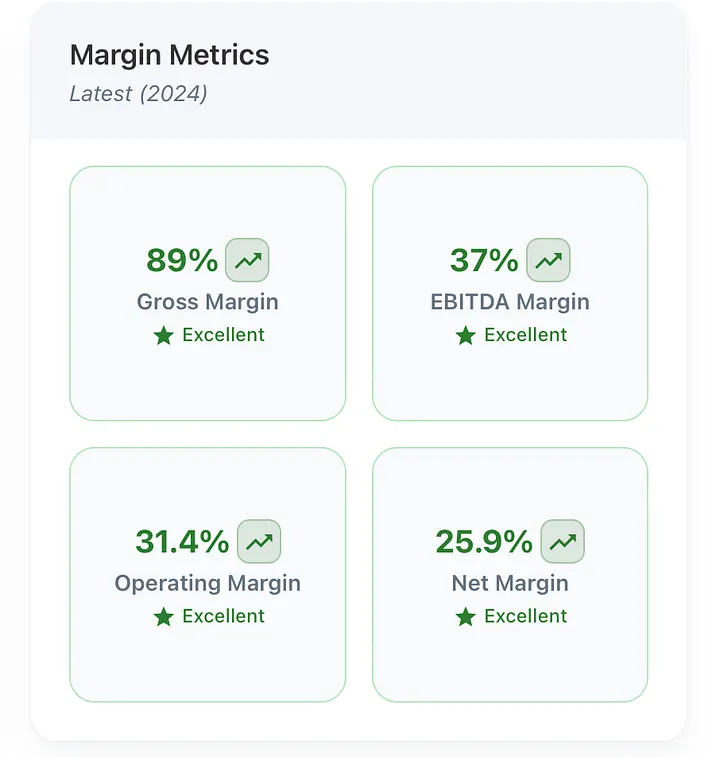
Figure 3. Adobe's margins remain best in class across every measure, reflecting strong pricing power and operational discipline.
These absolute margins earned perfect pillar scores, and peer comparison confirmed they're exceptional even within the Technology sector. Adobe ranked in the 99th percentile for gross margins (pricing power exceeds nearly all tech companies), 83rd percentile for EBITDA margins, 88th percentile for operating margins, and 85th percentile for net margins. Few technology companies achieve this combination of profitability across all levels.
Returns Overview: Elite Capital Efficiency
Pillar Score: 4.5/5 | Peer Score: 5.0/5 (90th percentile)
Adobe's capital deployment efficiency strengthened dramatically over the decade. Return on equity grew from 9% in 2015 to 39% in 2024, while return on invested capital expanded from 7% to 25%. Return on assets nearly quadrupled from 5% to 18%. The most recent trailing twelve months show even stronger performance: 55% ROE, 35% ROIC, 43% ROCE, and 24% ROA.
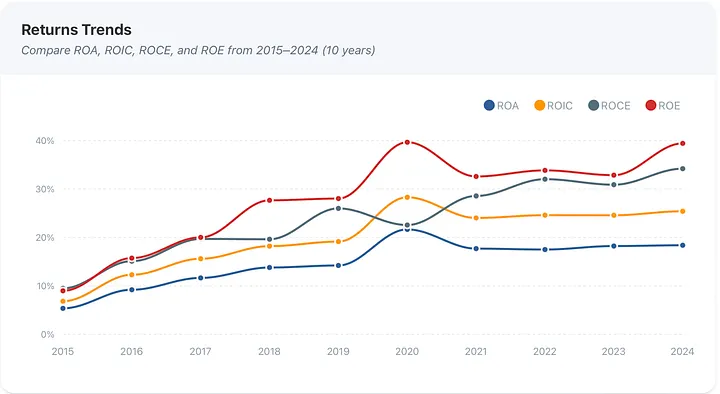
Figure 4. Return metrics from 2015 to 2024 show a clear upward trend, highlighting improving efficiency and profitability.
While these absolute returns earned 4.5/5 in pillar scoring, peer ranking reached a perfect 5.0/5 because they exceed nearly all tech competitors. Adobe ranked in the 83rd percentile for ROE, 92nd percentile for ROIC, 95th percentile for ROCE, and 91st percentile for ROA. The peer score exceeded the pillar score because Adobe's strong absolute performance looks even better when compared directly against sector peers, placing it in the top decile for capital efficiency.
Leverage and Coverage: Strong but Not Elite
Pillar Score: 4.5/5 | Peer Score: 3.8/5 (64th percentile)
Adobe maintains conservative leverage with strong coverage ratios. The debt-to-equity ratio remained at 0.43 in 2024, while interest coverage reached 43x (TTM), indicating no financial stress. The current ratio of 1.07 suggests adequate liquidity, though not exceptional.
Interestingly, leverage scored higher on absolute metrics (4.5/5) than peer comparison (3.8/5). The debt-to-equity ratio (46th percentile) is moderate rather than exceptionally low within tech, though 41x interest coverage (70th percentile) and negative net debt to EBITDA (95th percentile) remain strong. Many tech peers carry even less debt, lowering Adobe's relative ranking despite solid absolute metrics.
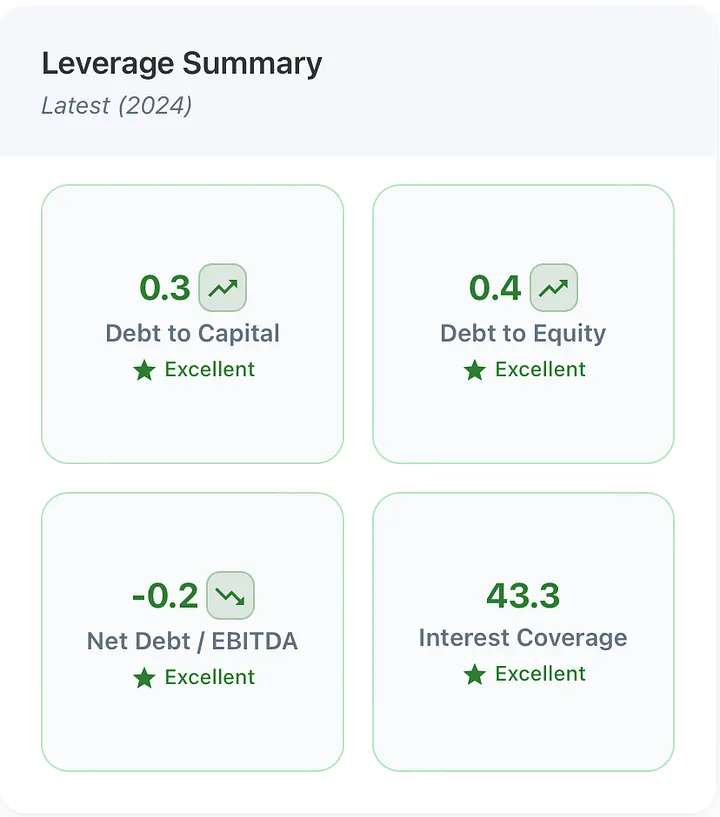
Figure 5. Adobe maintains a conservative balance sheet with low leverage and strong interest coverage, reflecting disciplined financial management.
Operational Efficiency: Better Than It Looks
Pillar Score: 3.8/5 | Peer Score: 4.8/5 (84th percentile)
Adobe's operational metrics appeared solid but not exceptional in isolation: asset turnover and working capital management earned 3.8/5 on absolute scoring. However, peer comparison revealed these metrics outperform most competitors, jumping to 4.8/5 (84th percentile overall).
Asset turnover ranked in the 77th percentile and days sales outstanding in the 87th percentile, demonstrating that Adobe converts assets to revenue and collects receivables more efficiently than three-quarters of tech companies. The relative context elevates the assessment of what initially seemed merely adequate.
Top Line Growth: Strong Absolute, Average Relative
Pillar Score: 4.3/5 | Peer Score: 2.8/5 (47th percentile)
The largest divergence between pillar and peer scoring appears in growth. Revenue grew from $4.8 billion in 2015 to $21.5 billion in 2024, representing an 18.1% compound annual growth rate. This consistent expansion over a decade earned 4.25/5 in pillar scoring for absolute magnitude and consistency.
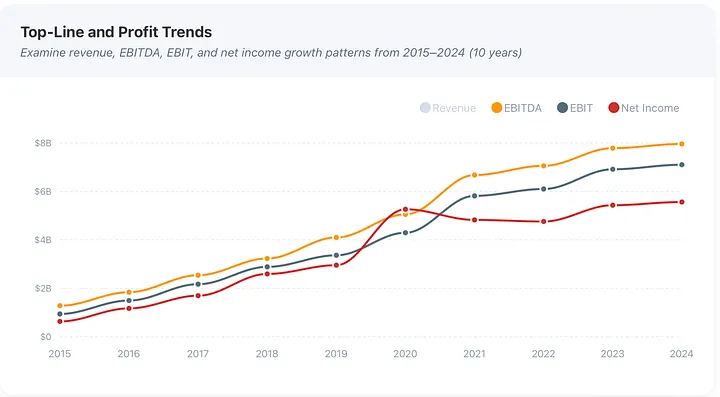
Figure 6. Adobe's revenue and profits have grown steadily over the past decade, showing consistent expansion across all major income measures.
However, peer scoring dropped to 2.75/5 (47th percentile overall) because the current TTM growth of 10.7% sits below the sector median. Revenue growth ranked 53rd percentile, EBITDA growth 49th percentile, and EBIT growth 47th percentile. The technology sector contains many higher-growth companies, making Adobe's solid absolute growth look average by comparison. This explains why Adobe's growth pillar score appears strong while the peer score falls below the median.
Cash Flow Quality: Robust Generation
Pillar Score: 4.0/5 | Peer Score: 4.3/5 (72nd percentile)
Free cash flow expanded from $1.3 billion in 2015 to $7.8 billion in 2024, with FCF yield improving to 6.6% TTM. Income quality ratios (operating cash flow relative to net income) averaged 1.4-1.7x over the decade, indicating earnings quality exceeds reported profits. Recent TTM shows 47% free cash flow growth, demonstrating accelerating cash generation.
These metrics earned 4.0/5 on absolute pillar scoring and improved slightly to 4.3/5 (72nd percentile) in peer comparison. The 6.6% FCF yield ranked 86th percentile, FCF growth 76th percentile, and operating cash flow growth 80th percentile, demonstrating superior cash generation versus most technology companies, though not quite an elite tier.
Other Pillars
Per Share Fundamentals: Pillar 3.8/5, Peer 3.3/5 (57th percentile). Revenue per share grew from $9.6 in 2015 to $48 in 2024. Strong absolute growth, but middle-of-the-pack compared to the tech sector.
Liquidity and Working Capital: Pillar 3.5/5, Peer 3.0/5 (54th percentile). The current ratio of 1.07 (25th percentile) ranks in the bottom quartile for tech, although the cash ratio (59th percentile) provides an adequate cushion.
Valuation Multiples: Pillar 1.0/5, Peer 3.5/5 (57th percentile). Adobe trades at a premium on an absolute basis but is less expensive than some tech peers, explaining the peer score improvement.
Overall Assessment
This dual-scoring system explains why Adobe scored highest on the quality lens: strong absolute business quality (4.03 pillar) combined with strong relative sector positioning (4.18 peer), with top-decile performance in returns and margins offsetting below-median growth versus high-flying tech peers. The frameworks confirmed quality from both absolute and comparative perspectives, passing all five validation checks in October 2025.
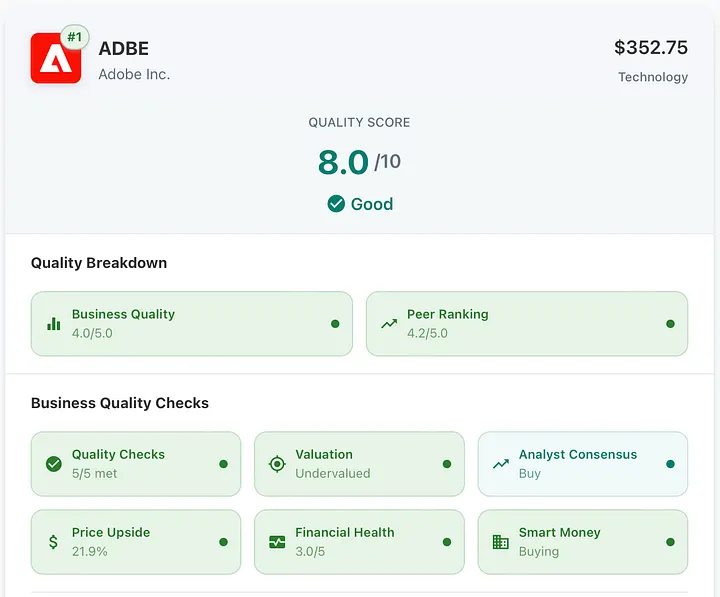
Figure 7. Our quality framework at work: dual scoring confirms Adobe's business excellence from both absolute (4.0/5 pillar) and relative (4.2/5 peer) perspectives, with all validation gates passed. Adobe's current pillar and peer breakdown is on our Quality Analysis page.
The Value Recognition: When Quality Meets Price
In October 2025, Adobe scored 86 out of 100 points in our value framework, converting to 8.6 on our 10-point scale. This surprised us because quality software companies rarely appear in value screens.
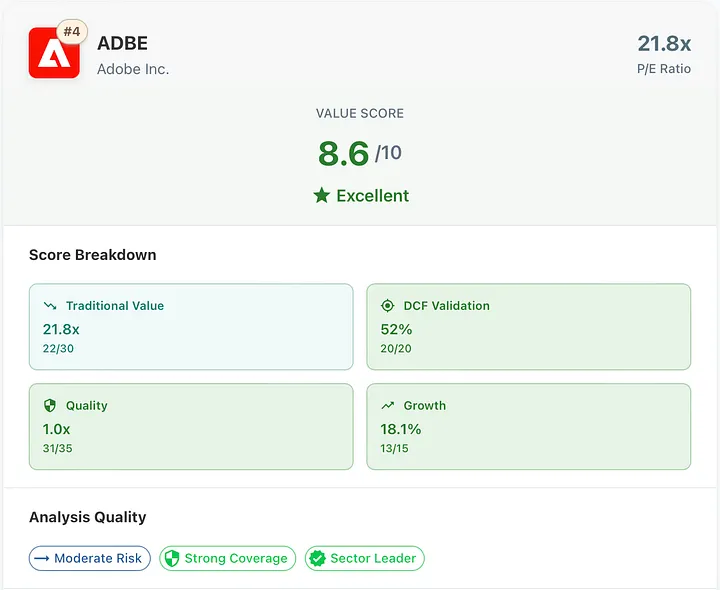
Figure 8. The value side of the crossover: Adobe earns an overall value score of 8.6 out of 10, reflecting strong fundamentals, solid growth, and an attractive valuation profile within the technology sector.
Traditional Value Metrics: 22/30 Points
Adobe's valuation picture has shifted in recent years. The company's price-to-earnings ratio, once hovering in lofty territory typical of high-growth software names, has compressed to levels that look more like a mature business. That's a notable change as it suggests investors are no longer paying a premium for perpetual hypergrowth, but instead viewing Adobe through a more grounded, value-oriented lens.
From an enterprise value to EBITDA perspective, Adobe still looks attractively priced compared to peers across the broader tech landscape. Yet, when we look at price-to-book, the numbers remain high. However, that's hardly surprising for an asset-light software company whose true worth lies in intellectual property and brand, not physical assets.
Overall, Adobe's traditional valuation metrics paint a nuanced picture: its earnings multiples suggest opportunity, while its balance-sheet-based measures reflect the nature of modern software economics more than overvaluation.
DCF Validation: 20/20 Points (Perfect Score)
Our discounted cash flow (DCF) model strongly supports the value case. The analysis suggested a sizable gap between Adobe's market price and its estimated intrinsic value, a comfortable margin of safety that gives investors room for error.
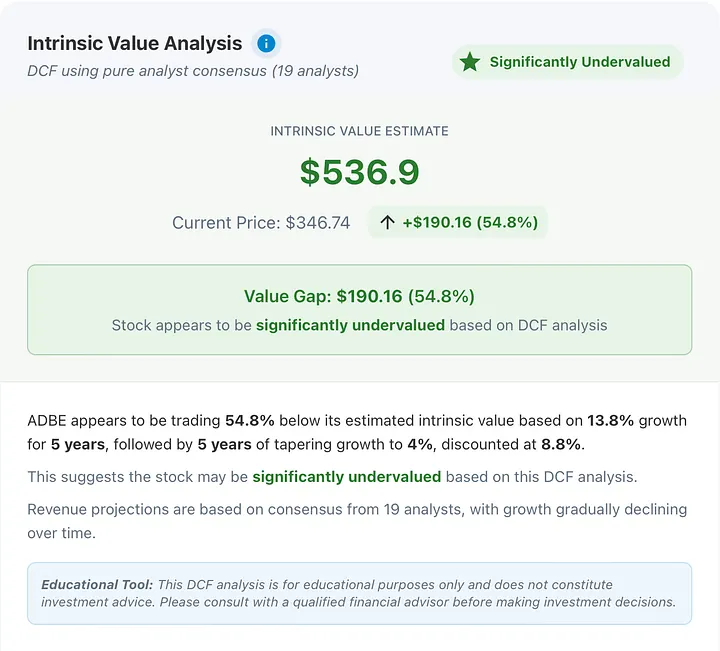
Figure 9. The DCF model estimates Adobe's intrinsic value at $537 per share, suggesting the stock is trading at a significant discount to its long-term fundamentals. The current DCF breakdown is on our Valuation Analysis page.
Quality Assessment: 31/35 Points
Adobe's financial strength remains one of its defining features. Its returns on equity and invested capital are exceptional, the kind of figures that signal a business generating real economic value rather than just accounting profits.
The balance sheet, while not flawless, is solid. Liquidity and leverage metrics suggest Adobe manages risk responsibly, with enough flexibility to handle market swings or strategic investments.
And when it comes to profitability, Adobe still operates in elite territory. Its margins reflect both strong pricing power and disciplined cost management, a combination that underscores just how durable its business model has become.
Growth Consistency: 13/15 Points
Adobe's growth story has been remarkably steady. Over the past decade, its revenues have climbed at a healthy pace, showing not just expansion but resilience: year after year of positive momentum even through shifting market conditions. That consistency is what separates enduring franchises from cyclical performers.
Free cash flow has followed a similarly impressive trajectory, expanding severalfold over the same period. It's the kind of steady financial progress that signals a well-run business, one capable of both investing in innovation and rewarding shareholders along the way.
The Scoring Insight
Adobe's 86/100 score (8.6/10) breaks down to show a quality business at compressed valuations. The algorithm lost points on P/B (asset-light model) and some financial health metrics (good but not exceptional liquidity). It earned high points on P/E, EV/EBITDA, DCF margin, returns, profitability, and growth.
This scoring pattern shows strong performance across most dimensions while being realistic about trade-offs. The value algorithm worked as designed: identifying profitable, growing companies trading below intrinsic value, while being honest about areas of concern.
The Crossover: What Two Frameworks Reveal
When a stock tops both our quality and value lenses, they're answering different questions that together paint a complete picture.
What the Quality Framework Confirmed
The quality algorithm asked: Is this a well-run business with sustainable competitive advantages? Adobe's answer was unambiguous.
The pillar analysis of 10 years of financials (2015-2024) showed consistent improvement: margins expanding from 13% to 30% net, ROE growing from 9% to 55%, revenue compounding at 18.1% annually, and free cash flow increasing from $1.3B to $7.8B. These aren't one-year flukes but sustained performance across a decade, earning a 4.03/5 score.
The peer comparison against 79 Technology sector companies revealed Adobe's competitive positioning: 90th percentile for returns on capital, 89th percentile for margin efficiency, and 84th percentile for operational efficiency. Even within the high-performing tech sector, Adobe outperforms most peers on profitability and capital efficiency.
Adobe passed all five validation checks in October 2025: DCF showed fair valuation, analysts maintained buy consensus with upside targets, financial health scores remained strong, and institutional ownership flows turned positive. The framework identified business quality from multiple angles.
What the Value Framework Added
The value algorithm asked: Is this quality business available at a reasonable price? In October 2025, the answer shifted to yes.
Traditional metrics compressed significantly: P/E ratio of 21.75 (versus historical 30-40x range), EV/EBITDA of 15.62 (well below typical software multiples). These earned high points in our traditional value scoring, with maximum points on P/E and EV/EBITDA despite a penalty on P/B ratio (expected for asset-light software).
DCF analysis calculated 52% upside to intrinsic value, earning perfect 20/20 points for margin of safety and confidence. This wasn't based on optimistic projections but considered analyst estimates with sufficient coverage passing our quality checks.
The quality assessment within the value framework (35 points possible) awarded 31/35 points: perfect scores for returns (15/15), strong scores for profitability (4/4), and good scores for financial health (12.4/16). The value algorithm's quality gates prevented this from being a "cheap for a reason" situation.
Growth consistency earned 13/15 points based on the 18.1% revenue CAGR and free cash flow expansion from $1.3B to $7.8B. Total score: 86/100 (8.6/10).
The Combined Signal
The crossover creates a specific hypothesis: a quality business experiencing temporary valuation compression rather than permanent business deterioration.
The quality framework's dual scoring (pillar + peer) confirmed Adobe's fundamentals remained strong through October 2025. Pillar scores don't change month-to-month because they reflect 10-year averages. If the business were deteriorating, we'd see declining TTM metrics feeding into lower peer scores and failed validation checks. We saw neither.
The value framework triggered when the price fell enough to compress traditional multiples while the business still passed all profitability gates and quality thresholds. The 52% DCF upside suggested the market was pricing Adobe significantly below our calculated intrinsic value.
This alignment doesn't guarantee future returns. It identifies when systematic analysis finds quality meeting value using quantifiable metrics applied consistently across all companies. The frameworks measure what exists today (exceptional profitability, strong returns on capital, robust cash generation, and compressed valuations), but they cannot predict whether quality persists or valuation compression proves warranted.
Risks to Consider
While our frameworks identified Adobe as a quality business at value prices, the market's concerns are legitimate:
AI Monetization Uncertainty: Adobe's Firefly has drawn good engagement, with billions of creations and hundreds of millions of active users, but revenue has lagged behind the hype. The company has yet to show that this wave of AI-driven creativity can translate meaningfully into dollars.
Competitive Pricing Pressure: Rivals like Midjourney and Canva are reshaping user expectations around cost and accessibility. When an upstart can charge half as much (or nothing at all) for creative tools that feel "good enough," Adobe's premium pricing starts to look more like a vulnerability than a moat.
Potential Market Disruption: There's also a paradox at play: as AI tools become more capable, they may automate portions of the creative work that Adobe's customers do for a living. If automation shrinks the creative economy itself, Adobe could face a contraction in its own addressable market.
Analyst Skepticism and Guidance Misses: Some analysts have turned cautious, citing slower free cash flow growth and emerging competition. Recent earnings guidance that fell short of expectations didn't help sentiment, sparking Adobe's sharpest one-day stock drop in years.
Ultimately, our framework measures what Adobe is today, a business that scores well on both quality and value, but it cannot forecast whether management will navigate these transitions successfully. That is the part of investing where the data ends and conviction begins.
Conclusion
Adobe scored among the highest on the quality lens for three consecutive months (August-October 2025) based on stable fundamentals: a 4.0/5 pillar score reflecting a decade of margin expansion, capital efficiency improvements, and consistent growth. In October, it simultaneously scored high on the value lens with 8.6/10 points as traditional multiples compressed while the business passed all profitability gates. The crossover signal emerged from consistent monthly evaluation applying the same criteria across all S&P 500 companies.
The dual-framework approach confirmed quality from both absolute and relative perspectives (top-decile margins and returns versus 79 tech peers), then identified when this quality became available at compressed valuations (52% DCF upside). What our algorithms cannot answer is whether Adobe successfully navigates AI monetization challenges, competitive pricing pressure, and potential market disruption. Whether temporary mispricing or permanent impairment depends on forward-looking factors our quantitative approach cannot capture.
The Adobe crossover demonstrates what disciplined analysis can achieve: identifying opportunities where business quality meets valuation compression, using quantifiable metrics rather than market sentiment, and maintaining systematic consistency when narratives create noise.
Note: You can build and explore your own quality, value, and dividend scores, with full scoring breakdowns, on the Strategies page of our platform.
This article was originally published on Medium on 7 October 2025. All data, prices, and results reflect information available at the time of publication. We have retained the original publication date on this platform for consistency.
Disclaimer: This article is for informational and educational purposes only and should not be construed as investment advice. The stocks mentioned are scored algorithmically by our quantitative framework and do not constitute recommendations to buy or sell securities. Past performance does not guarantee future results. All investments carry risk of loss, including potential loss of principal. Investors should conduct their own research and consider their financial situation and risk tolerance before making investment decisions.