
10 Essential Questions Every Investor Should Ask Before Buying a Stock
A simple framework for evaluating company fundamentals before you invest. Ask these 10 questions to make decisions based on business quality, not market sentiment.
You've heard about a hot stock from a friend, seen it mentioned on social media, or watched it climb on your trading app. Your finger hovers over the "Buy" button. But here's the million-dollar question: Do you actually know if this is a good company?
We've seen too many investors make trades based on confident recommendations from "industry experts" or detailed reports from other investors, only to regret it months later. The issue isn't that others were wrong: it's that following someone else's thesis, no matter how compelling, isn't a substitute for doing your own homework.
Here's the good news: You don't need an MBA or a Wall Street background to evaluate a stock properly. You just need to ask the right questions. This framework will help you make informed decisions based on business fundamentals rather than someone else's thesis or market sentiment. It will give you the conviction to hold through volatility and the confidence to tune out the noise when the crowd is moving in the other direction.
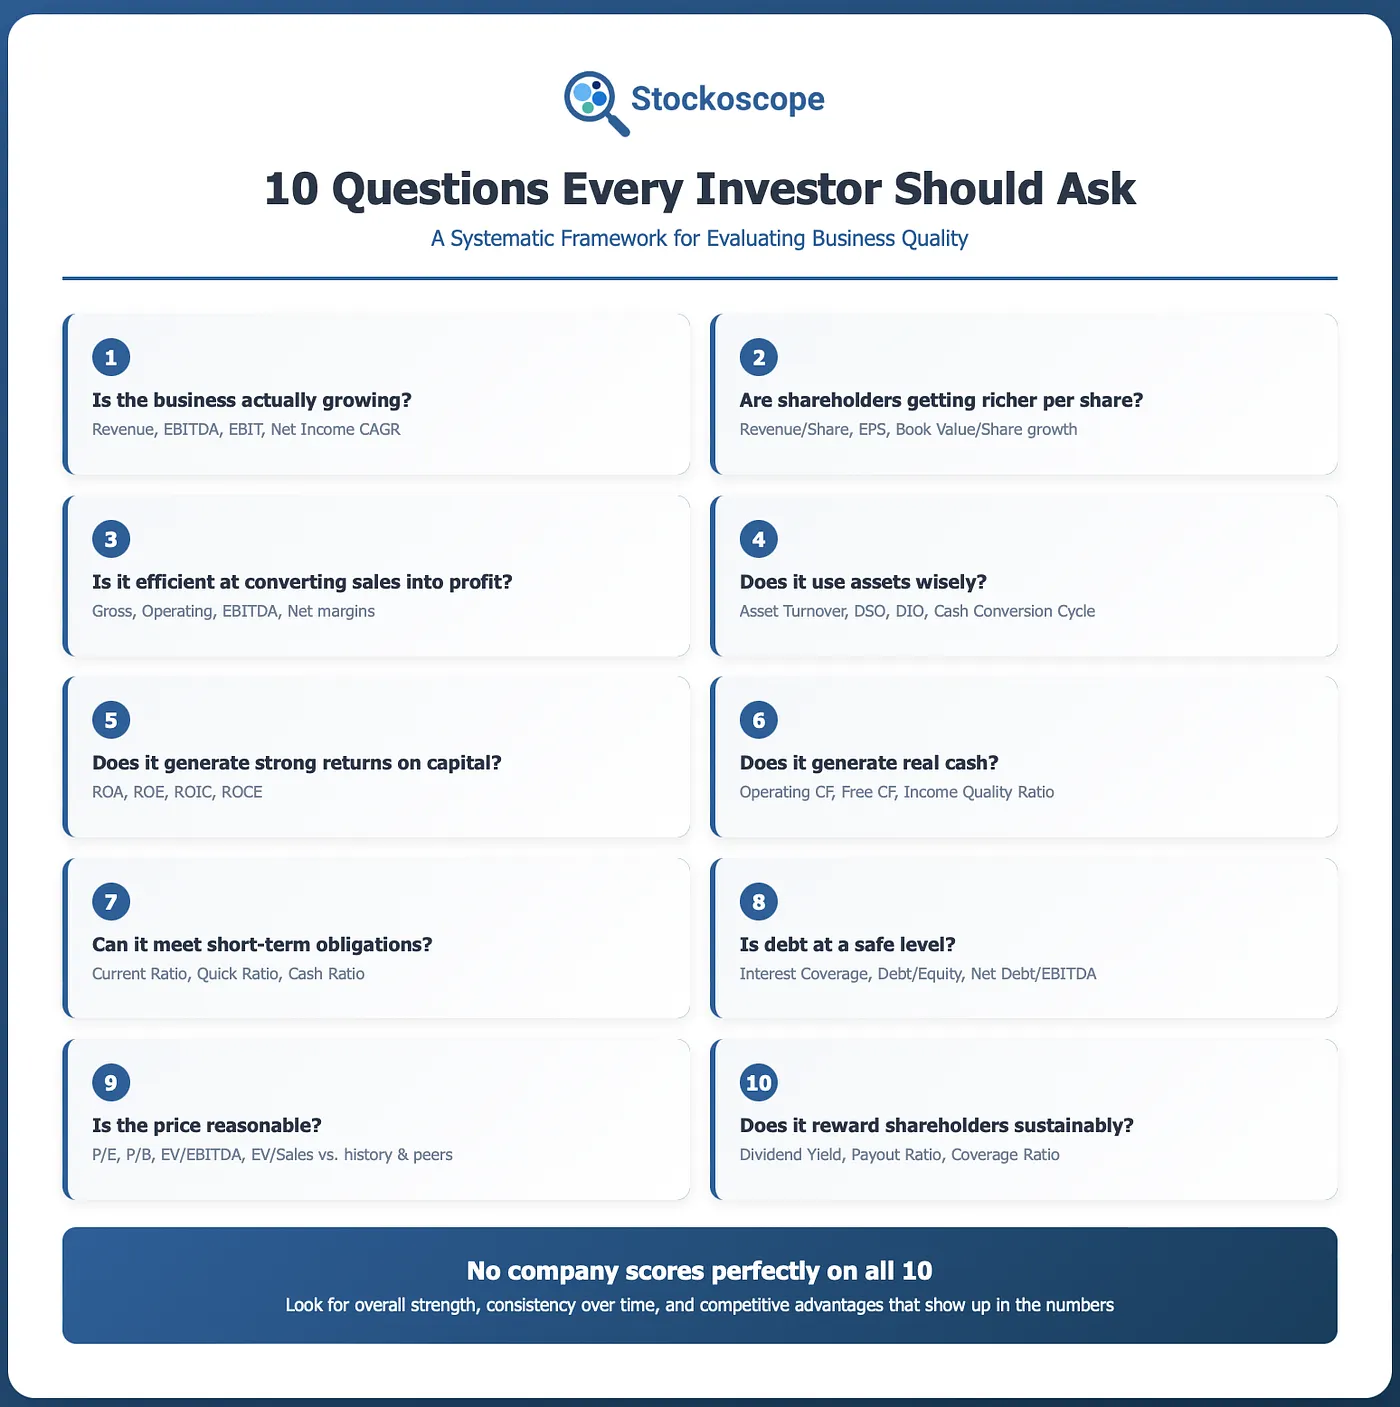
Figure 1: A framework for systematic stock analysis covering 10 essential questions
Question 1: Is the Business Actually Growing?
This is where every analysis should begin. A company might have an exciting product or charismatic CEO, but if the business isn't growing, everything else is just noise.
Look at revenue, EBITDA, EBIT, and net income growth over 5-10 years. Consistent expansion matters more than single-year spikes. A company could sell more products, but if profits aren't growing alongside revenue, something's wrong. Maybe they're cutting prices to compete, or costs are spiraling out of control.
Think of it like owning a coffee shop: you want more customers walking through the door AND more money in your pocket after expenses. If foot traffic is flat year after year, something fundamental is broken. No matter how great your coffee tastes.
Strong companies typically show revenue CAGR above 10%, with EBITDA and net income growing at similar or faster rates. If a business isn't growing, it's fighting an uphill battle, and the remaining nine questions won't matter much.
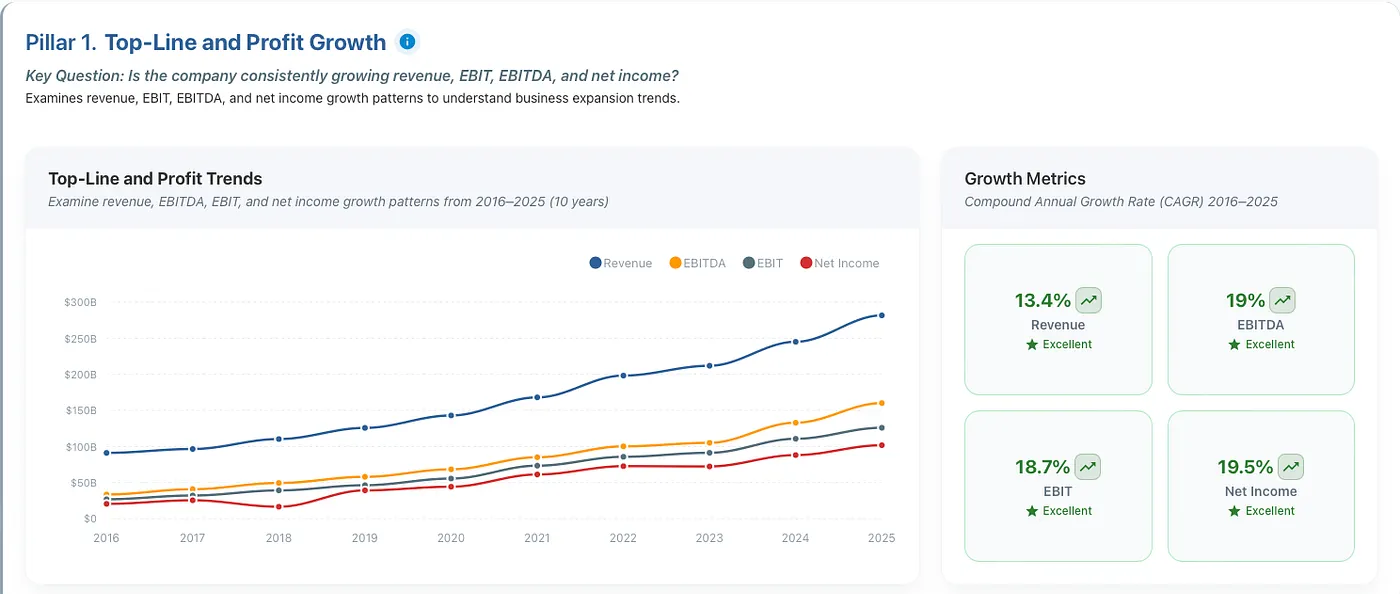
Figure 2: Microsoft demonstrates consistent growth across all four metrics from 2016-2025, with revenue CAGR of 13.4% and net income CAGR of 19.5%. Notice how all four lines trend upward consistently: this is what healthy business expansion looks like.
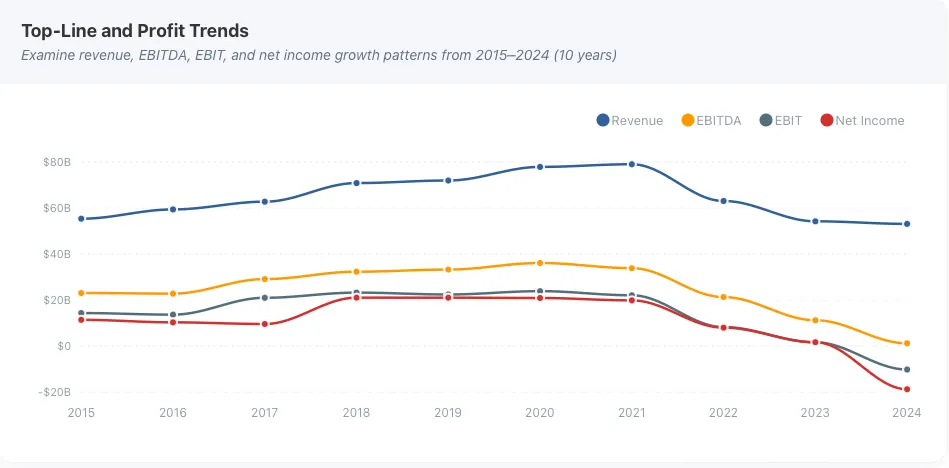
Figure 3: Compare this to Intel, which shows declining revenue since 2021 and deteriorating profitability across all four metrics. This pattern signals fundamental business challenges (losing market share, competitive pressure, or operational issues) regardless of what management narratives might suggest.
Question 2: Are Shareholders Getting Richer on a Per-Share Basis?
Here's a trap many investors fall into: A company's total revenue and profits might be growing, but if they're constantly issuing new shares, your ownership stake gets diluted. It's like adding too much water to whiskey: there's more liquid, but it's weaker.
Check if revenue per share, earnings per share, and book value per share are rising. A company could double in size, but if they triple the share count through dilution, your ownership stake actually shrinks. This filters out growth-through-dilution and reveals whether YOUR shares are becoming more valuable.
Imagine Company A grows revenue from $100M to $200M (100% growth) but issues 50% more shares to fund it. Your per-share revenue only grew 33%. Company B grows revenue from $100M to $150M (50% growth) without diluting shareholders. For you as an investor, Company B might actually be the better deal.
Look for EPS growth above 10% and revenue per share climbing consistently. If total metrics are rising but per-share numbers are flat or declining, management is growing the company at your expense: not a sustainable strategy.
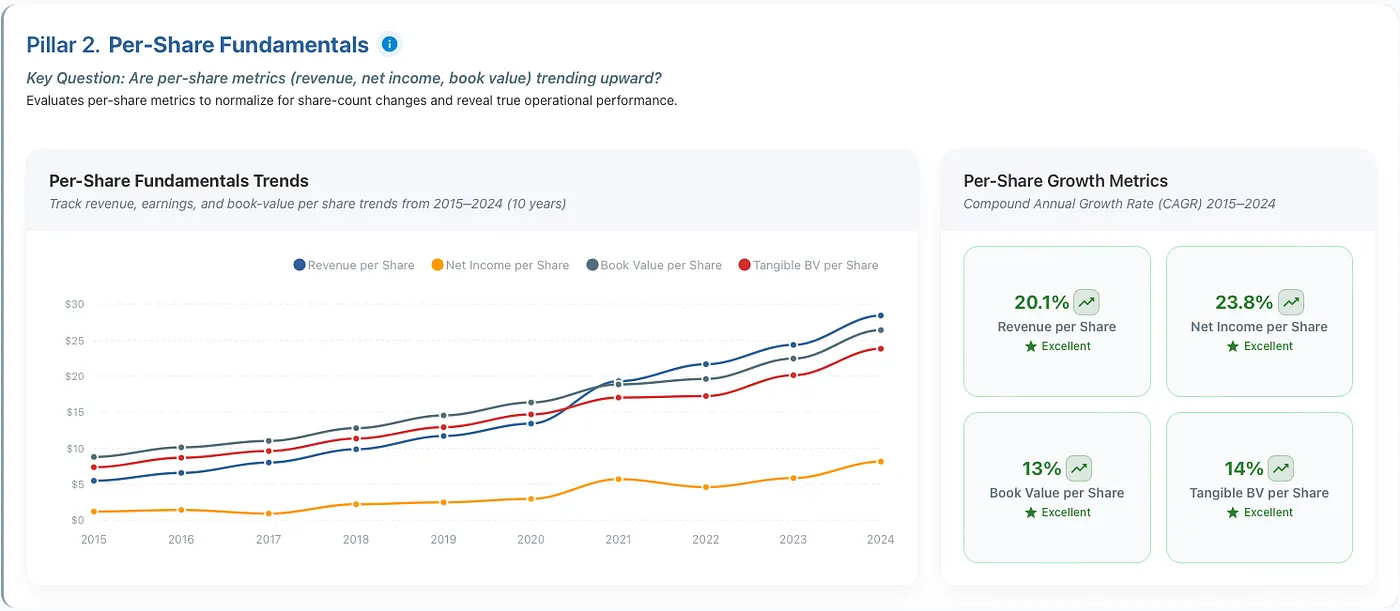
Figure 4: Google shows strong per-share value creation: revenue per share grew at a 20.1% CAGR and EPS at a 23.8% CAGR from 2015 to 2024. All four metrics trend upward consistently, meaning shareholders are genuinely getting richer over time.
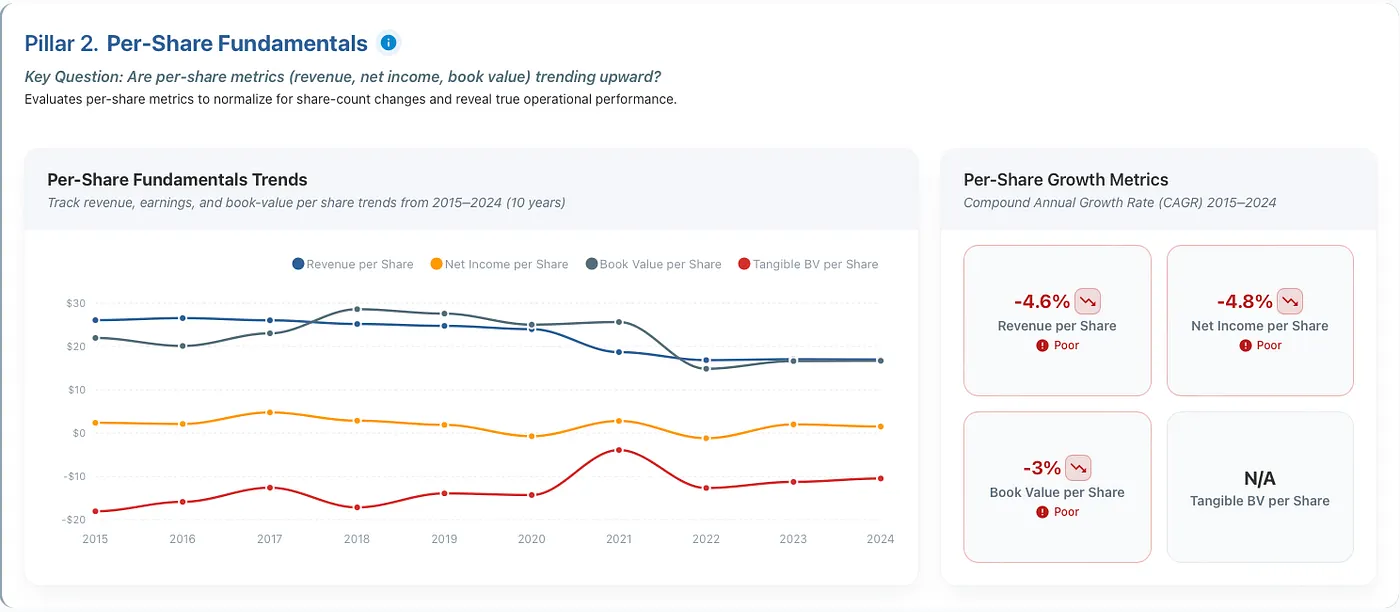
Figure 5: AT&T presents the opposite picture. Despite being a large, seemingly stable company, per-share metrics are all declining: revenue per share down -4.6% CAGR, EPS down -4.8% CAGR, and book value per share down -3% CAGR. Shareholder value is clearly eroding through poor capital allocation and business decline.
Question 3: Is It Efficient at Converting Sales Into Profit?
Revenue is vanity, profit is sanity, and margin is the scorecard. A company could sell billions in products, but if it barely keeps any of that money as profit, it's running on a treadmill.
Track gross, operating, EBITDA, and net profit margins over time. Expanding margins reflect pricing power and cost discipline, suggesting that the company can raise prices or better control costs than its competitors. Shrinking margins while revenue grows often signal competitive pressure eating into profitability.
Say you run a restaurant. Your gross margin is what's left after buying ingredients. Your net margin is what you actually take home after paying staff, rent, and utilities. If you're selling more meals but your take-home profit is shrinking, you have a problem. Maybe you're competing on price, or costs are spiraling out of control.
Strong businesses maintain gross margins above 40% and net margins above 10%. Expanding margins over time suggest the company has pricing power and a competitive moat. Margins reveal whether a business can sustain profitability or is constantly fighting for survival.
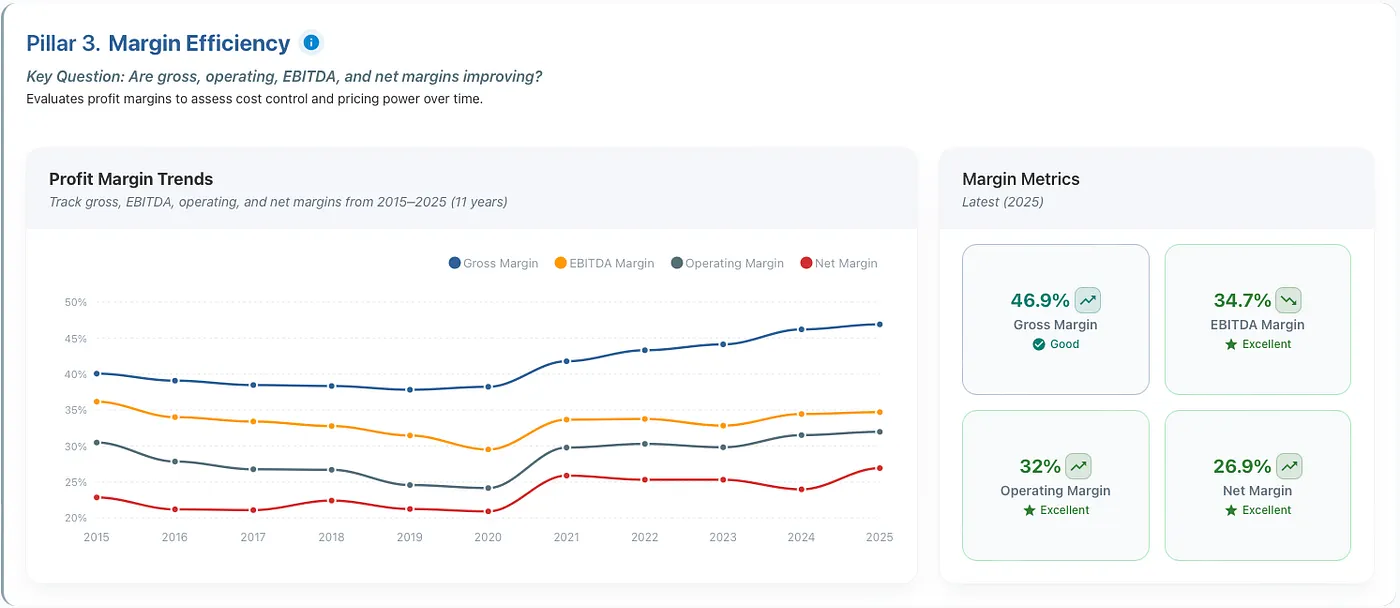
Figure 6: Apple demonstrates pricing power. Gross margins have expanded from around 40% in 2015 to 46.9% by 2025, while maintaining strong EBITDA (34.7%), operating (32%), and net margins (26.9%). This improvement over time signals the company can raise prices, control costs, and scale profitably: hallmarks of a business with a genuine competitive moat.
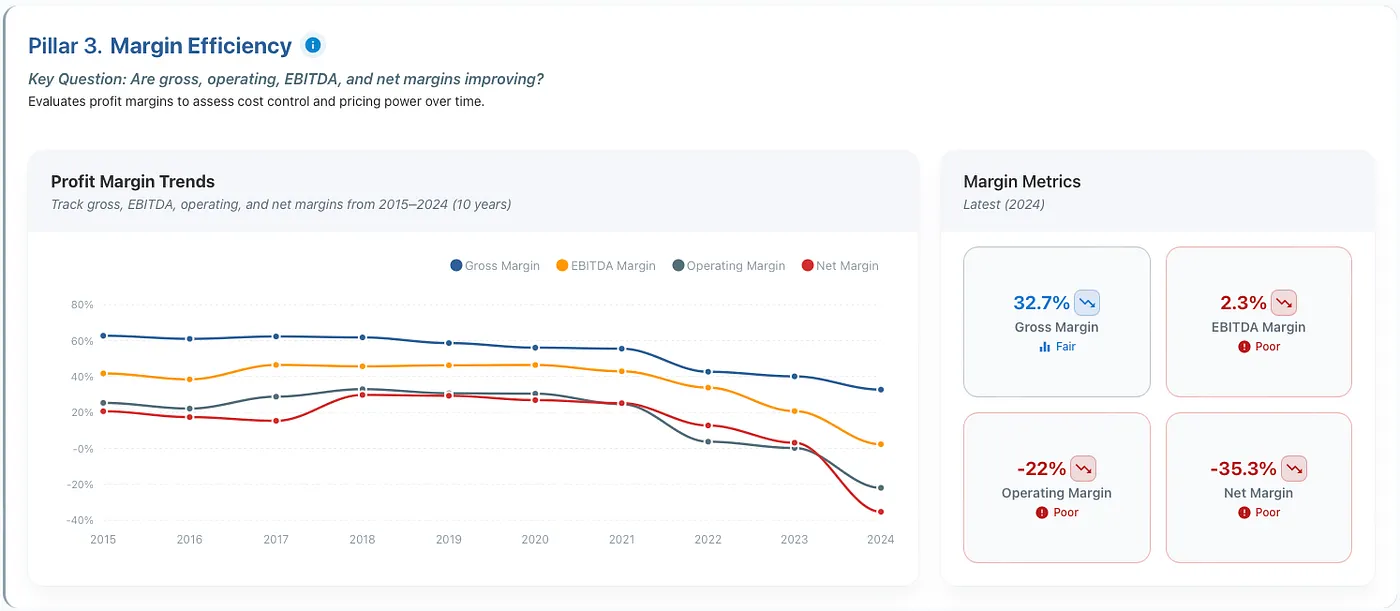
Figure 7: Intel shows the opposite trajectory. Gross margins have compressed from over 60% in 2015 to just 32.7% by 2024, while operating margins have turned negative (-22%) and net margins have collapsed to -35.3%. This isn't just a bad year: it's a multi-year trend of deteriorating competitiveness. When you're forced to cut prices to compete (AMD, NVIDIA taking share) while your costs remain high (expensive manufacturing transitions), margins get crushed. This is what a struggling business looks like in the numbers.
Question 4: Does It Use Assets and Working Capital Efficiently?
Two companies could have the same revenue, but one might need twice the assets to generate it. The more efficient the company, the better the business.
Look at asset turnover, days sales outstanding, days inventory outstanding, and cash conversion cycle. The faster a company converts operations into cash, the less capital it needs to grow and the better it weathers downturns. Efficient working capital management means money isn't sitting idle in inventory or tied up in customer receivables.
Imagine two lemonade stands with the same daily sales. Stand A keeps inventory fresh, collects cash immediately, and reuses the same pitcher efficiently. Stand B over-orders lemons that spoil, lets customers pay "later" (some never do), and keeps buying new equipment. Stand A converts operations into cash in days; Stand B takes weeks. Which would you rather own?
Companies with cash conversion cycles under 60 days and improving asset turnover ratios demonstrate operational excellence. If days sales outstanding or inventory days are climbing, that's often an early warning sign of weakening demand or deteriorating competitive position.
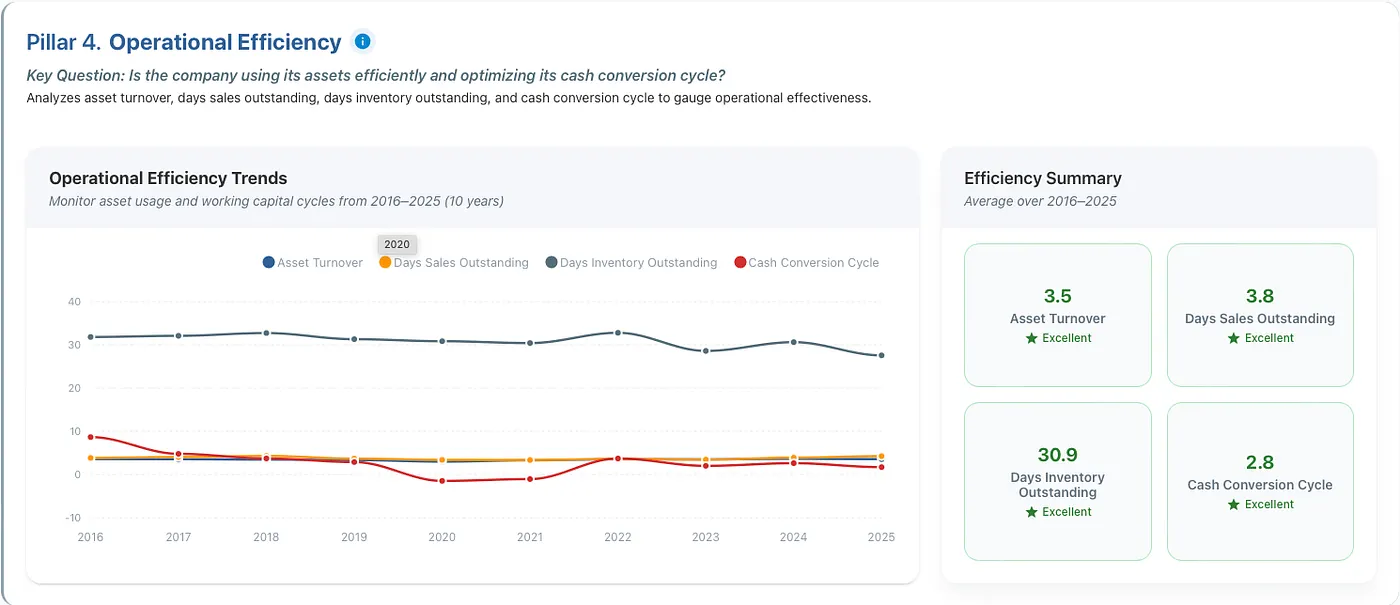
Figure 8: Costco demonstrates world-class operational efficiency. With an asset turnover of 3.5, it generates $3.50 in revenue for every dollar of assets. But the real magic is in working capital: customers pay in 3.8 days, inventory turns in just 31 days, and the cash conversion cycle is an astonishing 2.8 days. This means Costco essentially collects cash from customers before it has to pay suppliers, letting it fund growth with other people's money. This is the power of the membership model combined with high-velocity inventory turnover.
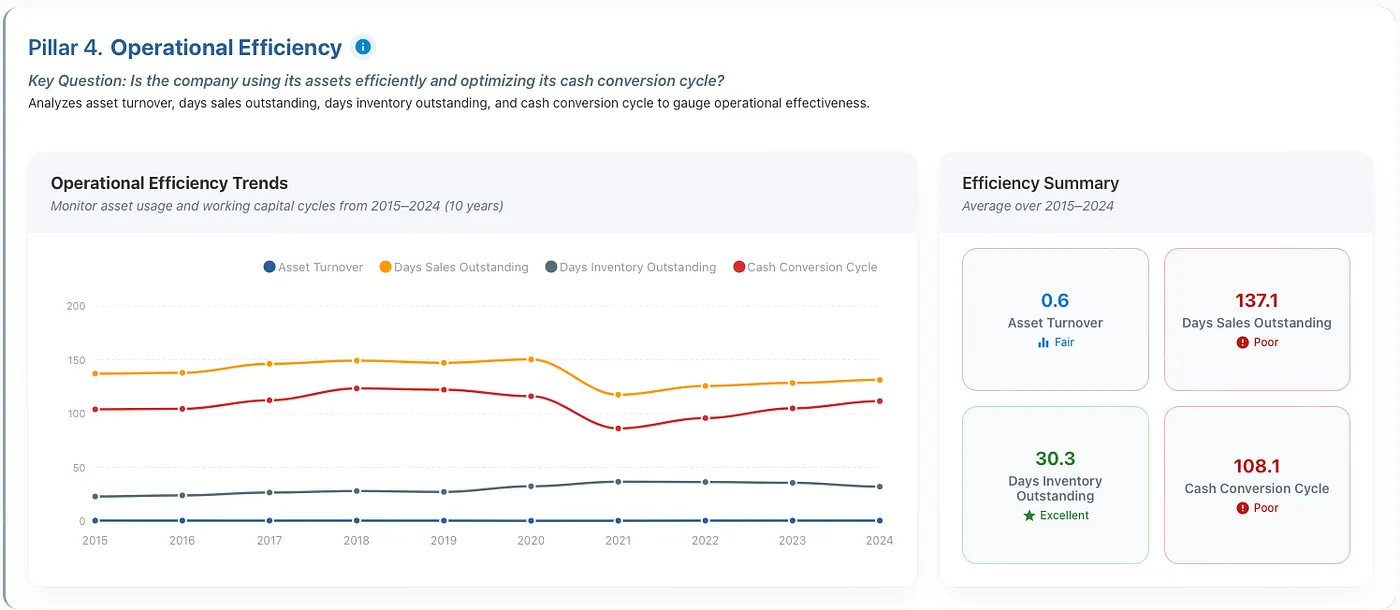
Figure 9: Ford shows why capital-intensive manufacturing businesses struggle. Asset turnover of just 0.6 means it needs $1.67 in assets to generate $1 in revenue: the opposite of capital efficiency. Days sales outstanding of 137 days reflects automotive financing (customers pay over months), and a cash conversion cycle of 108 days means Ford's cash is tied up for over three months. When you need massive factories, hold inventory, and extend financing to customers, you burn capital just to operate, leaving less for growth, innovation, or returning to shareholders.
Question 5: Does It Generate Strong Returns on Capital?
This is where we ask: Is the company actually good at making money with the resources it has? Companies that generate strong returns can fund growth from internal cash flow, pay dividends without sacrificing growth, compound your wealth faster, and often have competitive advantages (moats).
Check ROA, ROE, ROIC, and ROCE. High returns sustained over time signal competitive advantages: the company earns more on each dollar invested than competitors can. Companies generating 15%+ ROE can fund growth internally without needing external capital at unfavorable terms.
If you invest $100 in a business, how much profit does it generate annually? If the answer is $5 (5% return), you might as well buy an index fund. If it's $20 (20% return), now we're talking. Warren Buffett famously looks for companies that can consistently generate 15%+ ROE because, over time, your investment return will approximate the company's ROE.
Look for ROIC above 12%, ROE above 15%, and returns that remain stable or improve over time. High returns that persist signal real competitive advantages: strong brands, network effects, or cost advantages that let the company earn more than competitors on the same capital base.
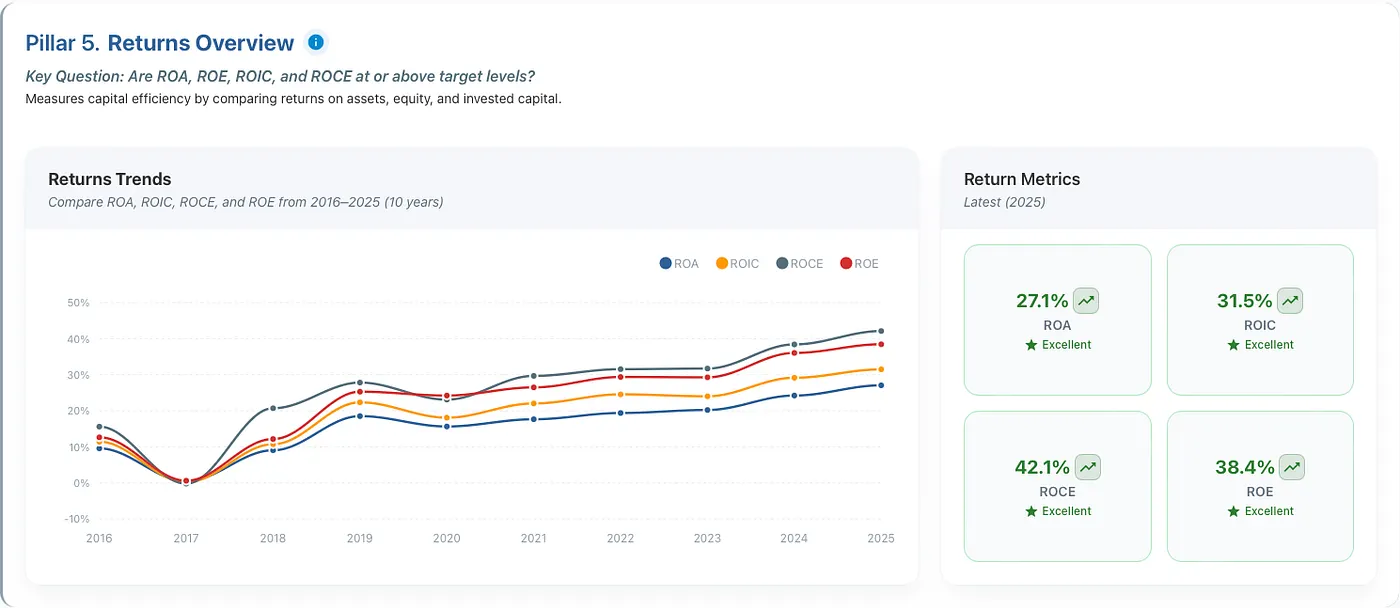
Figure 10: Deckers (owner of UGG, HOKA) demonstrates what exceptional capital efficiency looks like despite dropping over 60% this year. ROE of 38.4%, ROIC of 31.5%, and ROCE of 42.1% mean the company generates over 30 cents of profit for every dollar invested. Notice how all four return metrics have consistently improved from 2016 to 2025: this signals a business with strengthening competitive advantages.
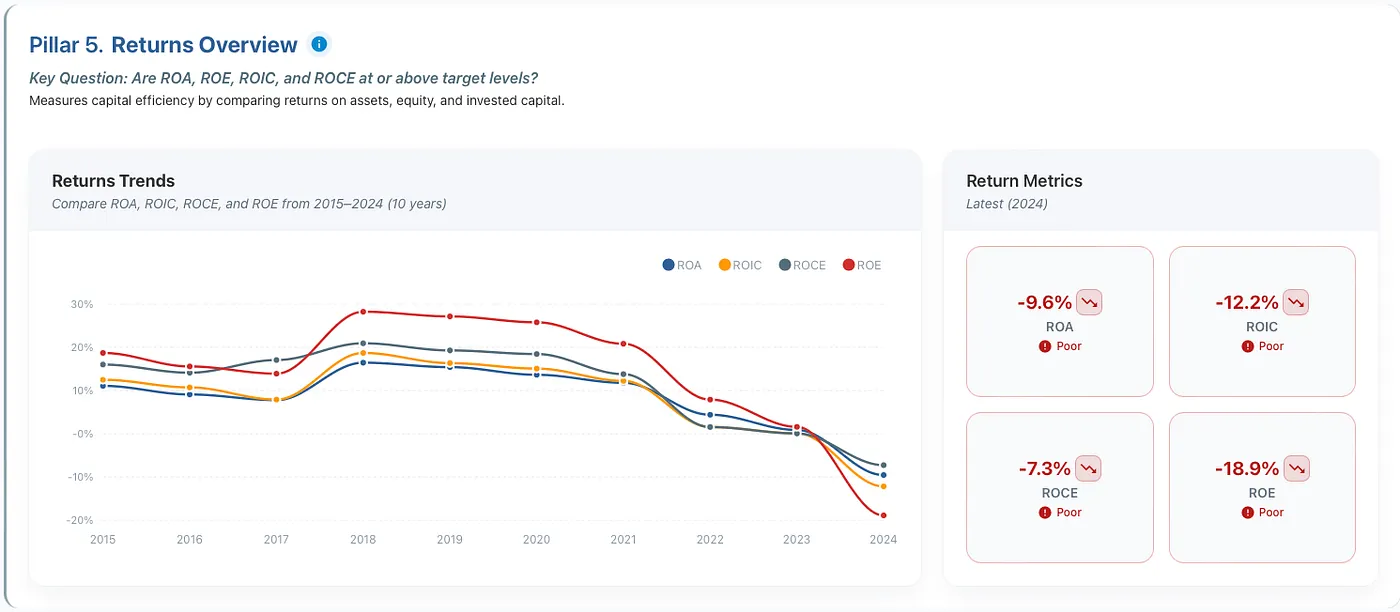
Figure 11: Intel shows how quickly returns can collapse when competitive advantages erode. Returns peaked around 2018 (ROE near 30%) but have crashed to deeply negative territory by 2024: ROE of -18.9%, ROIC of -12.2%, ROA of -9.6%. The company is now destroying value: every dollar invested generates a loss. This reflects the brutal reality of losing technological leadership to AMD and NVIDIA while being stuck with expensive, outdated manufacturing processes. Negative returns mean the business is consuming capital rather than creating it.
Question 6: Does It Generate Real Cash, Not Just Accounting Profits?
Cash is what pays dividends, funds acquisitions, and buys back stock. Cash is what keeps the lights on during tough times. If a company isn't generating cash, everything else is built on quicksand. Remember: "Cash is king." Companies that generate strong, consistent free cash flow have options. Companies that don't are at the mercy of capital markets.
Look at operating cash flow, free cash flow, and the income quality ratio (operating CF / net income). Accounting rules allow companies to report profits while burning cash. Revenue can be recognized before collection, and expenses can be deferred. Strong businesses consistently convert earnings into actual cash.
During the dot-com bubble, many companies reported "profits" using creative accounting while hemorrhaging cash. When the music stopped, hundreds went bankrupt despite showing paper profits. Cash doesn't lie.
Look for positive, growing free cash flow and an income quality ratio above 1.0. If a company shows strong earnings but weak cash flow for multiple years, something's wrong. Maybe customers aren't paying, or capital expenditures are consuming all the profits. Cash generation separates real businesses from accounting illusions.
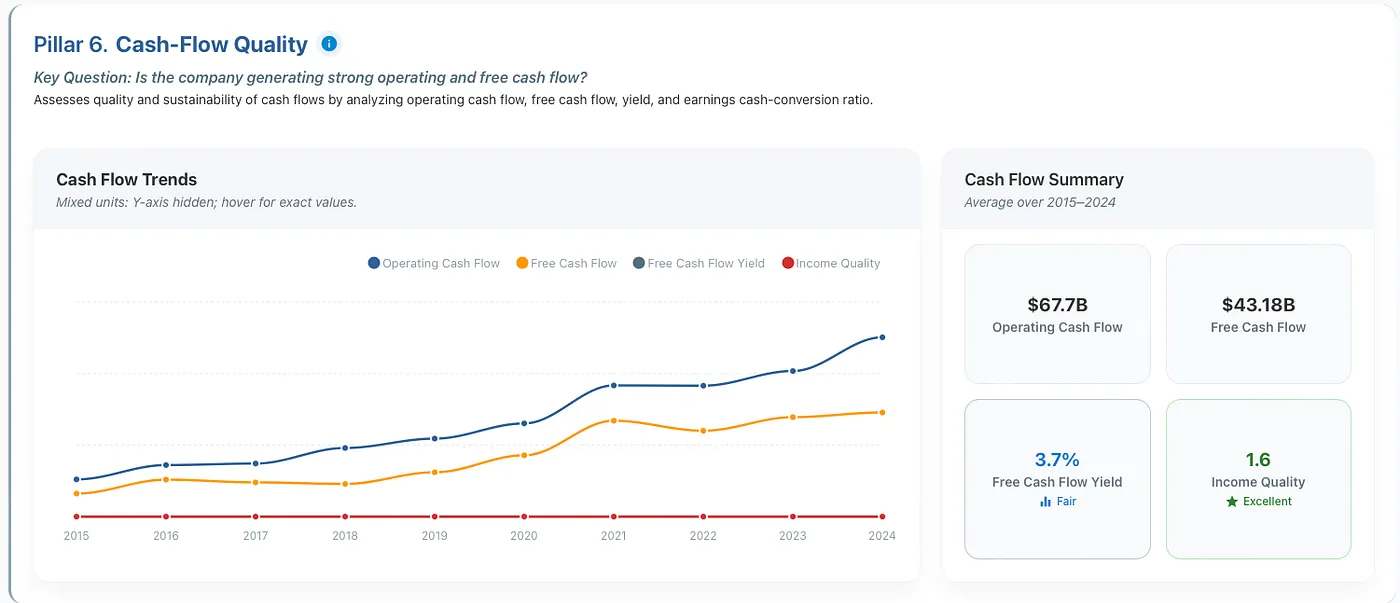
Figure 12: Google demonstrates what a true cash-generating business looks like. Operating cash flow has grown from around $20B to nearly $90B annually, with free cash flow averaging $43B over the past decade. The income quality ratio of 1.6 means Google generates $1.60 in operating cash for every dollar of reported earnings: proof that profits convert to actual cash. This cash generation funds acquisitions, buybacks, and innovation without needing to tap capital markets.
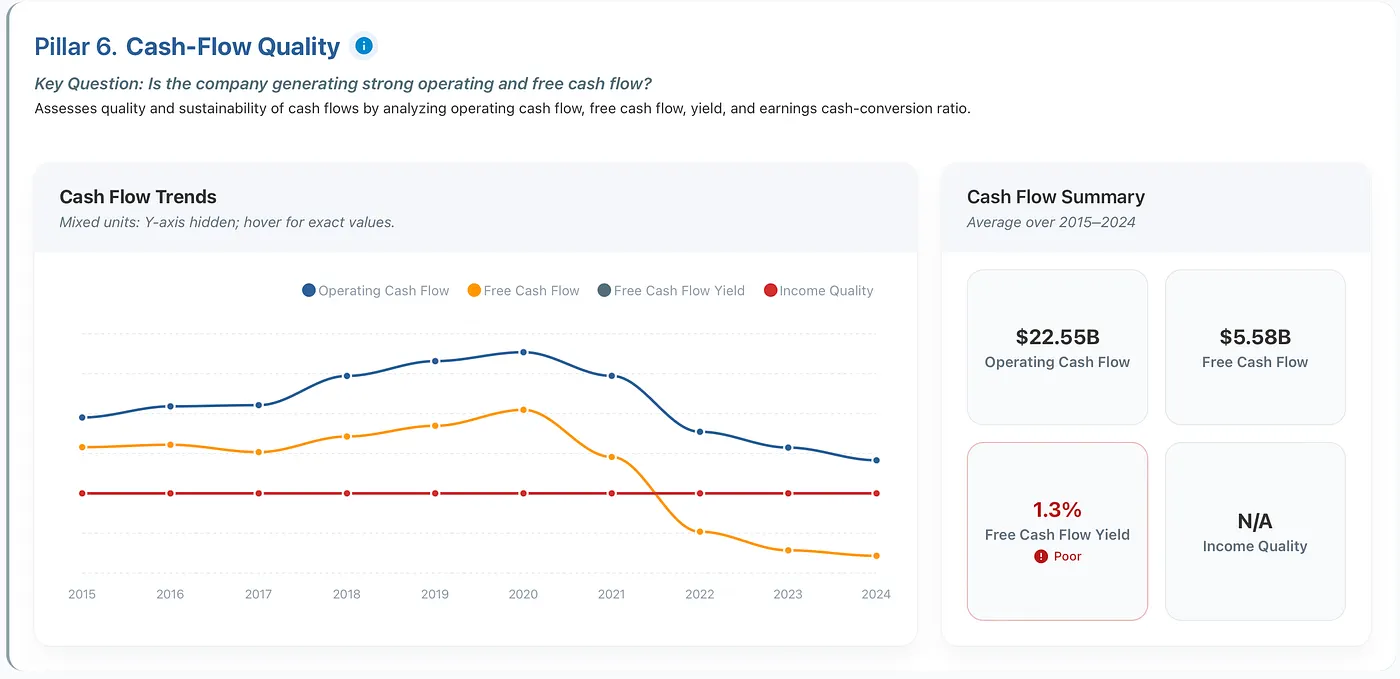
Figure 13: Intel's cash flow tells a concerning story. Operating cash flow peaked around 2020 near $35B but has since declined to $22.55B. More troubling, free cash flow has collapsed from over $16B at its peak to just $5.58B, a 65% drop. This is what happens when a capital-intensive business faces declining profitability. Note: The average income quality over five years was not calculated as the metric was negative in some years.
Question 7: Can It Meet Short-Term Obligations Comfortably?
This is the "sleep-at-night" test. Review current ratio, quick ratio, and cash ratio. Even profitable companies go bankrupt if they can't meet immediate obligations. Liquidity crises kill businesses faster than unprofitability. A company can survive losing money for a while, but if it can't pay suppliers or make payroll, it's game over.
Imagine you're hosting a dinner party tonight. You've got $100 in your wallet, but the groceries cost $150. If you can't cover it, the party's cancelled. Doesn't matter if you get paid next week. That's a liquidity crisis. Now imagine you've got $200 in your wallet for a $100 grocery bill. You're comfortable, with a cushion for surprises.
Look for a current ratio above 1.5 and a quick ratio above 1.0. These ratios show the company has enough liquid assets to cover short-term liabilities with room to spare. If liquidity ratios are declining sharply or dipping below 1.0, that's a red flag that deserves immediate attention.
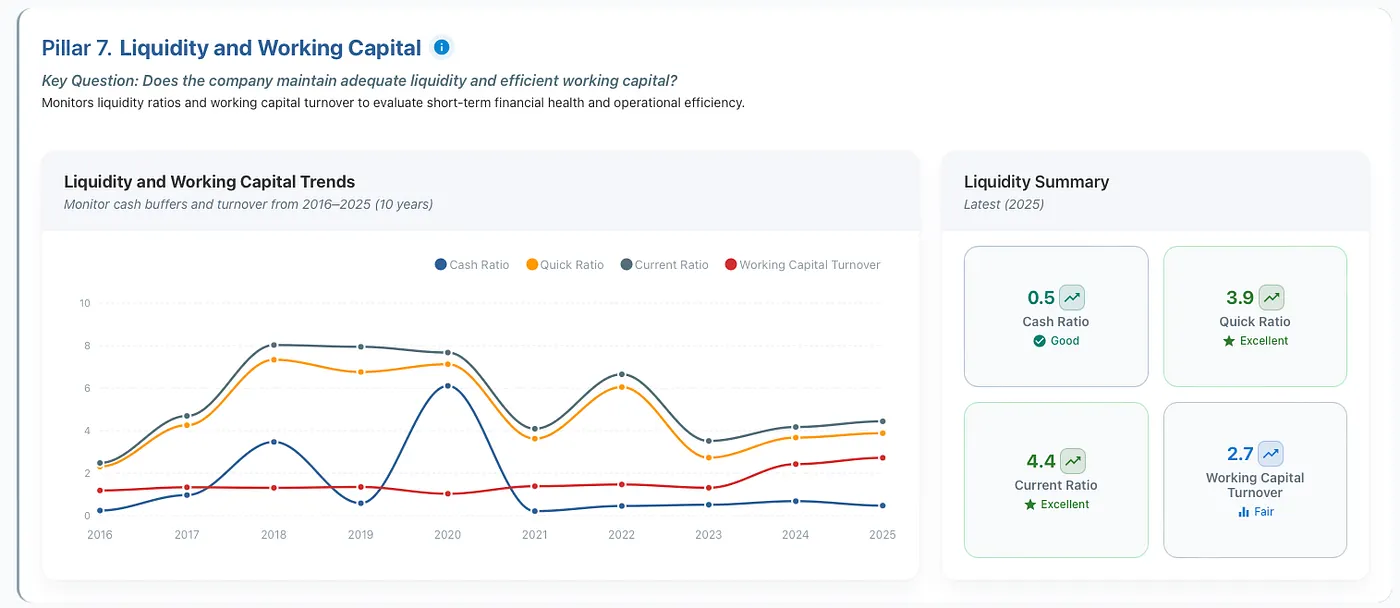
Figure 14: NVIDIA maintains a fortress balance sheet with exceptional liquidity. A current ratio of 4.4 means it holds $4.40 in current assets for every dollar of current liabilities. The quick ratio of 3.9 shows it can cover obligations nearly four times over, even without selling inventory. A cash ratio of 0.5 means half of short-term liabilities could be paid with cash alone. This cushion gives NVIDIA complete flexibility: it can invest in R&D, make acquisitions, or weather any downturn without financial stress.
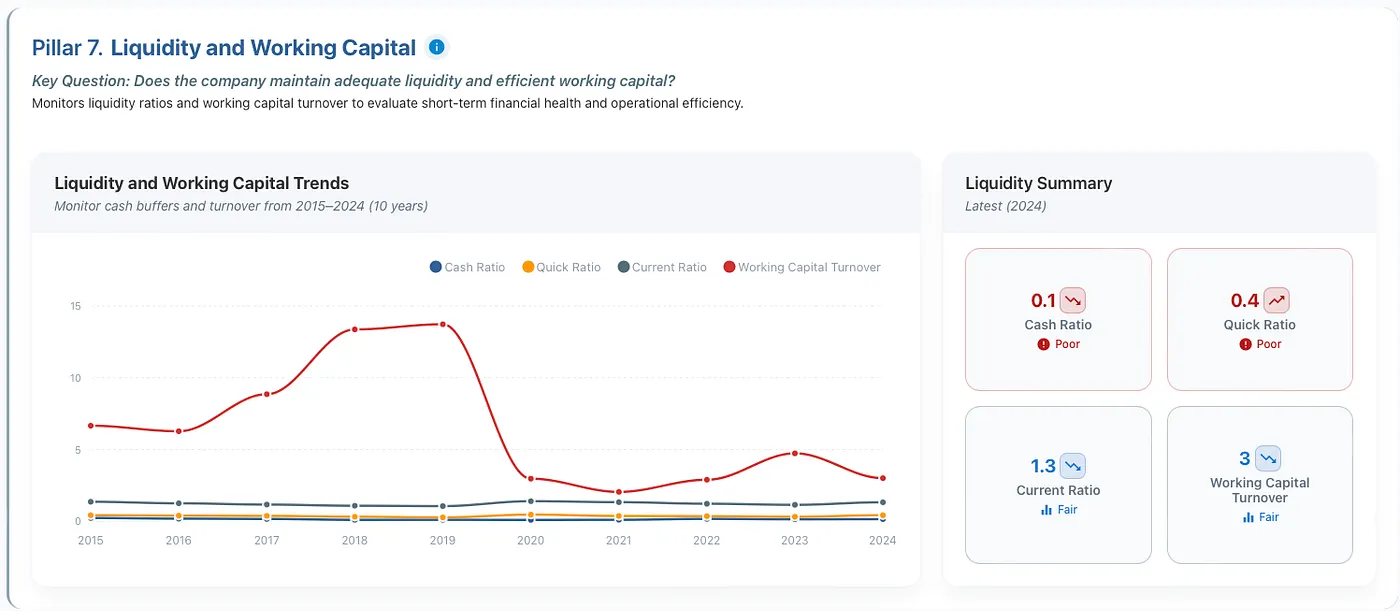
Figure 15: Boeing's liquidity metrics signal serious financial stress. A current ratio of 1.18 and quick ratio of 0.22 show minimal cushion, with the quick ratio below the safety threshold. More alarming, both ratios have been on a multi-year decline since 2017. The near-zero quick ratio means Boeing relies almost entirely on inventory to meet current obligations, and aerospace inventory doesn't convert to cash quickly. Combined with massive debt taken on during COVID-19 disruptions and 737 MAX grounding costs, this liquidity profile leaves minimal room for error.
Question 8: Is Debt at a Safe, Sustainable Level?
Look at interest coverage ratio, debt-to-equity, net debt-to-EBITDA, and debt-to-capital. Debt amplifies everything: it magnifies returns in good times and magnifies losses in bad times. Companies with fortress balance sheets can invest aggressively when competitors are retreating, make strategic acquisitions when assets are cheap, and survive downturns without existential risk.
Strong companies maintain interest coverage above 5x, debt-to-equity below 1.0, and net debt-to-EBITDA under 3.0. But context matters. Utilities and real estate naturally carry more debt than tech companies. The key question: could the company survive a bad year? If revenue drops 20% or interest rates rise, can it still meet obligations?
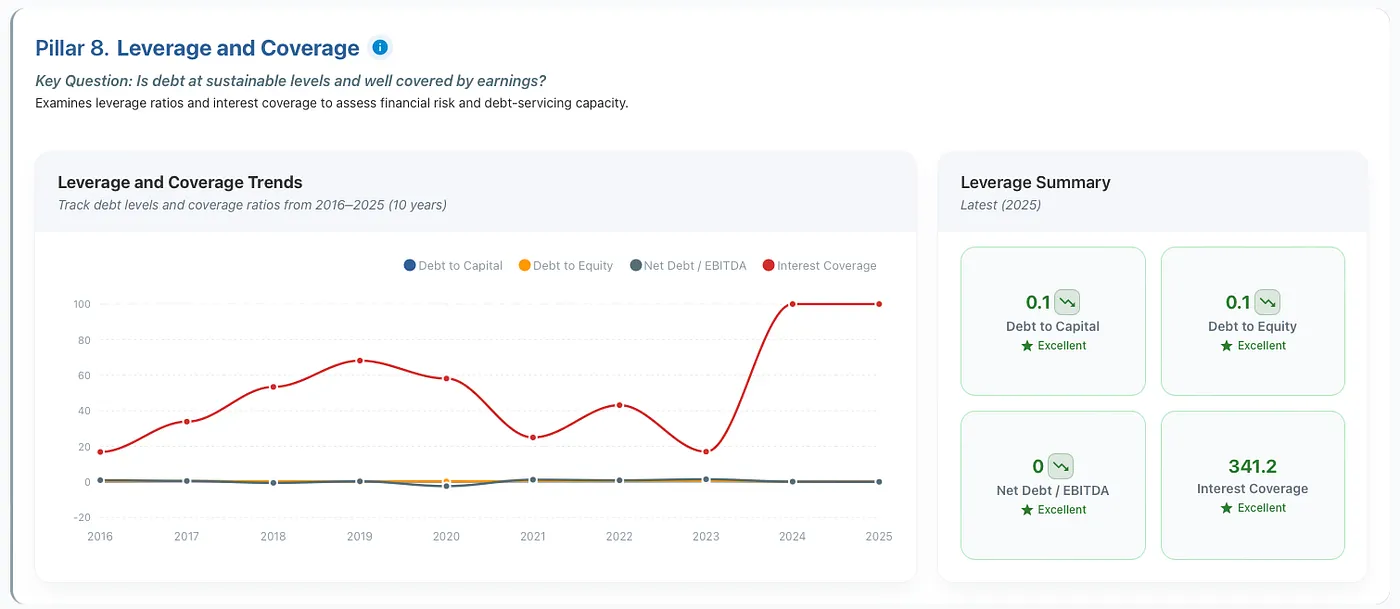
Figure 16: NVIDIA operates with virtually no debt. Debt-to-capital of just 0.1 means only 10% of its capital structure is debt, and the company funds growth almost entirely through retained earnings and equity. Interest coverage of 341x means NVIDIA could cover its minimal interest expense 341 times over from operating earnings. This fortress balance sheet gives complete strategic flexibility as NVIDIA can invest in R&D, make acquisitions, or weather downturns without worrying about debt covenants or interest payments.
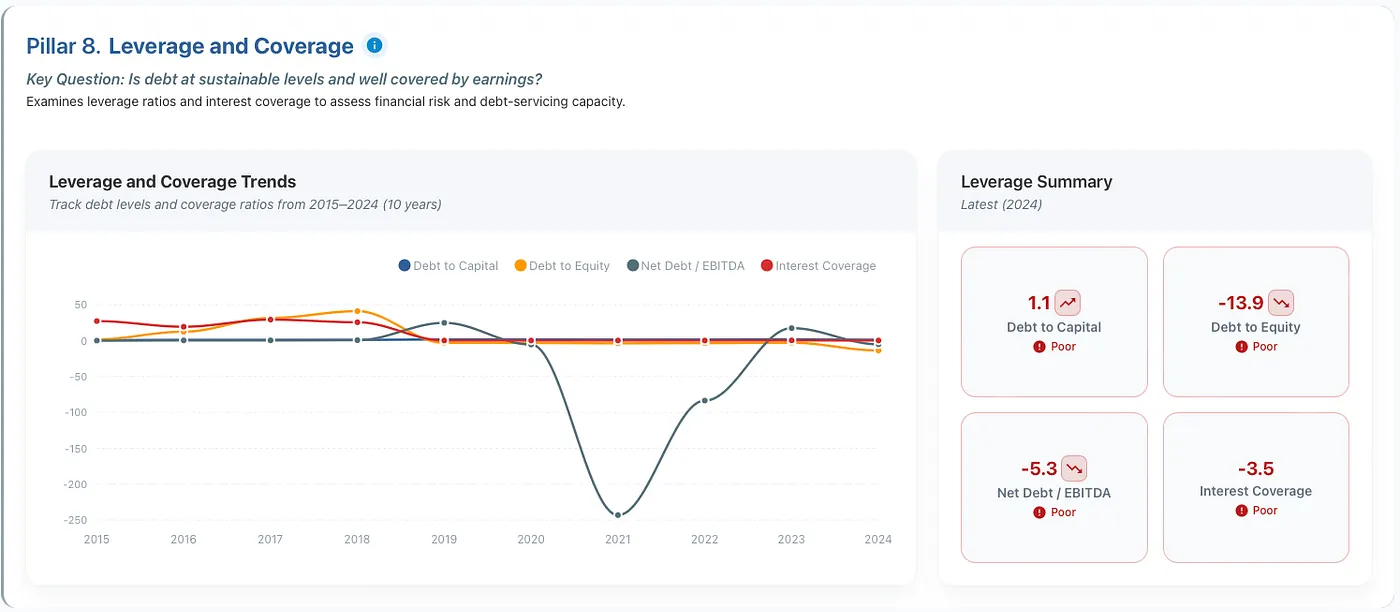
Figure 17: Boeing tells a cautionary tale of leverage gone wrong. Debt-to-capital above 1.0 means debt actually exceeds total capital, while the negative debt-to-equity ratio (-13.9) reveals negative shareholder equity: liabilities exceed assets. Interest coverage of -3.5 means Boeing isn't generating enough operating income even to cover interest payments, forcing it to burn cash or borrow more just to service existing debt. When a company is this overleveraged, recovery becomes extremely difficult as every dollar earned goes to creditors before shareholders see anything.
Question 9: Is the Price Reasonable?
Compare P/E, P/B, EV/EBITDA, and EV/Sales to the company's historical range and direct competitors. It helps you understand what the market is pricing in and whether expectations seem reasonable based on fundamentals.
Valuation is context, not a buy signal. A great company growing 30% annually might deserve a P/E of 38. A declining business with no future might be expensive at a P/E of 8. High-growth companies trade at higher multiples. Cyclical companies at peak earnings might look "cheap" but aren't.
Look at the company's historical valuation range, compare to direct competitors, and consider the growth rate (faster growth justifies higher multiples) and quality (better businesses command premiums). Valuation gives you context about market expectations. Use it to understand what you're paying for the fundamentals, not as a standalone decision trigger.
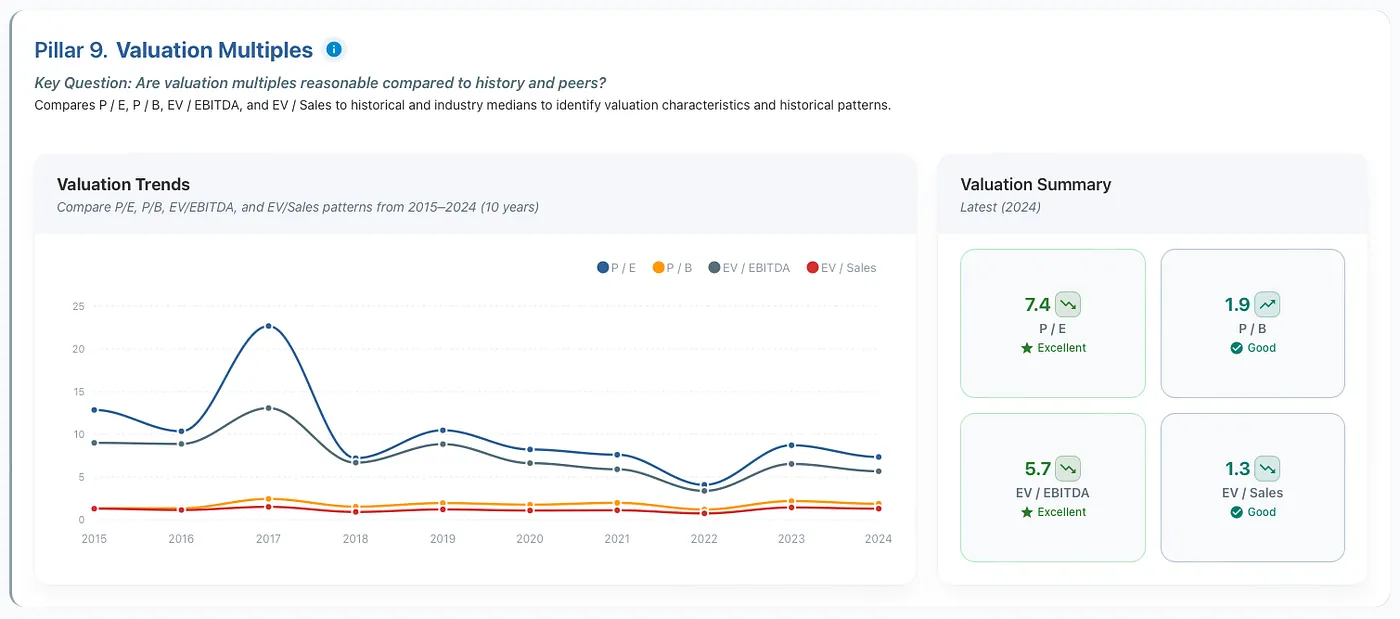
Figure 18: PulteGroup (homebuilder) trades at a P/E of 7.4 and EV/EBITDA of 5.7, near the lower end of its historical range. These "cheap" multiples might signal opportunity if the business fundamentals are solid, or they might reflect structural concerns about the cyclical housing market. Low multiples demand investigation: is this a value opportunity or a value trap?
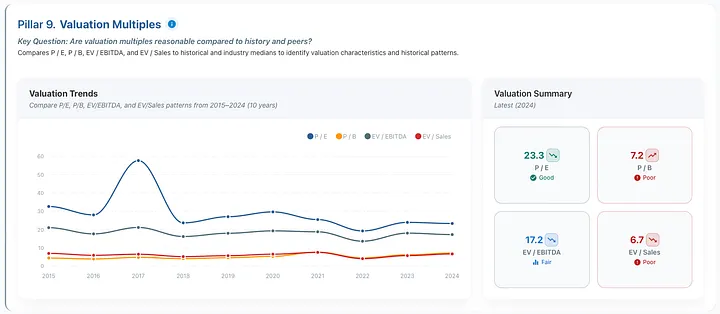
Figure 19: Google shows a more moderate valuation: P/E of 23.3 and EV/EBITDA of 17.2. While the P/B of 7.2 looks high, this is typical for asset-light technology businesses with strong intangibles. The multiples sit within Google's historical range and reflect the company's consistent profitability and market dominance: neither obviously cheap nor dangerously expensive.
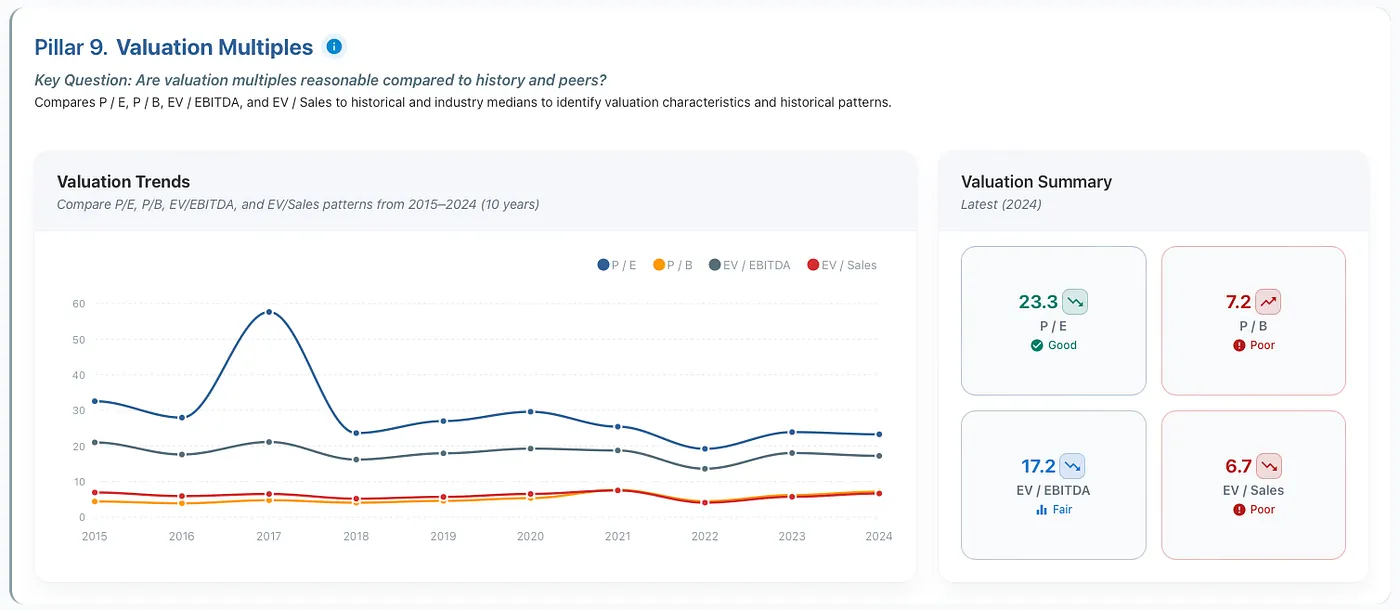
Figure 20: NVIDIA trades at premium multiples: P/E of 39.9, P/B of 36.7, EV/EBITDA of 33.8. But NVIDIA's exceptional growth (Question 1), expanding margins (Question 3), and exceptional returns (Question 5) might justify premium pricing. The question isn't whether it's expensive: it clearly is. The question is whether the fundamentals support continued growth at rates that justify today's price. This is priced for perfection: any stumble will be punished.
Question 10: Does It Reward Shareholders Sustainably?
If applicable, check dividend yield, payout ratio, and coverage ratio. Not all great companies pay dividends. Many high-growth companies reinvest profits rather than distribute them. But for companies that do pay dividends, you want to ensure they're sustainable and growing.
Growth companies often pay no dividend because they're reinvesting for expansion. Mature companies often pay steady dividends because they have fewer growth opportunities. Value traps sometimes have high yields simply because the stock price has collapsed and the market expects a dividend cut.
Sustainable dividends show yields between 2% and 6%, payout ratios under 60%, and coverage ratios above 2x. Yields above 8-10% often signal the market expects a cut. The key test: can the company maintain and grow this dividend through a recession? Look at free cash flow, not just earnings. If FCF easily covers the dividend with room to spare, it's likely sustainable.
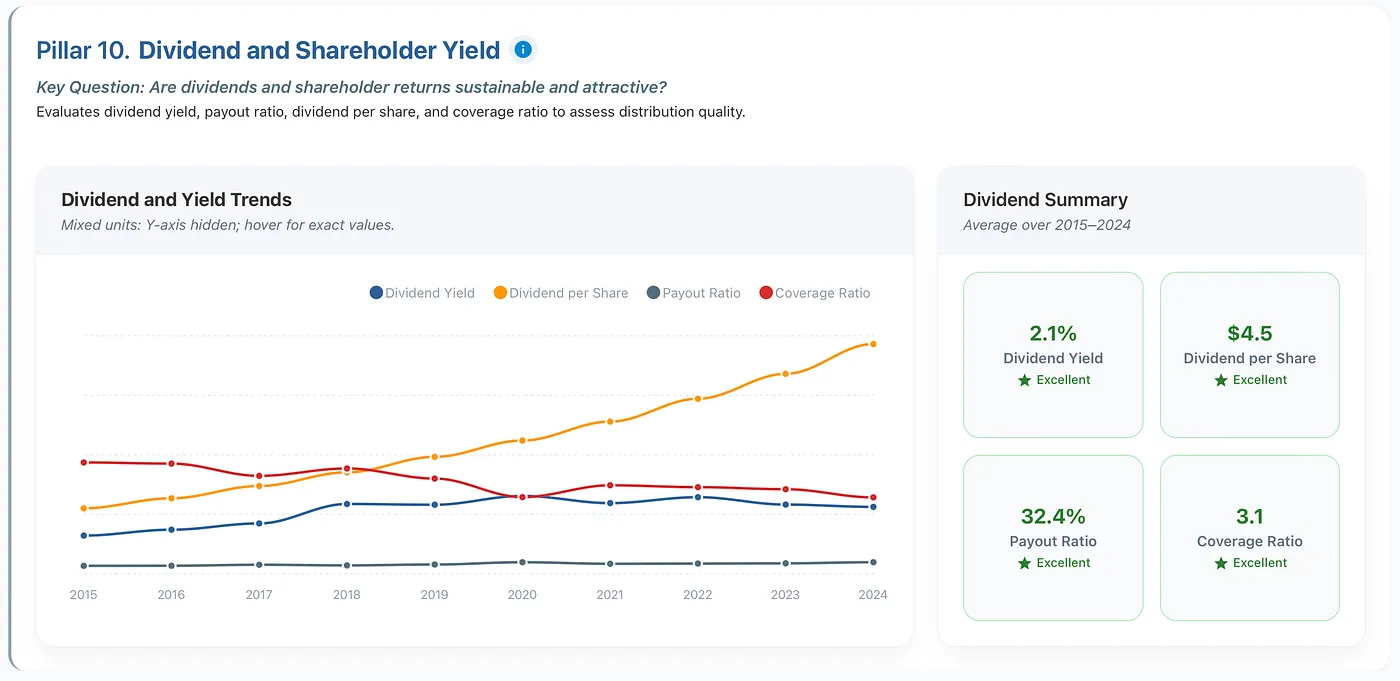
Figure 21: Snap-on Incorporated (SNA) demonstrates sustainable dividend practices. With a yield of 2.1%, a payout ratio of 32.4%, and a coverage ratio of 3.1x, the dividend has room to grow and can withstand earnings volatility. Notice how dividend per share has climbed steadily from around $2 in 2015 to over $7 by 2024: this consistent growth signals management's confidence in cash flow sustainability. The 32% payout ratio means SNA retains 68% of earnings for reinvestment or cushion, providing flexibility during challenging periods.
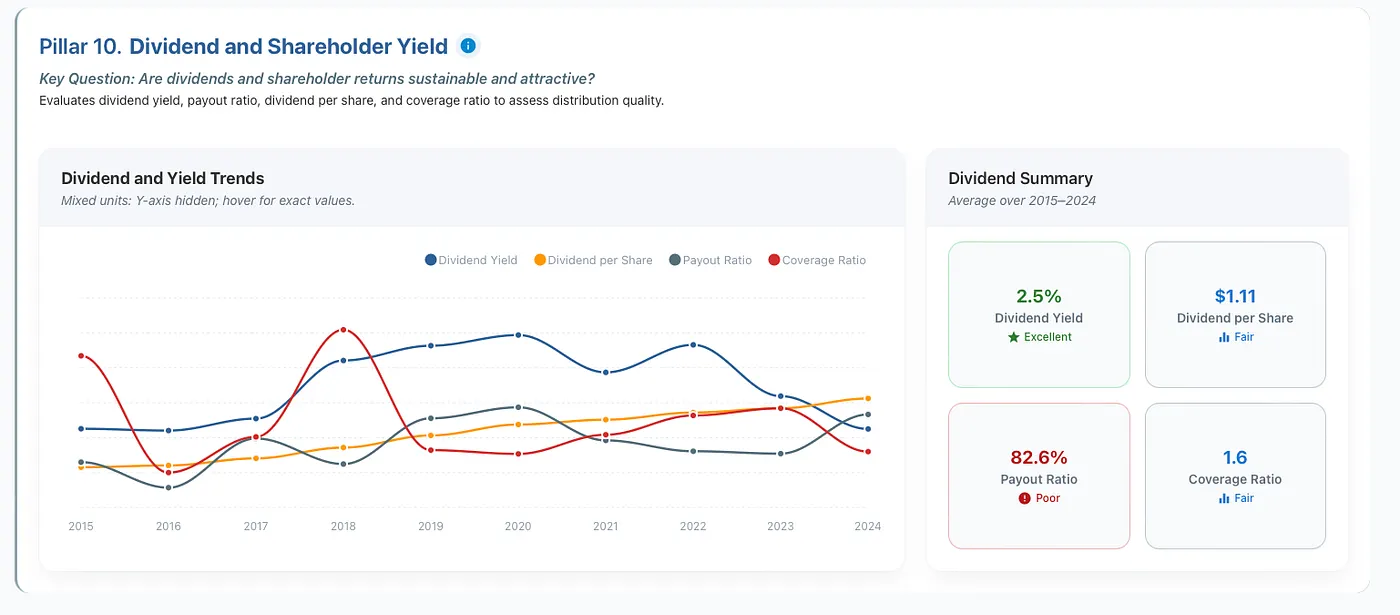
Figure 22: Broadcom shows a more aggressive dividend approach. While the 2.5% yield looks reasonable, the payout ratio of 82.6% leaves little margin for error: if earnings dip, the dividend becomes unsustainable. Notice the extreme volatility in the coverage ratio (red line) around 2018 and the erratic payout ratio throughout the period. This pattern suggests the dividend has been strained at times and may be vulnerable to cuts if business conditions deteriorate. When payout ratios exceed 80%, investors should scrutinize free cash flow carefully: can the company maintain this distribution through a recession?
Putting It All Together
Now you have 10 powerful questions. But here's the thing: No company scores perfectly on all 10. You're looking for overall strength, consistency over time, and competitive advantages that show up in the numbers.
While these questions don't directly measure moat, the answers reveal indicators of moat:
- High returns on capital suggest durable advantages
- Expanding margins signal pricing power
- Strong free cash flow shows self-funding ability
- Efficient working capital often reflects network effects or switching costs
Companies with real moats score well across multiple dimensions. Once you identify quantitative strength, follow up with qualitative analysis of the business model, competitive positioning, and management quality.
Companies that excel across most pillars tend to compound wealth over decades. Those that fail most tests might have exciting stories, but lack the fundamentals to support them. When you systematically evaluate businesses this way instead of chasing tips or reacting to market noise, investing stops feeling like gambling and starts feeling like building wealth.
We've automated this entire 10-question framework into a systematic scoring system. Instead of spending 2-3 hours hunting through 10-K filings, calculating ratios, and comparing metrics across years, you can see everything visualized and scored in minutes. Think of it as having these 10 questions already answered, scored, and organized for you, updated automatically as new financial data becomes available. Read this article for detailed information about our framework see all 10 questions applied to Microsoft, or explore it directly on the platform.
Beyond the 10 Questions: Complete Your Analysis
These 10 questions evaluate business fundamentals: the foundation of any investment decision. To complete your analysis, layer in these additional perspectives:
Peer Comparison: Context matters. Compare these metrics against direct competitors to gauge relative strength.
Valuation Analysis: Use DCF modeling to estimate intrinsic value and compare it to the current price.
Analyst Estimates: What are Wall Street analysts forecasting for revenue, earnings, and price targets?
Ownership Signals: Check insider buying/selling and institutional positioning for behavioral insights.
Catalyst Check: Review recent news, analyst updates, and upcoming events to understand the context better and conduct a qualitative evaluation.
When all analyses align positively, you've found a high-conviction opportunity. When they conflict (great business, terrible valuation, or weak fundamentals but positive momentum), you need to dig deeper and understand why.
Our platform organizes all these dimensions (from the 10-pillar business quality assessment to peer comparisons, DCF valuation, insider activity, and news) so you can evaluate stocks comprehensively without jumping between a dozen different websites.
Quick Reference: The 10 Questions Checklist
- Is the company actually growing? (Revenue, EBITDA, Net Income CAGR >10%)
- Are shareholders getting richer? (EPS growth >10%, Revenue/Share, Book Value/Share growing)
- Is it efficient at making a profit? (Gross margin >40%, Net margin >10%)
- Does it use assets wisely? (Cash conversion cycle <60 days)
- Does it generate good returns? (ROE >15%, ROIC >12%)
- Does it generate real cash? (Positive FCF, Income quality >1.0)
- Can it pay its bills? (Current ratio >1.5, Quick ratio >1.0)
- Is the debt level safe? (Debt/Equity <1.0, Interest coverage >5x)
- Is the price reasonable? (Valuation vs. historical average and peers)
- Does it reward shareholders? (If applicable: Yield 2-6%, Payout <60%)
This article was originally published on Medium on 30 November 2025. All data, prices, and results reflect information available at the time of publication. We have retained the original publication date on this platform for consistency.
Data sourced from Financial Modeling Prep API.
This article is for educational purposes only and does not constitute investment advice. Always conduct your own research and consider consulting with financial professionals before making investment decisions.