
Microsoft Case Study: The 10-Question Framework in Action
How a company scores 4.0/5.0 using our systematic approach. A walkthrough of Microsoft's fundamentals across all 10 questions: where it excels, where it falls short, and what the numbers reveal.
In our previous article, we introduced a 10-question framework for evaluating stocks based on business fundamentals. Theory is helpful, but nothing beats seeing it work with real numbers. Today, we're walking through Microsoft (MSFT) as a live case study, showing exactly how to apply each question and what the answers reveal about business quality.
Microsoft scores an overall 4.0 out of 5.0 on our framework. But more importantly, the breakdown shows why the rating lands where it does and where potential concerns lie. Let's examine each pillar.
Question 1: Is the Business Actually Growing? (Score: 4.0/5)
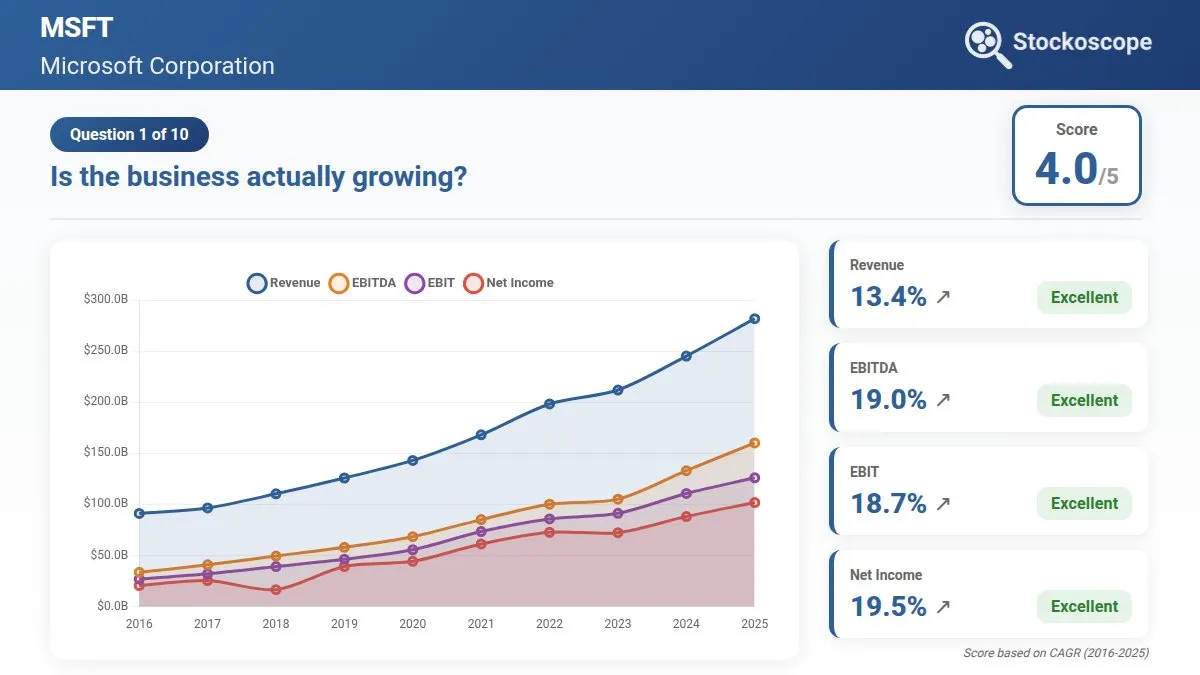
Figure 1: Microsoft's revenue has tripled over the past decade while profitability grew even faster: revenue CAGR of 13.4% vs. net income CAGR of 19.5%.
The Numbers:
- Revenue: $91.2B (2016) -> $281.7B (2025) | 13.4% CAGR
- EBITDA: $33.5B (2016) -> $160.2B (2025) | 19.0% CAGR
- EBIT: $26.9B (2016) -> $126.0B (2025) | 18.7% CAGR
- Net Income: $20.5B (2016) -> $101.8B (2025) | 19.5% CAGR
What This Tells Us:
Microsoft demonstrates consistent, multi-year expansion. Revenue has tripled over the past decade with double-digit growth rates across all profitability metrics.
Notice something crucial: net income is growing faster than revenue. This isn't just a bigger company, it's a more profitable company. Microsoft is capturing more value from every dollar of sales, a hallmark of improving competitive positioning.
The consistency matters too. These aren't single-year spikes from one-time events. This is sustained, compounding growth driven by cloud computing (Azure), productivity software (Office 365), and intelligent cloud services.
Microsoft shows excellent growth with accelerating profitability, passing the first test clearly.
Question 2: Are Shareholders Getting Richer? (Score: 4.8/5)
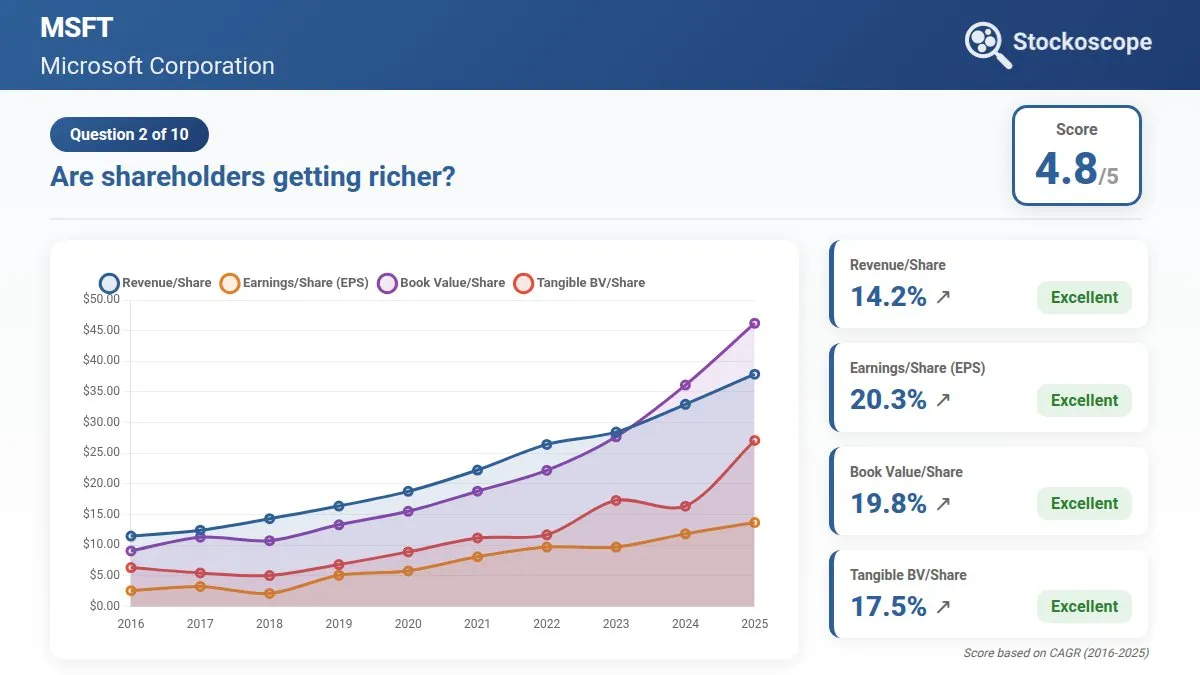
Figure 2: All per-share metrics trending upward consistently: EPS grew at 20.3% CAGR while book value per share increased at 19.8% CAGR, showing genuine shareholder wealth creation.
The Numbers:
- Revenue/Share: $11.50 (2016) -> $37.90 (2025) | 14.2% CAGR
- EPS: $2.59 (2016) -> $13.70 (2025) | 20.3% CAGR
- Book Value/Share: $9.08 (2016) -> $46.21 (2025) | 19.8% CAGR
- Tangible BV/Share: $6.36 (2016) -> $27.09 (2025) | 17.5% CAGR
What This Tells Us:
Here's where Microsoft truly shines. Not only is the business growing, but shareholders are getting richer on a per-share basis at exceptional rates.
EPS growing at over 20% annually means your ownership stake in Microsoft's profits has increased fivefold over this period. Book value per share quintupling tells you the underlying net worth of your shares has grown dramatically.
This is growth without dilution. Microsoft isn't funding expansion by constantly issuing new shares and watering down existing shareholders. Instead, the company is buying back stock (reducing share count) while growing profits, a powerful combination that compounds shareholder wealth.
Compare this to companies that grow revenue 15% annually but issue 10% more shares each year. Your per-share value barely moves. Microsoft does the opposite.
Microsoft shows outstanding per-share value creation on this measure. This is what compounding looks like.
Question 3: Is It Efficient at Generating Profit? (Score: 5.0/5)
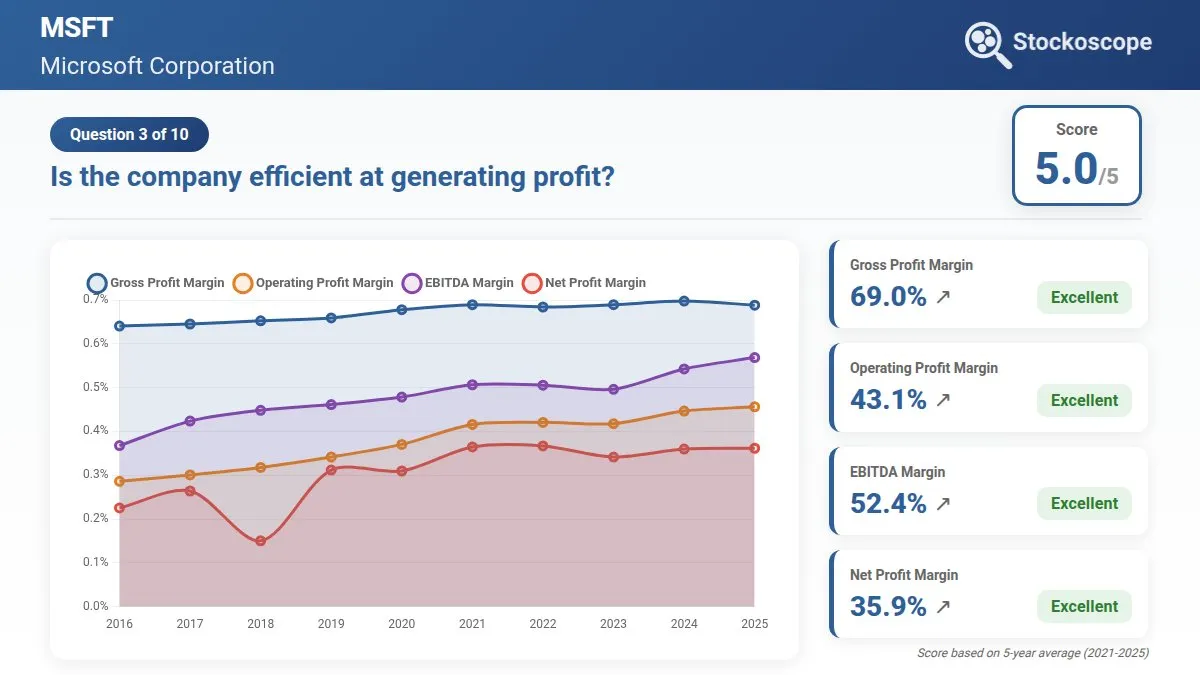
Figure 3: All four margin metrics expanding consistently over time: gross margin reached 69%, operating margin 43%, and net margin 36%, demonstrating powerful pricing power and operational leverage.
The Numbers:
- Gross Profit Margin: 64.0% (2016) -> 68.8% (2025)
- Operating Profit Margin: 28.6% (2016) -> 45.6% (2025)
- EBITDA Margin: 36.8% (2016) -> 56.9% (2025)
- Net Profit Margin: 22.5% (2016) -> 36.1% (2025)
What This Tells Us:
Microsoft earns a perfect score on profitability metrics, and for good reason. Not only are margins exceptionally high, they're expanding consistently over time.
A 69% gross margin means Microsoft keeps $0.69 of every dollar in revenue after direct costs. The 36% net margin means that after paying all expenses, Microsoft still pockets $0.36 of every dollar as profit. These numbers are extraordinary.
But the trend is even more important than the level. Operating margins nearly doubling over the period signal that Microsoft has genuine pricing power and scale advantages. As the business grows, it's becoming more efficient, not less, the opposite of what happens to struggling companies.
This margin expansion reflects Microsoft's shift toward higher-margin cloud services and subscription software. When you can raise prices (Office 365 subscriptions) while competitors struggle to match your offerings (Azure's scale), margins expand. This is a moat showing up in the numbers.
Microsoft shows exceptional profitability with improving trends on this measure, consistent with competitive advantages at work.
Question 4: Does It Use Assets Wisely? (Score: 3.5/5)
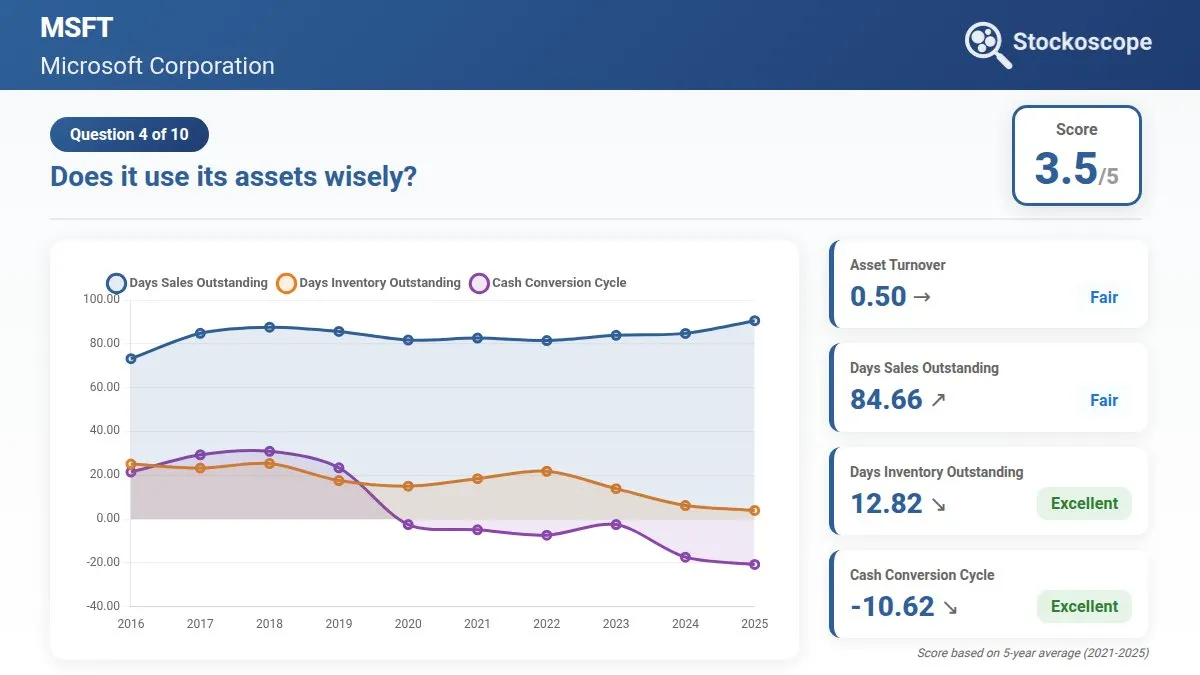
Figure 4: Cash conversion cycle dramatically improved from +21 days to -21 days, meaning Microsoft now collects from customers before paying suppliers. Days inventory outstanding dropped from 25 to just 4 days.
The Numbers:
- Asset Turnover: 0.47 (2016) -> 0.46 (2025)
- Days Sales Outstanding: 73 (2016) -> 91 (2025)
- Days Inventory Outstanding: 25 (2016) -> 4 (2025)
- Cash Conversion Cycle: 21 (2016) -> -21 (2025)
What This Tells Us:
Microsoft scores moderately here, which deserves explanation. Asset turnover staying flat around 0.5 means Microsoft generates roughly $0.50 in revenue per dollar of assets. For a capital-light software business, this is reasonable but not exceptional.
Days sales outstanding increasing from 73 to 91 days means customers are taking longer to pay, not ideal and worth monitoring. This could reflect extended payment terms for large enterprise contracts or shifts in customer mix. However, Microsoft has more than offset this by dramatically reducing inventory days (25 -> 4) as the business shifts toward digital products, and likely extending its own payment terms with suppliers. The net result? A cash conversion cycle of -21 days, meaning Microsoft now collects cash from customers before paying suppliers, effectively funding operations with other people's money.
Microsoft shows adequate asset efficiency with mixed signals here. The negative cash conversion cycle reflects strong working capital management, though rising collection days deserve continued monitoring.
Question 5: Does It Generate Good Returns? (Score: 4.3/5)
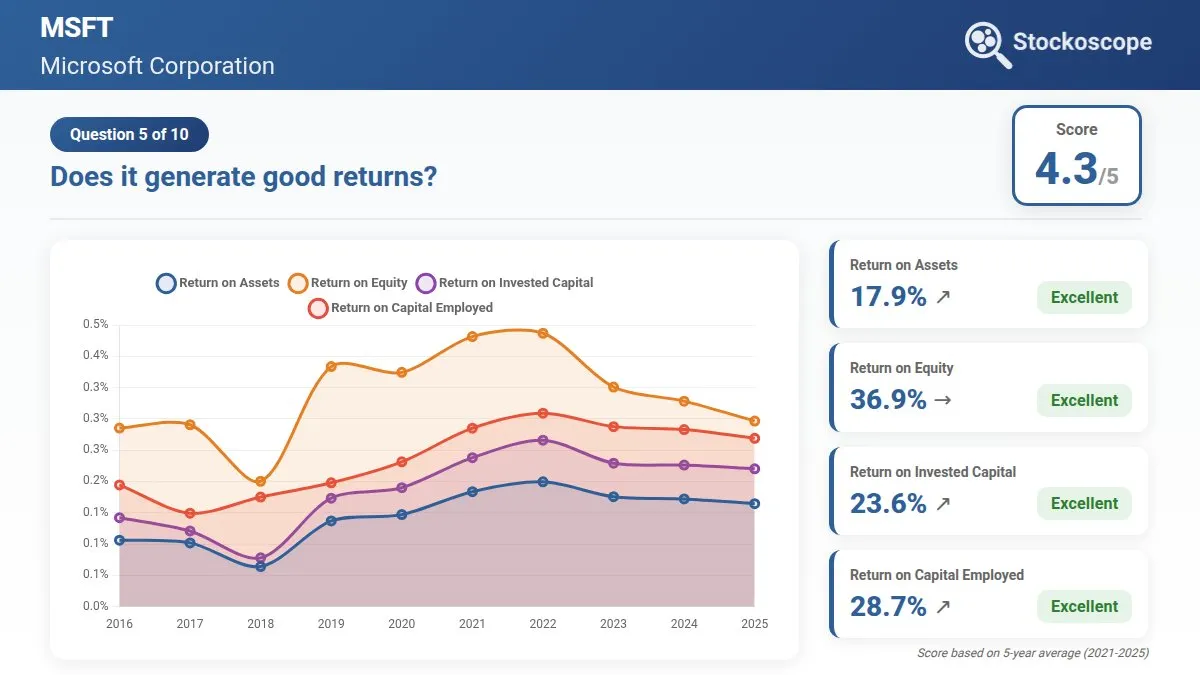
Figure 5: All four return metrics are improving over time, signaling durable competitive advantages, though they have been either steady or declining since 2022.
The Numbers:
- Return on Assets: 10.6% (2016) -> 16.4% (2025)
- Return on Equity: 28.5% (2016) -> 29.6% (2025)
- Return on Invested Capital: 14.2% (2016) -> 22.0% (2025)
- Return on Capital Employed: 19.4% (2016) -> 26.9% (2025)
What This Tells Us:
Microsoft generates excellent returns on capital, with all four metrics showing meaningful improvement over the past decade. However, a closer look reveals an important pattern: returns peaked around 2021-2022 and have since stabilized or declined modestly.
ROE near 37% at its peak has settled back to around 30%. It's still excellent and well above the 15% threshold for quality businesses. This level indicates Microsoft can fund growth internally without constantly tapping capital markets. Similarly, ROIC climbed impressively from 14% to above 25% at its peak before moderating to current levels around 24%.
The recent moderation in returns isn't necessarily alarming. It likely reflects the massive capital investments Microsoft is making in AI infrastructure, data centers, and cloud expansion. These investments temporarily depress returns as capital is deployed before generating full returns. The question is whether these investments will reignite return growth or whether Microsoft is reaching natural maturity limits.
ROIC above 20% remains significant. This metric strips out the impact of financial leverage and shows the true return on all capital invested in the business. Even with recent moderation, Microsoft is deploying capital into projects that generate attractive returns. It's a sign of continued competitive advantages, though perhaps not strengthening as rapidly as earlier in the decade.
Microsoft shows strong returns that improved dramatically over the decade, though recent peak-to-present trends warrant monitoring. Current levels remain excellent, but the trajectory has flattened after years of expansion.
Question 6: Does It Generate Real Cash? (Score: 3.8/5)
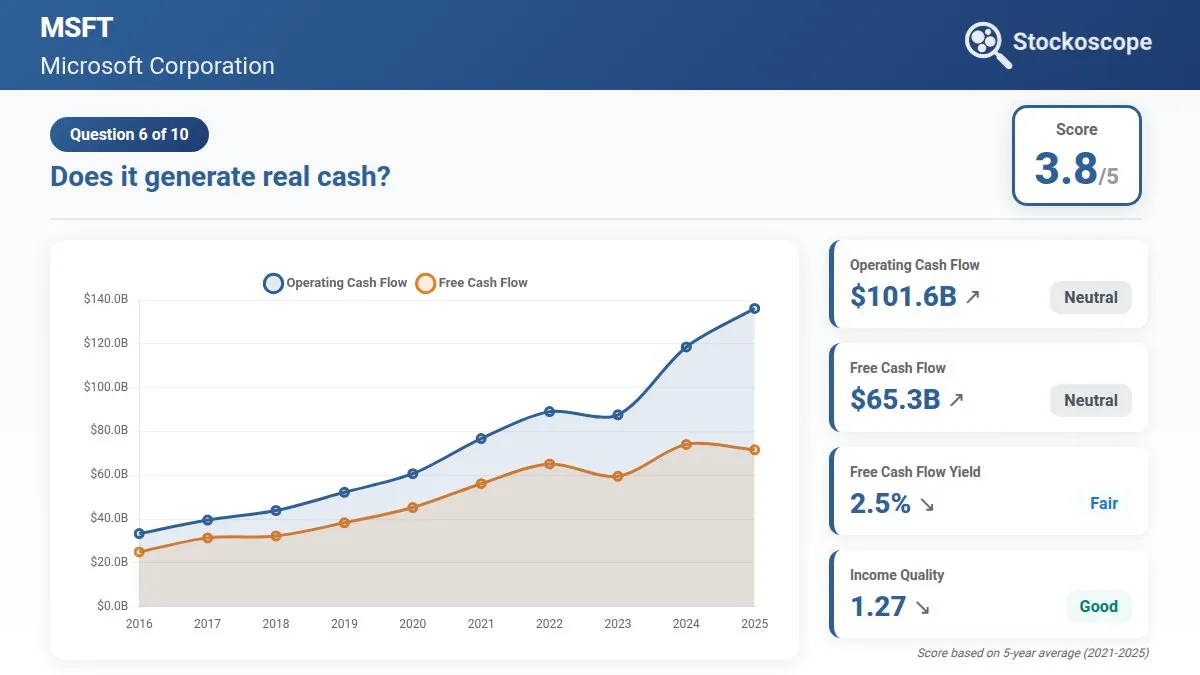
Figure 6: Operating cash flow quadrupled from $33B to $136B, with free cash flow reaching $72B. Income quality ratio of 1.34 confirms profits convert to real cash.
The Numbers:
- Operating Cash Flow: $33.3B (2016) -> $136.2B (2025)
- Free Cash Flow: $25.0B (2016) -> $71.6B (2025)
- Free Cash Flow Yield: 6.2% (2016) -> 1.9% (2025)
- Income Quality: 1.62 (2016) -> 1.34 (2025)
What This Tells Us:
Microsoft generates massive cash flows that have grown dramatically: operating cash flow has quadrupled. Free cash flow of $72B gives Microsoft enormous flexibility to invest, acquire, return cash to shareholders, or weather any downturn.
However, the declining free cash flow yield (1.9%) reflects Microsoft's rising valuation more than weakening cash generation. When a stock price appreciates faster than cash flow growth, the yield falls, a valuation signal rather than a business quality concern.
Income quality above 1.0 is healthy, showing profits convert to real cash. The ratio of 1.34 means Microsoft generates $1.34 in operating cash flow for every dollar of net income. The slight decline from 1.62 isn't alarming but suggests accounting profits are growing faster than cash generation. It's worth monitoring, but not concerning, given the absolute cash flow growth.
Microsoft shows excellent cash generation in absolute terms. Declining yields and quality ratios reflect valuation expansion, not business deterioration.
Question 7: Can It Pay Its Bills? (Score: 2.3/5)
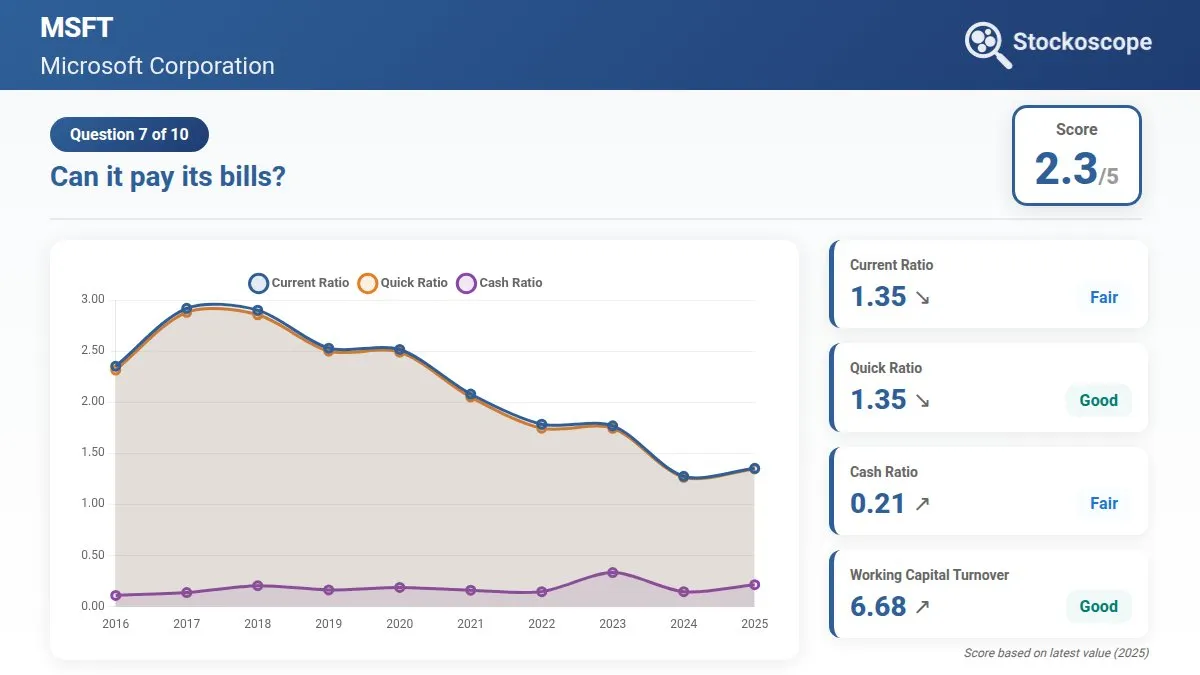
Figure 7: Liquidity ratios have declined from 2017 highs, with current and quick ratios now at 1.35, while working capital turnover improved dramatically to 6.68, showing more efficient capital use.
The Numbers:
- Current Ratio: 2.35 (2016) -> 1.35 (2025)
- Quick Ratio: 2.31 (2016) -> 1.35 (2025)
- Cash Ratio: 0.11 (2016) -> 0.21 (2025)
- Working Capital Turnover: 1.19 (2016) -> 6.68 (2025)
What This Tells Us:
Microsoft scores lowest on liquidity, but context matters enormously here. A current ratio of 1.35 means Microsoft has $1.35 in current assets for every dollar of current liabilities, above the minimum threshold of 1.0 but below the ideal of 1.5.
Should you worry? Probably not. For a mature, cash-generating giant like Microsoft, modest liquidity ratios aren't concerning. The company generates $136B in annual operating cash flow and has excellent access to capital markets. Microsoft could tap credit markets instantly if needed.
The declining ratios largely reflect efficient cash management: Microsoft isn't letting excess cash sit idle, earning nothing. The company returns cash to shareholders through dividends and buybacks rather than hoarding it on the balance sheet.
The improving working capital turnover shows Microsoft is using working capital more efficiently, generating more revenue per dollar of working capital deployed.
Microsoft shows adequate liquidity for a mature, cash-generative business. Lower ratios reflect efficient capital deployment rather than financial stress.
Question 8: Is the Debt Level Safe? (Score: 5.0/5)
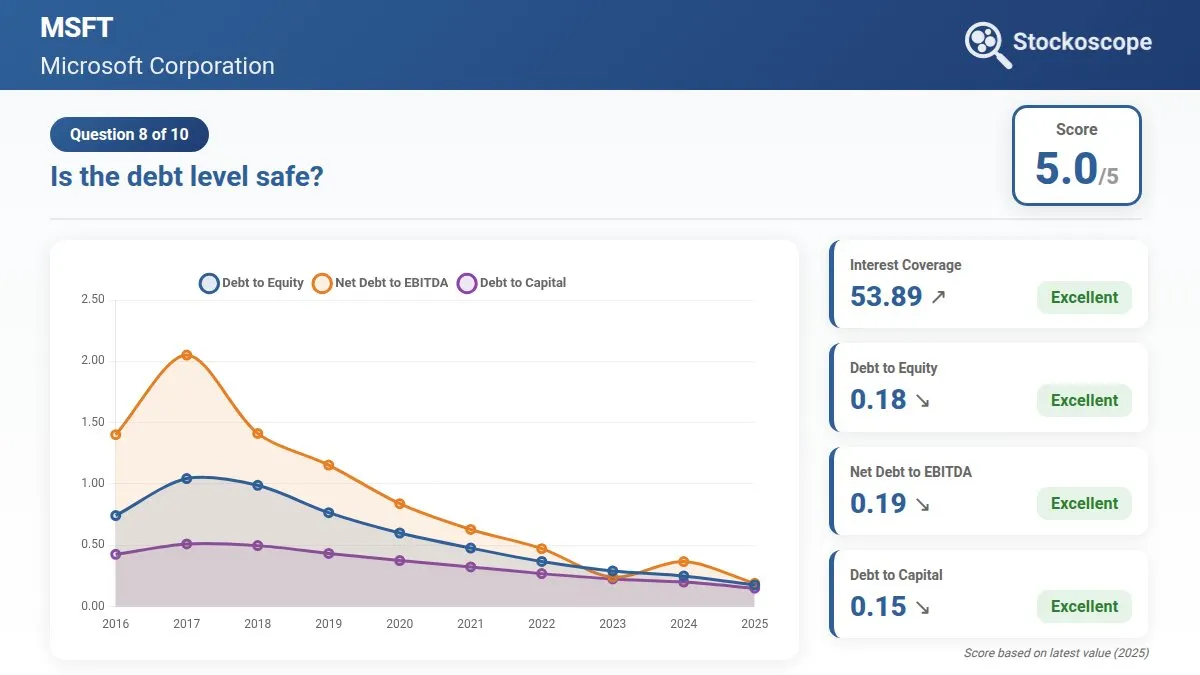
Figure 8: All debt metrics improving dramatically: interest coverage soared to 54x, debt-to-equity dropped to 0.18, and net debt-to-EBITDA fell to just 0.19, creating a fortress balance sheet.
The Numbers:
- Interest Coverage: 21.0x (2016) -> 53.9x (2025)
- Debt to Equity: 0.74 (2016) -> 0.18 (2025)
- Net Debt to EBITDA: 1.40 (2016) -> 0.19 (2025)
- Debt to Capital: 0.43 (2016) -> 0.15 (2025)
What This Tells Us:
Microsoft operates with an exceptionally strong balance sheet, earning a perfect score on debt safety.
Interest coverage of 54x means Microsoft could pay its annual interest expense 54 times over from operating earnings. This is fortress-level coverage providing complete flexibility regardless of the interest rate environment.
Debt-to-equity of just 0.18 means Microsoft has $0.18 of debt for every dollar of equity, minimal leverage. The company funds growth primarily through retained earnings rather than borrowed money, reducing financial risk.
Net debt-to-EBITDA of 0.19 means Microsoft could pay off all net debt in roughly two months of EBITDA generation. Compare this to struggling companies carrying 5-8x debt-to-EBITDA.
The declining debt ratios show Microsoft is steadily strengthening an already-strong balance sheet. This provides enormous strategic flexibility: Microsoft can invest aggressively in R&D, make transformative acquisitions, or weather prolonged downturns without financial distress.
Microsoft shows exceptional balance sheet strength on this measure, operating from a position of maximum financial flexibility.
Question 9: Is the Price Reasonable? (Score: 1.0/5)
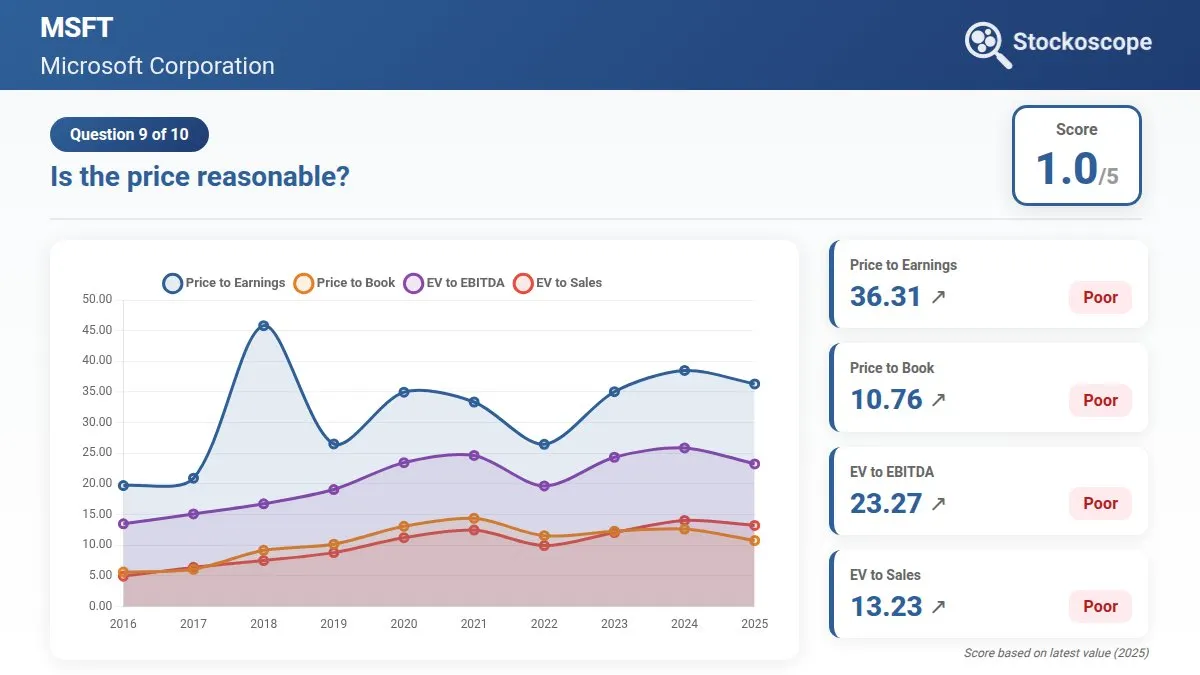
Figure 9: All valuation multiples have expanded significantly above historical averages: P/E reached 36x, P/B hit 11x, and EV/EBITDA climbed to 23x, all well above 2016-2020 levels.
The Numbers:
- Price to Earnings: 19.7x (2016) -> 36.3x (2025)
- Price to Book: 5.6x (2016) -> 10.8x (2025)
- EV to EBITDA: 13.5x (2016) -> 23.3x (2025)
- EV to Sales: 5.0x (2016) -> 13.2x (2025)
What This Tells Us:
Here's where Microsoft faces challenges. All valuation multiples have expanded significantly, with the stock now trading well above historical averages.
A P/E of 36x means investors pay $36 for every dollar of current earnings. While not as extreme as some growth stocks, this is elevated for a mega-cap company. The historical P/E averaged closer to 25-30x during most of the past decade.
The question isn't whether Microsoft is a great business; it scores exceptionally across almost every fundamental metric. The question is whether the price adequately reflects that quality, or whether expectations have gotten ahead of reality.
At current multiples, Microsoft is priced for continued strong growth and margin expansion. Any stumble (slowing cloud growth, competitive pressure on Azure, or macroeconomic headwinds) would likely result in a multiple compression and significant stock price declines.
On this measure Microsoft trades above historical norms and the level its fundamentals would suggest, leaving a limited margin of safety on the model's estimate at current multiples.
Question 10: Does It Reward Shareholders? (Score: 4.5/5)
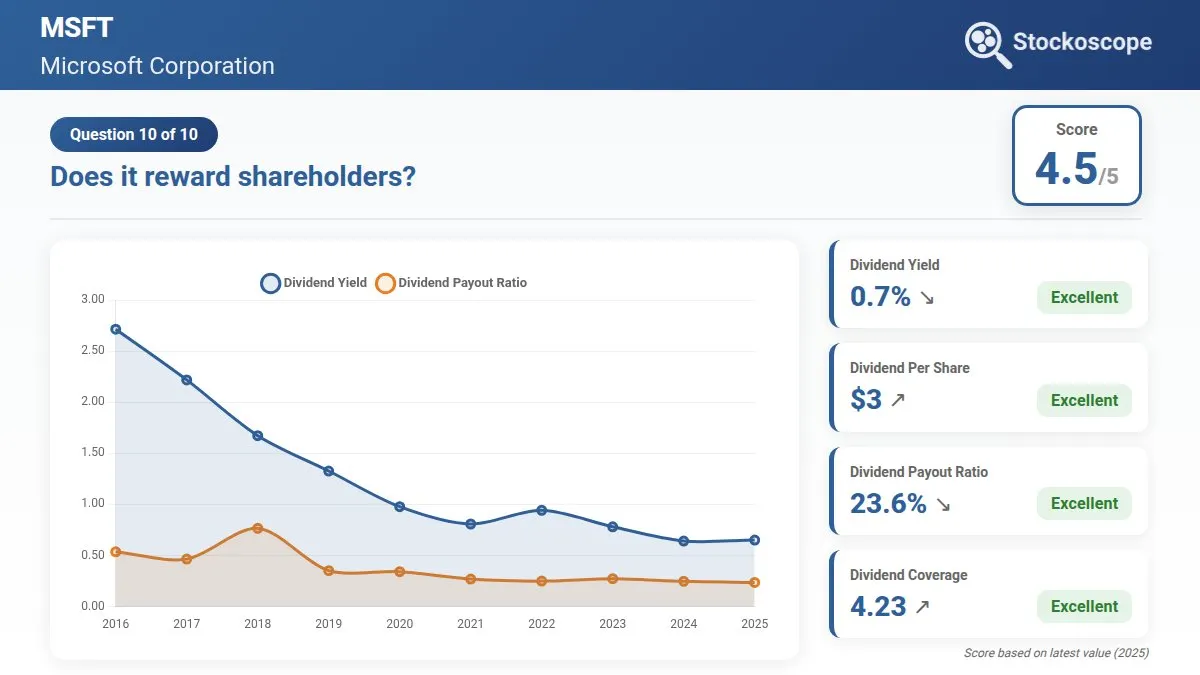
Figure 10: Dividend per share more than doubled from $1.39 to $3.24, while payout ratio dropped to just 24% and coverage improved to 4.2x, making the dividend highly sustainable despite lower yield.
The Numbers:
- Dividend Yield: 2.7% (2016) -> 0.7% (2025)
- Dividend Per Share: $1.39 (2016) -> $3.24 (2025)
- Dividend Payout Ratio: 53.6% (2016) -> 23.6% (2025)
- Dividend Coverage: 1.87x (2016) -> 4.23x (2025)
What This Tells Us:
Microsoft demonstrates excellent shareholder return practices, despite the declining yield.
The dividend per share has more than doubled, a 10% CAGR. The declining yield (0.7%) reflects Microsoft's stock price appreciating faster than the dividend grows, not dividend cuts.
More importantly, the payout ratio falling to 24% and coverage ratio improving to 4.2x shows the dividend is extremely sustainable. Microsoft pays out less than one-quarter of earnings as dividends, retaining the rest for growth investments and buybacks.
This low payout ratio provides a huge cushion. Even if earnings dropped 50% in a severe recession, Microsoft could maintain the dividend comfortably. Companies with 80%+ payout ratios face dividend cuts in downturns; Microsoft faces no such risk.
Beyond dividends, Microsoft returns substantial cash through share buybacks, which don't show up in yield calculations but benefit shareholders by increasing per-share value.
Microsoft shows a sustainable, growing dividend with excellent coverage. Low yield reflects stock appreciation, not poor shareholder returns.
Putting It All Together: What the 4.0/5.0 Score Means
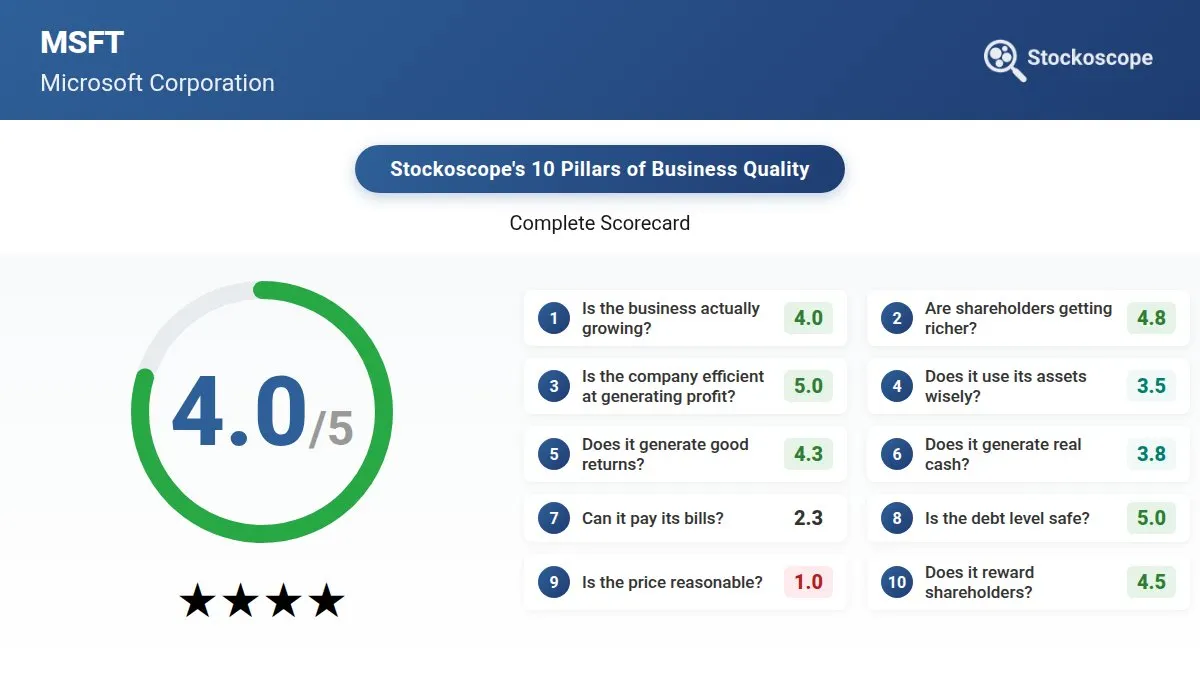
Figure 11: Microsoft's complete scorecard, scoring high in 8 of 10 categories with perfect scores in profitability, debt safety, and shareholder value creation, offset by concerns around valuation and modest liquidity. Full breakdown on our Quality Analysis page.
Microsoft's 4.0 out of 5.0 score reflects two stories: strong business fundamentals alongside a stretched valuation. The company earns perfect or near-perfect scores across six pillars: profit efficiency, debt safety, shareholder value creation, shareholder rewards, business growth, and returns on capital. These scores aren't just high numbers; they reflect competitive advantages showing up consistently in the financials. Expanding margins, improving returns, and fortress-level balance sheet strength reflect a business operating from a position of strength.
The moderate scores on asset efficiency and cash generation warrant monitoring but don't signal fundamental problems. Rising collection days and declining cash flow yields reflect business model shifts and valuation expansion rather than operational deterioration. The lowest liquidity score reflects efficient capital deployment rather than financial stress: Microsoft generates enough cash to meet obligations comfortably despite ratios below ideal thresholds.
The outlier? Valuation scores just 1.0 out of 5.0. Every multiple (P/E, P/B, EV/EBITDA, EV/Sales) trades well above historical averages and significantly above levels that historically produce strong forward returns. This creates the central tension in Microsoft's investment case: strong fundamentals at a price that prices in near-perfection.
The Investment Thesis: Quality at a Price
This scorecard crystallizes the classic investing dilemma: what do you pay for quality? Microsoft checks nearly every box for business excellence: durable moats, consistent growth, expanding margins, and shareholder-friendly capital allocation. Yet at 36x earnings and 23x EV/EBITDA, the stock prices in near-perfection, leaving minimal room for disappointment.
The bull case hinges on Microsoft sustaining 15%+ earnings growth through Azure expansion and AI monetization (Copilot, OpenAI integration). If the company delivers, today's multiples could prove justified. The bear case counters that even excellent businesses disappoint at elevated valuations: when growth inevitably slows, multiple compression can wipe out years of business progress. Historically, paying 35-40x earnings has produced underwhelming forward returns, regardless of business quality.
How to weigh that depends on your investor profile and time horizon. What the data shows is that the margin of safety on the model's estimate is limited at the current price, and the multiple leaves little room for disappointment.
The Bottom Line
Microsoft exemplifies what a high-quality business looks like across almost every dimension. The 4.0/5.0 score reflects genuine excellence in fundamentals, with the only significant weakness being valuation.
This case study demonstrates how the 10-question framework works in practice. By systematically evaluating each pillar, you move beyond stories and hype to understand what the business actually delivers: growth, profitability, returns, and financial strength.
Whether Microsoft is right for your portfolio depends on factors beyond this analysis: your time horizon, risk tolerance, portfolio concentration, and view on valuation. But armed with this framework, you're equipped to make that decision based on evidence rather than emotion.
Want to see this analysis for other stocks? Our platform applies this 10-pillar framework systematically across 1,500 companies, updating automatically as new financial data becomes available. Check the Business Quality Analysis page to explore more.
Beyond the Scores: The Complete Picture
These 10 questions assess business fundamentals, the foundation of investment analysis. To complete your decision, layer in:
Peer Comparison: How does Microsoft stack up against Alphabet, Amazon (AWS), and other cloud competitors?
Valuation Analysis: What's Microsoft's intrinsic value based on discounted cash flows? Does it justify current prices?
Analyst Estimates: What are Wall Street analysts forecasting for revenue, earnings, and price targets?
Holdings Analysis: What are insiders and institutions doing? Recent buying or selling patterns?
Catalysts and News: Are there upcoming product launches, regulatory concerns, or competitive threats to monitor?
Qualitative Factors: Management quality, competitive positioning, technology trends, AI opportunities, etc.
When you combine quantitative fundamentals (the 10 questions) with qualitative context (management, moat, catalysts), you get a complete investment thesis.
This article was originally published on Medium on 18 December 2025. All data, prices, and results reflect information available at the time of publication. We have retained the original publication date on this platform for consistency.
Data sourced from Financial Modeling Prep API.
This article is for educational purposes only and does not constitute investment advice. Always conduct your own research and consider consulting with financial professionals before making investment decisions.