
The Case for Lululemon: Finding Quality in the Wreckage of a 67% Collapse
When a high-quality business sees its valuation multiple compressed by 62%, is it time to be greedy when others are fearful?

The Carnage
Let's not sugarcoat it: Lululemon Athletica (LULU) has been absolutely destroyed.
From its December 2023 all-time high of $511, the stock has plummeted to $170.54 as of 1 November 2025, a catastrophic 67% decline that has left investors shell-shocked. The once-darling of the athleisure movement has seen half its market value evaporate in under two years.
And yet, our quantitative algorithm just scored it fifth on the quality lens for November 2025, with an overall score of 7.23/10. So what do we know that the market doesn't? Or are we about to catch a falling knife?
What Went Wrong: The Perfect Storm
The descent wasn't sudden: it was death by a thousand cuts. Multiple factors converged to create investor panic:
Product Missteps: The July 2024 Breezethrough leggings launch became a cautionary tale when customers complained the $98 pants had unflattering seams that created a "whale tail" effect. Lululemon pulled the product after receiving just 3.1 stars from 112 reviews, raising concerns about product innovation following the departure of longtime Chief Product Officer Sun Choe.
U.S. Sales Stagnation: The Americas segment, representing ~70% of revenue, hit a wall with just 3% revenue growth and flat comparable sales in Q1 2024, deteriorating to 1% growth with -3% comparable sales by Q2. The company's core market was no longer delivering the double-digit growth investors expected.
Rising Competition: Alo Yoga, Vuori, and other athleisure brands aggressively targeted Lululemon's customer base with similar products at competitive prices. The market that Lululemon pioneered had become crowded and intensely competitive.
Tariff Pressures: With manufacturing concentrated in Vietnam (42% of products), Cambodia (16%), and other Asian countries, escalating tariff threats posed a significant margin risk. The removal of the de minimis exemption alone represented a 1.7 percentage point hit to profits.
Disappointing Guidance: Management's 2025 revenue growth guidance of 4-6% was a far cry from the company's historical double-digit growth rates of 15-30%. This signaled that Lululemon's days as a high-growth story might be over.
The market's verdict was brutal. After weak Q2 2025 earnings, the stock was down more than 45% year-to-date, making it one of the S&P 500's worst performers.
LULU Through the Quality Lens: The Contrarian Case
This is where it gets interesting. Despite the bloodbath, our quantitative algorithm flagged LULU as a quality opportunity. The system doesn't read headlines, doesn't feel fear, and doesn't care about momentum. It just evaluates businesses on fundamentals. For those interested in the detailed methodology, we've covered our scoring framework in depth in previous articles.
What caught the algorithm's attention wasn't that LULU is perfect. It's that a strong business is being priced as if much of its quality is impaired. LULU earned an overall quality score of 7.2 out of 10 and passed 4 out of 5 validation checks. More importantly, it showed something rare: strong fundamentals meeting extreme valuation dislocation.
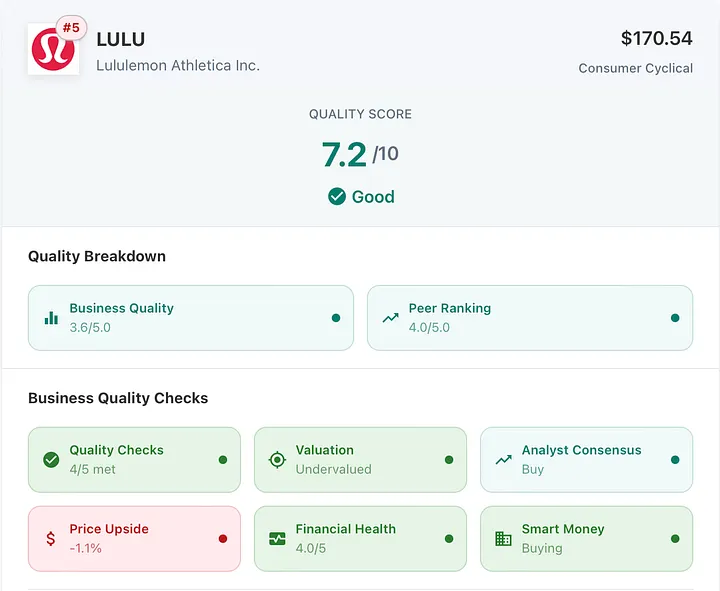
Figure 1. LULU scores fifth on the quality lens in November with a solid score of 7.2/10, indicating strong fundamentals, though recent price action and institutional flows tell a more cautious story.
The Business Hasn't Broken
The story is actually quite simple when you look at the data. Over the past decade, from 2015 to 2024, LULU grew earnings per share from $1.90 to $14.67. That's nearly an 8x increase. Return on equity currently sits at 42%, meaning that for every dollar of shareholder capital, the company generates 42 cents in profit. Operating margins are running at 23%, which is exceptional for retail. Free cash flow hit $1.58 billion in fiscal 2024. These aren't the numbers of a dying business.
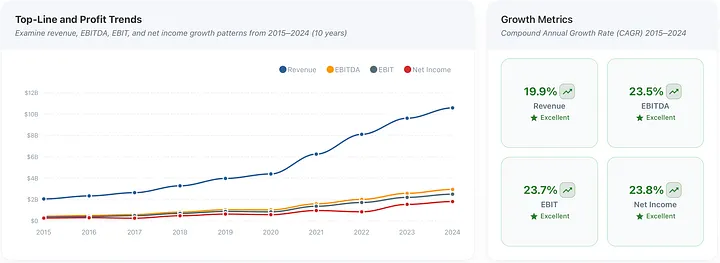
Figure 2. LULU scaled from $2B to $10.6B in revenue while growing net income at 23.8% annually.
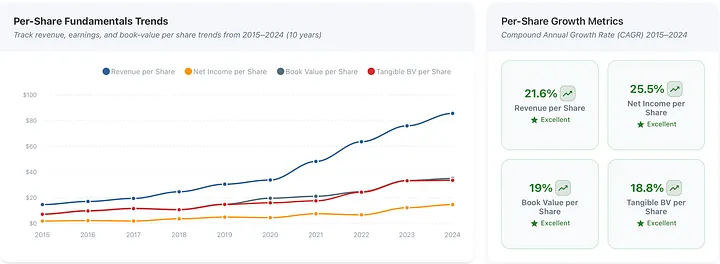
Figure 3. LULU's per-share fundamentals tell the real story: 25.5% net income CAGR, 21.6% revenue CAGR over the past decade. This isn't a broken business.
When we compare LULU to its sector peers in Consumer Cyclical, it's not just holding its own. It's outperforming on the metrics that matter most for long-term value creation. The margin efficiency ranks among the highest in its sector. The returns metrics are top-tier. The per-share fundamentals show superior shareholder value creation over time. Yes, growth has slowed. Yes, the U.S. market is challenging. But LULU is still beating its competitors where it counts.
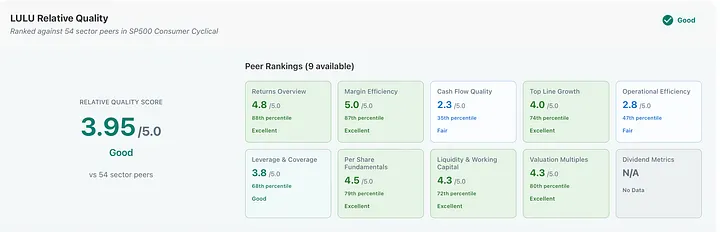
Figure 4. The peer comparison reveals the disconnect: LULU outperforms 87% of Consumer Cyclical peers on margins and 79% on per-share fundamentals, yet trades at valuation multiples higher than 80% of competitors. Premium quality at a compressed multiple. Full breakdown on our Peer Comparison page.
The Multiple Compression Story
But here's where it gets fascinating. The company's P/E ratio was 27.98 in fiscal 2024. Fast forward to today's trailing twelve months, and it's collapsed to 10.76. That's a 62% compression in what investors are willing to pay for those earnings. The business fundamentals haven't collapsed by 62%. The margins are still there. The cash flow is still being generated. The ROE remains high. What collapsed is the multiple.
Think about what a P/E of 10.76 means. You're paying less than 11 times earnings for a business that generates 42% returns on equity with 23% operating margins. The market is essentially saying one of two things: either margins are about to crater, or competition is going to destroy the business model.
Our DCF model supports the P/E and estimates that LULU is currently priced below intrinsic value, suggesting that a business with 23% operating margins, 42% ROE, and strong free cash flow trading at a P/E of 10.76 is being priced for disaster.
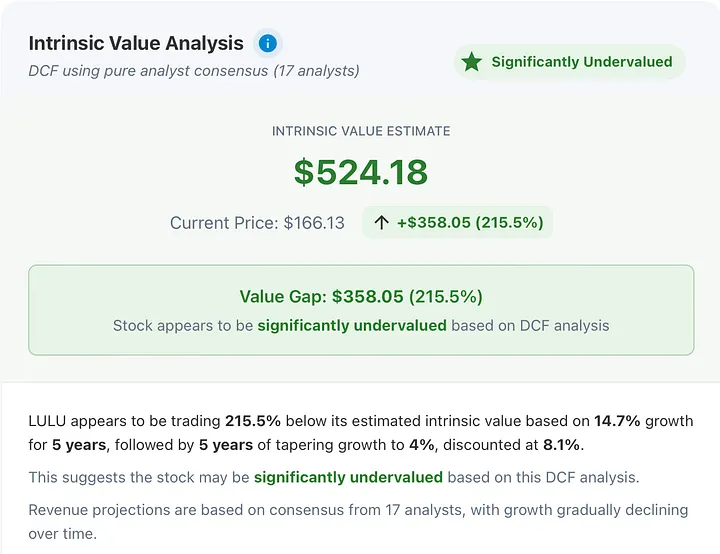
Figure 5. According to a DCF analysis, our model estimates $LULU is priced below intrinsic value, with an estimated intrinsic value of $524.18 versus a current price of $166.13, a potential 215.5% upside based on assumed growth assumptions. Run your own scenarios on our Valuation Analysis page.
Institutions Fleeing
The validation checks tell a story of diverging opinions. LULU passed our DCF fair valuation threshold, maintains a financial health score of 4.0 out of 5.0, has a majority Buy rating from analysts, and shows strong insider buying (albeit passive). The only check it failed was analyst upside, where current price targets essentially match the stock price, reflecting Wall Street's pessimism.
Yet institutional sentiment tells another story. In Q3 2025, LULU saw a $22 billion net outflow and 249 fewer institutional holders than in the previous quarter. Institutions are repositioning and have a negative sentiment ratio that speaks volumes about professional money managers' near-term confidence in the stock.
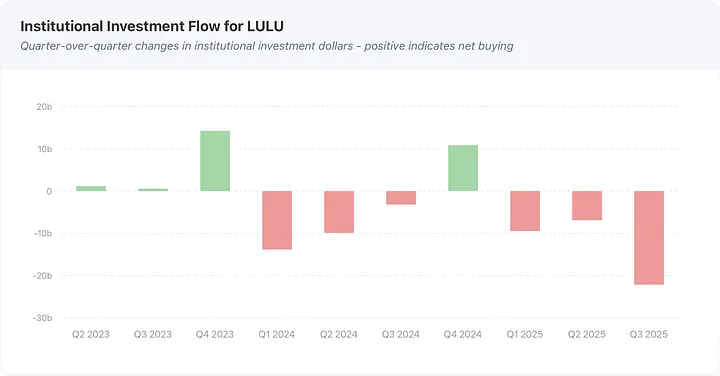
Figure 6. Institutional Investment Flow for LULU: quarter-over-quarter net flows show whether institutions are buying or selling. Positive bars = net buying; negative = net selling.
The Contrarian Thesis: Quality on Sale
The investment case for LULU at $170 isn't about betting on a turnaround or hoping for a return to glory days. It's about recognizing that a fundamentally excellent business has been repriced at a 62% valuation discount.
Yes, growth has slowed. Yes, the U.S. market faces headwinds. Yes, competition is intensifying. But the data shows operating margins remain exceptional at 22.9% (TTM), return on equity stands at 42.1% (TTM), the balance sheet maintains a current ratio of 2.27 with minimal debt, and free cash flow generation hit $1.58 billion in FY 2024.
The valuation disconnect is stark. A business with 23% operating margins and 42% ROE is trading at a P/E of 10.76. Compare this to the FY 2024 P/E of 27.98, which is a 62% multiple compression in a matter of months. The market is pricing LULU as if margins will collapse or competition will destroy the business.
This is not a speculative bet on a dramatic comeback. It's recognizing a quality business whose stock has fallen more than the fundamentals alone would suggest. Our models estimate significant upside potential, though that depends on the assumptions holding and the outcome is uncertain over a 2-3 year horizon.
The Final Word
The market is terrified of LULU right now. Institutions are dumping shares. The stock has collapsed 67% from its highs. Analysts have slashed targets. Headlines are uniformly negative.
Our algorithm, focused purely on fundamentals, cash flows, and quality metrics, sees something different: a 7.23/10 quality business with 23% operating margins, 42% ROE, and $1.58 billion in free cash flow trading at a P/E of 10.76. It flagged a business generating 42% returns on equity with high margins and trading at less than 11 times earnings.
The market has compressed LULU's P/E by 62% (from 27.98 to 10.76) while the underlying business fundamentals remain strong. Either the market sees something catastrophic ahead, or this is an overreaction to temporary challenges.
That's the opportunity, and the risk.
The risk is being early, wrong about the competitive threats, or underestimating the permanent nature of LULU's challenges. The potential reward is that patient capital gets compensated for enduring the pain while the business stabilizes and the market reassesses.
This is not a recommendation to buy. It's a transparent look at why our quantitative system scored LULU highly despite (or perhaps because of) its spectacular fall from grace, while acknowledging the significant uncertainties involved.
Explore LULU's full quality breakdown on our Quality Analysis page. see how it scores across all 10 pillars against its Consumer Cyclical peers.
You can build and explore your own quality score, with the full scoring breakdown, on the Strategies page of our platform.
This article was originally published on Medium on 9 November 2025. All data, prices, and results reflect information available at the time of publication. We have retained the original publication date on this platform for consistency.
This analysis is for informational purposes only and should not be considered investment advice. Past performance does not guarantee future results. LULU is a volatile, contrarian position that could result in substantial losses. All investors should conduct their own research, consider their risk tolerance, and consult with qualified financial advisors before making investment decisions.