
The AI Platform Play: Salesforce's Valuation After the Reset
Salesforce has pulled back sharply from its highs despite accelerating AI-driven growth. We conduct a full DCF and multiples valuation to estimate where $195 sits relative to intrinsic value.
Salesforce (CRM) has been one of the defining enterprise software companies of the past two decades, growing from a CRM pioneer to the dominant platform for customer-facing business applications. Yet the stock has pulled back significantly from its highs, currently trading around $195 per share with a market cap of $183 billion.
The pullback comes despite Salesforce posting record revenue of $41.5 billion in fiscal 2026 and expanding EBITDA margins to over 30%, a remarkable transformation from the sub-20% margins of just a few years ago. With the company positioning Agentforce as its AI platform play and analyst consensus projecting continued double-digit growth, the question is clear: has the market overcorrected?
We can answer this by conducting a rigorous valuation analysis.
Growth Analysis
Our DCF engine uses an analyst-consensus-first approach to determine the growth rate. For Salesforce, analyst coverage is extensive: 42 analysts cover the current fiscal year, with 18-41 analysts providing estimates across five forward years (the full estimate set is on Salesforce's Analyst Estimates page). This deep coverage produces a high confidence score of 0.94.
The model calculates the compound annual growth rate implied by consensus revenue estimates from the last reported fiscal year ($41.5 billion) through the furthest forward estimate. The result: a 10.0% annual growth rate, reflecting analysts' collective view that Salesforce can sustain double-digit revenue expansion driven by platform adoption, pricing power, and AI monetization through Agentforce.
This rate then feeds into a two-phase projection. Phase 1 (Years 1-5) applies the 10.0% growth rate, projecting revenue from $45.7 billion to $66.9 billion. Phase 2 (Years 6-10) uses exponential tapering, smoothly decaying growth from 5.2% down to the 2.0% terminal rate. This avoids the unrealistic cliff effect where growth drops overnight, instead reflecting gradual business maturation.
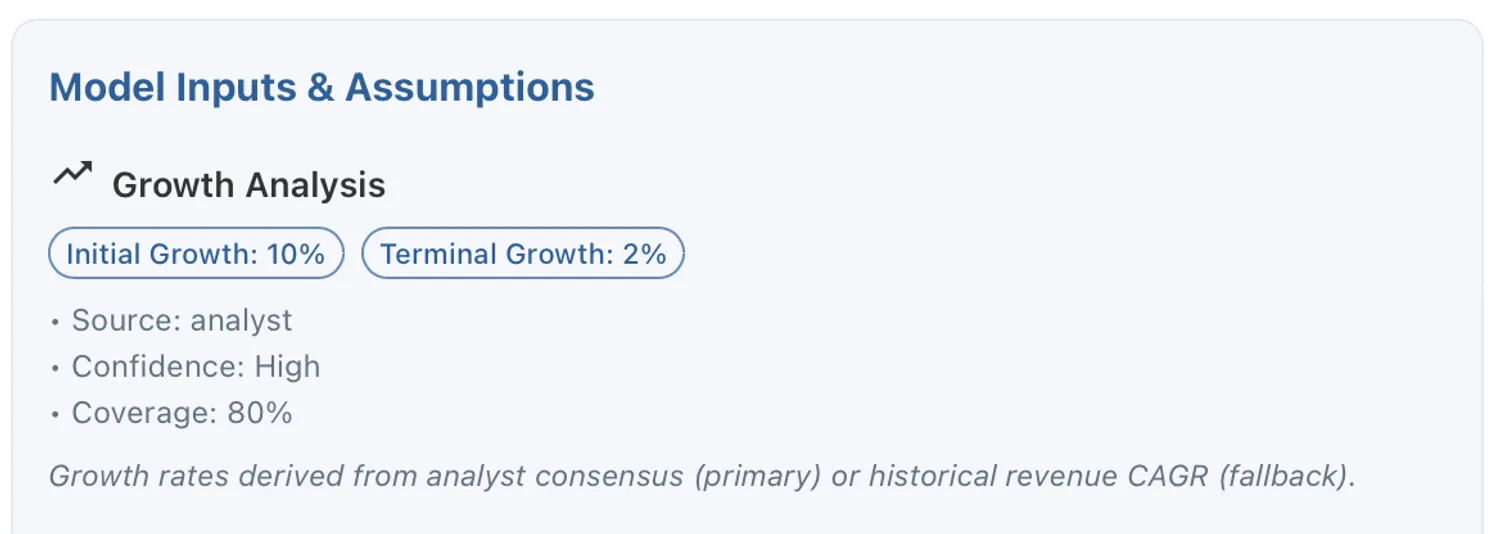
Figure 1. Growth analysis: 10.0% revenue CAGR derived from analyst consensus across 18-42 analysts, with 0.94 confidence score indicating strong coverage quality.
WACC Calculation
The discount rate is calculated using company-specific market data from Financial Modeling Prep (FMP), not industry averages or static assumptions.
Cost of Equity (9.96%): Built from the Capital Asset Pricing Model using FMP's current data: a 3.79% risk-free rate, 4.72% equity risk premium, and Salesforce's company-specific beta of 1.307. This beta reflects CRM's actual stock price sensitivity to market movements, capturing the higher volatility typical of growth-oriented enterprise software companies.
Cost of Debt (2.97% after-tax): Salesforce's pre-tax borrowing cost of 3.79% adjusted for its 21.7% effective tax rate. Despite carrying $17.2 billion in debt, the company's strong cash generation keeps borrowing costs low.
Capital Structure: FMP provides market-value-based weights: 91.6% equity and 8.4% debt. This reflects Salesforce's predominantly equity-funded structure, typical of high-growth technology companies.
Final WACC: 9.37%. The weighted blend of cost of equity and after-tax cost of debt, reflecting both Salesforce's growth-company risk profile and its modest use of leverage.
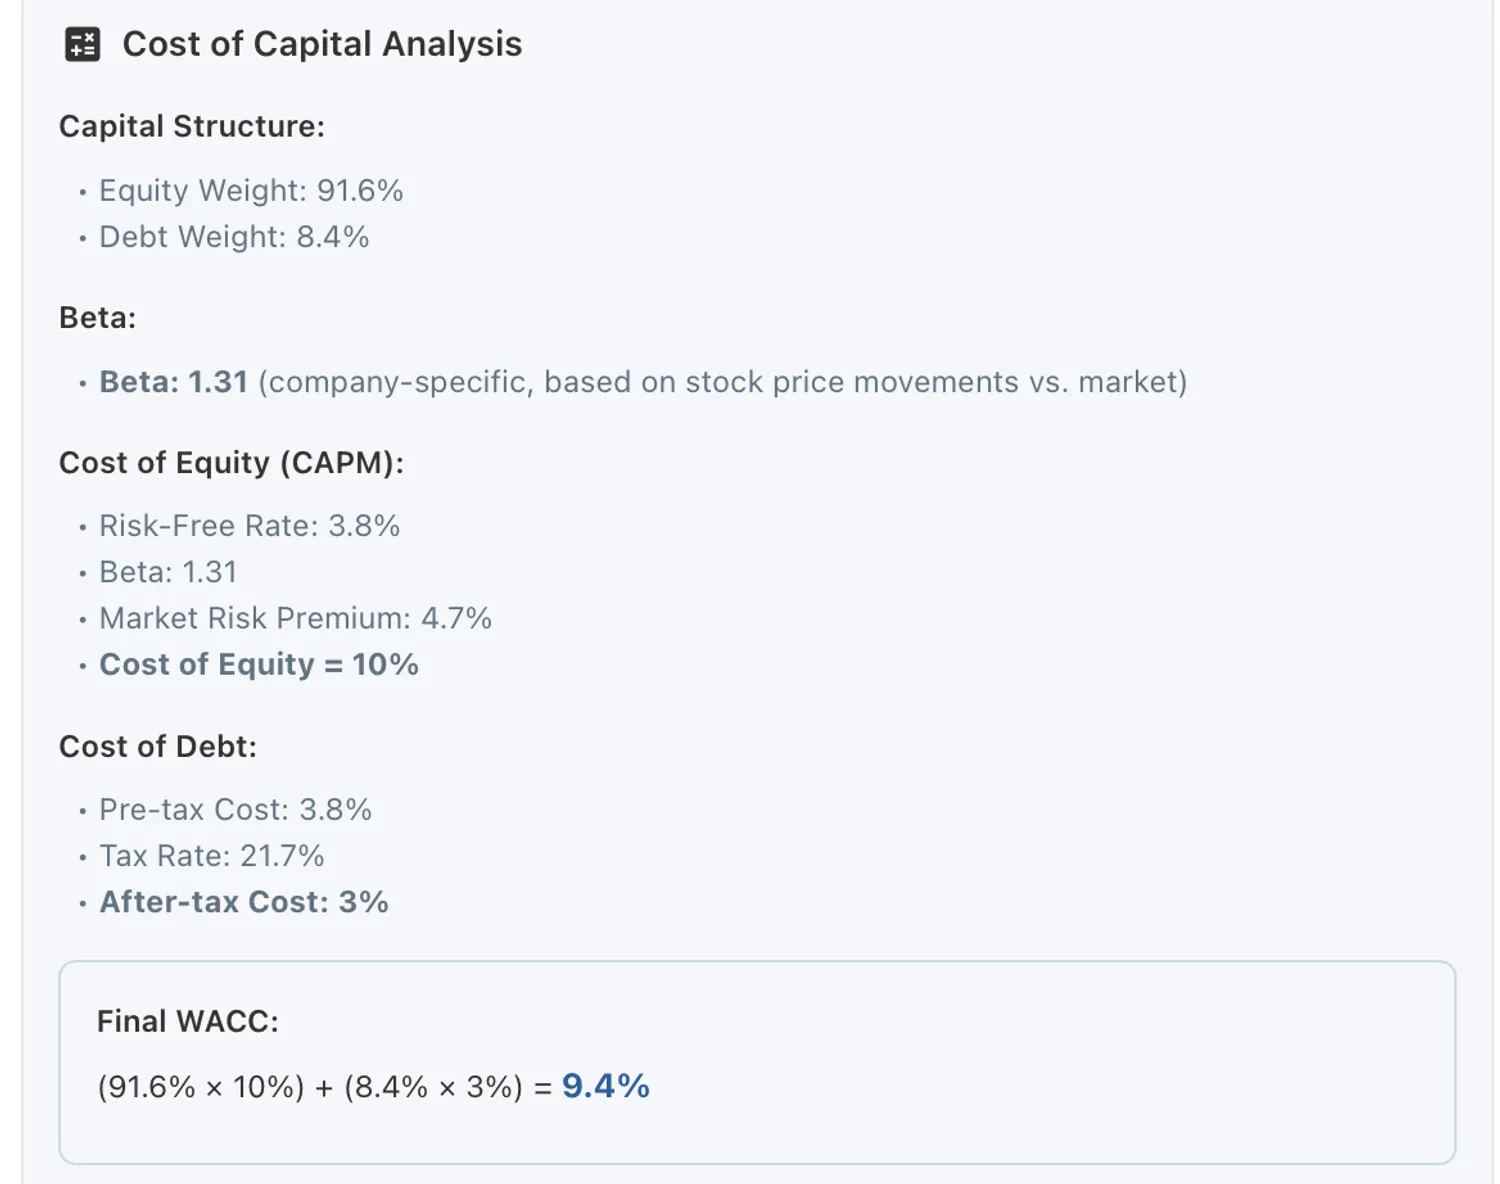
Figure 2. WACC calculation: 9.37% discount rate built from FMP company-specific data: beta of 1.307, current risk-free rate, equity risk premium, and market-value capital structure weights.
Operational Assumptions
The model uses a 49.3% EBITDA margin, sourced from analyst consensus projections for Salesforce's forward profitability. This is significantly above the current fiscal 2026 margin of 31.7%, but it reflects analysts' collective expectation that Salesforce's margin expansion trajectory still has substantial room to run.
The historical trend supports this view. EBITDA margins have expanded from 14.5% (FY2022) to 18.0% (FY2023) to 26.5% (FY2024) to 29.4% (FY2025) to 31.7% (FY2026), more than doubling in four years through disciplined cost management, workforce optimization, and operating leverage on subscription revenue. Analysts expect this trajectory to continue.
Whether this expansion materializes is a critical assumption. If margins plateau near current levels rather than reaching 49%, intrinsic value would be materially lower. The margin sensitivity table below quantifies this risk.
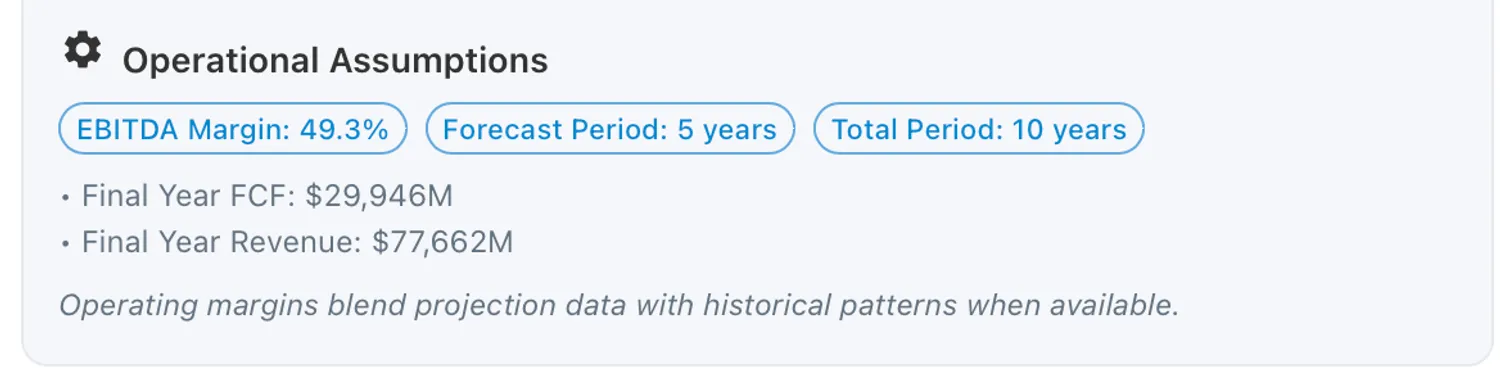
Figure 3. Operational assumptions: 49.3% EBITDA margin from analyst consensus projections, with 5-year forecast period tapering to 10-year total projection.
Cash Flow Projections
The projections illustrate Salesforce's expected financial trajectory over the 10-year analysis period.
During Phase 1 (Years 1-5), revenue grows at the analyst-consensus 10.0% rate, expanding from $45.7 billion to $66.9 billion. The high EBITDA margin translates revenue growth efficiently into free cash flow, which grows from $17.3 billion in Year 1 to $25.3 billion by Year 5.
During Phase 2 (Years 6-10), growth tapers exponentially: 5.2% in Year 6, declining smoothly to 2.1% by Year 10. Revenue reaches $77.7 billion by the final projection year, with free cash flow of $30.0 billion. The smooth decay creates realistic transitions, avoiding the artificial cliff effects common in simplified DCF models.
The present value calculations show the compounding effect of the 9.37% discount rate. Earlier years contribute $15.8-16.2 billion each in present value, while later years contribute $12.2-15.7 billion as the discount factor accumulates.
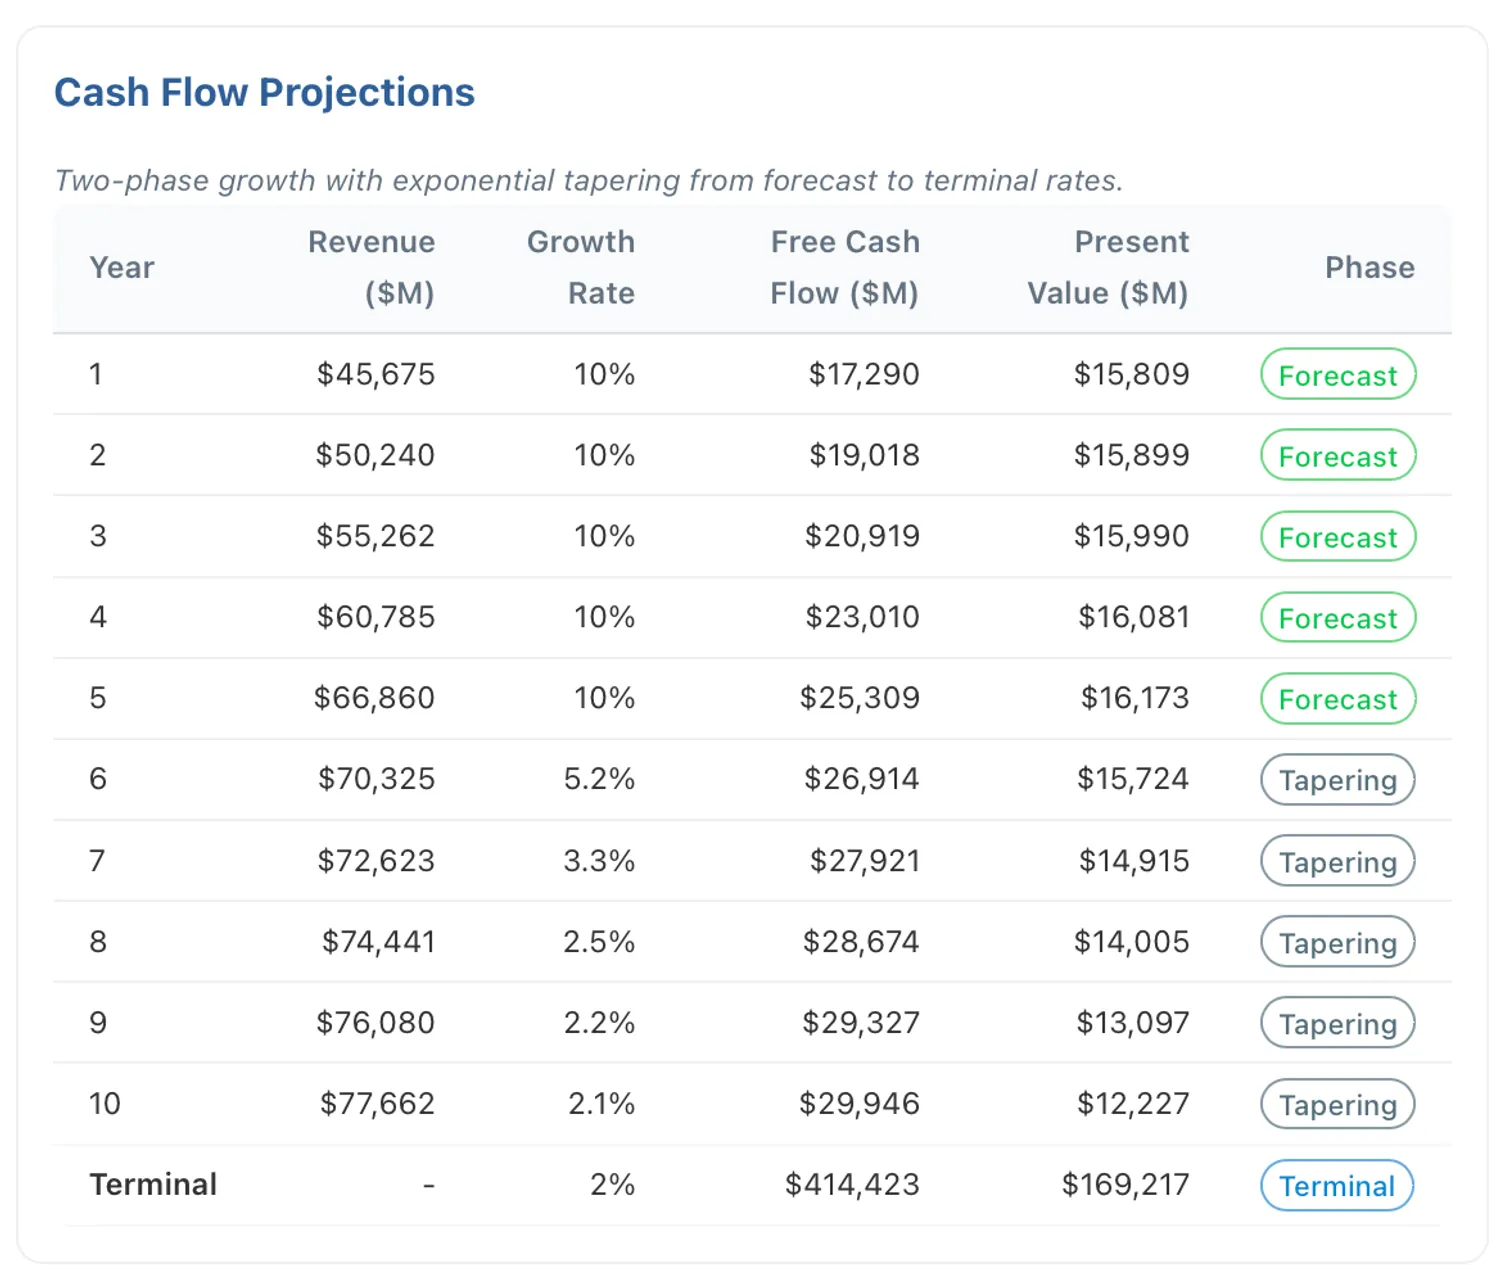
Figure 4. 10-year cash flow projections: Phase 1 at 10.0% growth (Years 1-5), Phase 2 exponentially tapering to 2.0% terminal rate (Years 6-10), generating $17-30 billion in annual free cash flow.
DCF Valuation Summary
The DCF analysis yields a total enterprise value of $319.1 billion. The present value of explicit forecast period cash flows contributes $149.9 billion (47.0%), while the discounted terminal value adds $169.2 billion (53.0%). This roughly even split between forecast and terminal value is notable. Many growth companies derive 70%+ of enterprise value from terminal assumptions, making their valuations highly sensitive to long-term projections. Salesforce's strong near-term cash generation provides a more balanced, defensible valuation foundation.
Subtracting $9.8 billion in net debt (total debt of $17.2 billion minus cash) produces an equity value of $309.3 billion. Dividing by 956 million diluted shares yields an intrinsic value of $323.52 per share.
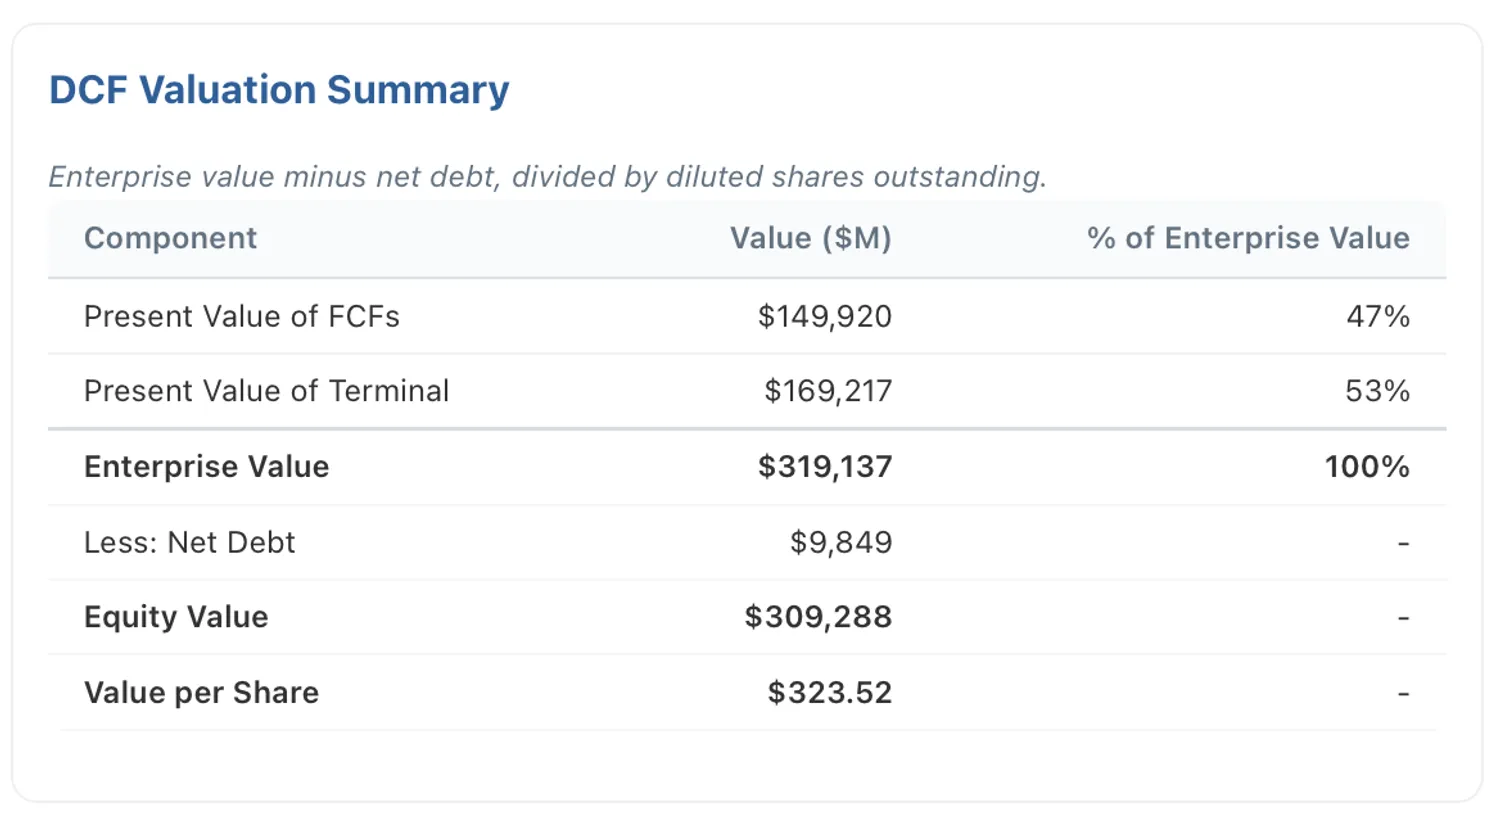
Figure 5. Valuation bridge: $149.9 billion from 10-year forecasts (47.0%) plus $169.2 billion terminal value (53.0%) equals $319.1 billion enterprise value. Subtract $9.8 billion net debt, divide by 956 million shares = $323.52 intrinsic value per share.
What the DCF Model Estimates: 66% Upside at $323
With Salesforce trading at $195.31, the DCF analysis indicates an intrinsic value of $323.52 per share, representing 66% upside. This is a significant gap that suggests our DCF model estimates Salesforce priced well below its intrinsic-value estimate on a cash flow basis.
The result is grounded in verifiable data: 10.0% growth from analyst consensus across 18-42 analysts, 49.3% EBITDA margin from analyst consensus projections, 9.37% WACC from FMP market data, and 2.0% terminal growth.
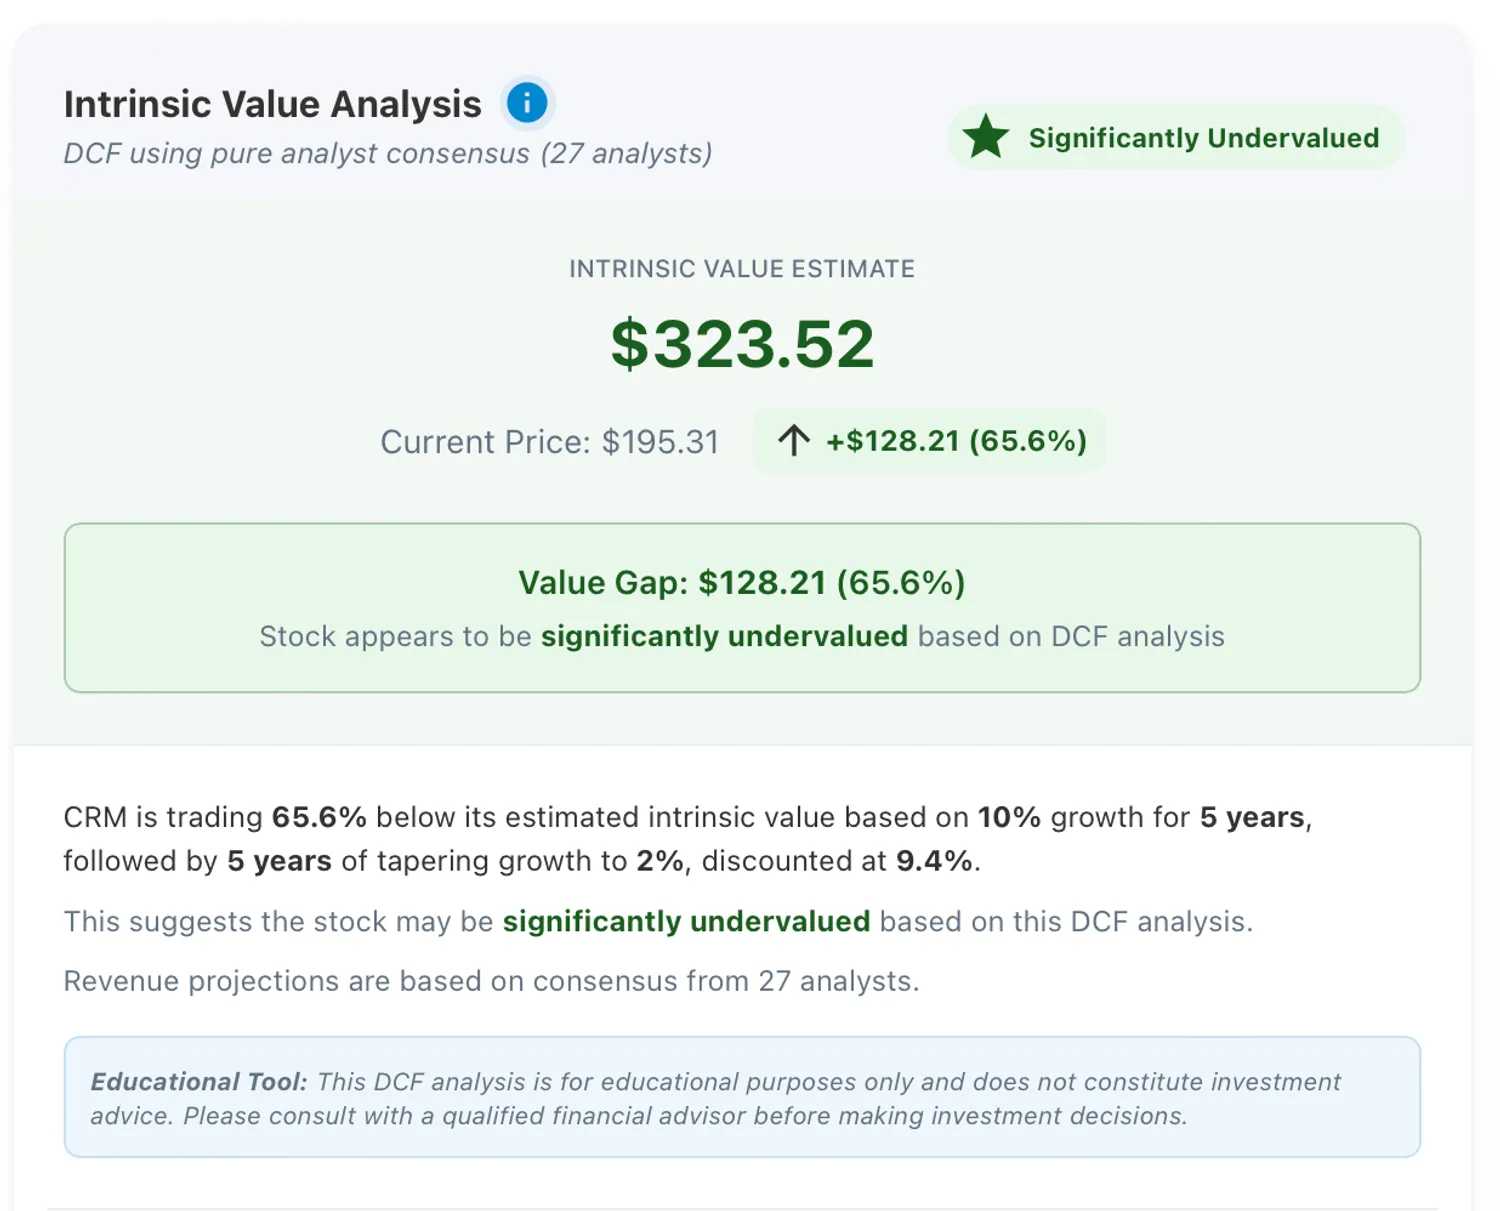
Figure 6. Intrinsic value of $323.52 versus current price of $195.31 implies 66% upside, based on analyst consensus growth and FMP market-derived discount rates.
Stress Testing the Fair Value Conclusion
A 66% upside signal demands rigorous sensitivity testing. How robust is this conclusion under different assumptions?
Sensitivity to Discount Rate (WACC): Holding growth constant at 10.0% and varying WACC:
Table 1. WACC sensitivity: Even at an aggressive 11% discount rate, the model still suggests meaningful upside.
| WACC | Intrinsic Value | Upside vs $195 |
|---|---|---|
| 7.5% | $444 | 127% |
| 9.37% (Base Case) | $323 | 66% |
| 11.0% | $260 | 33% |
| 12.5% | $218 | 12% |
Sensitivity to Growth Rate: Varying growth while holding WACC constant at 9.37%:
Table 2. Growth sensitivity: Even conservative 7% growth assumptions suggest 40%+ upside.
| Growth Rate | Intrinsic Value | Upside vs $195 |
|---|---|---|
| 5% | 256 | 31% |
| 7% | $281 | 44% |
| 10% (Base Case) | $323 | 66% |
| 13% | $388 | 99% |
Table 3: EBITDA margin sensitivity: holding growth and WACC constant at base case values.
| EBITDA Margin | Intrinsic Value | Upside vs $195 |
|---|---|---|
| 32% (current) | $205 | 5% |
| 38% | $246 | 26% |
| 44% | $287 | 47% |
| 49.3% (analyst consensus) | $323 | 66% |
At 32% margins (today's level), the model still shows modest upside, but the case strengthens considerably as margins expand. Even EBITDA margin reaching 38% would imply 26% upside, suggesting the stock offers value even if analysts' most optimistic margin projections only partially materialize.
The sensitivity analysis reveals that our DCF model estimates Salesforce priced below its intrinsic-value estimate across a wide range of reasonable assumptions. Even the bear case (12.5% WACC, well above what market data suggests) still produces an intrinsic value near the current price. Under most scenarios, meaningful upside persists.
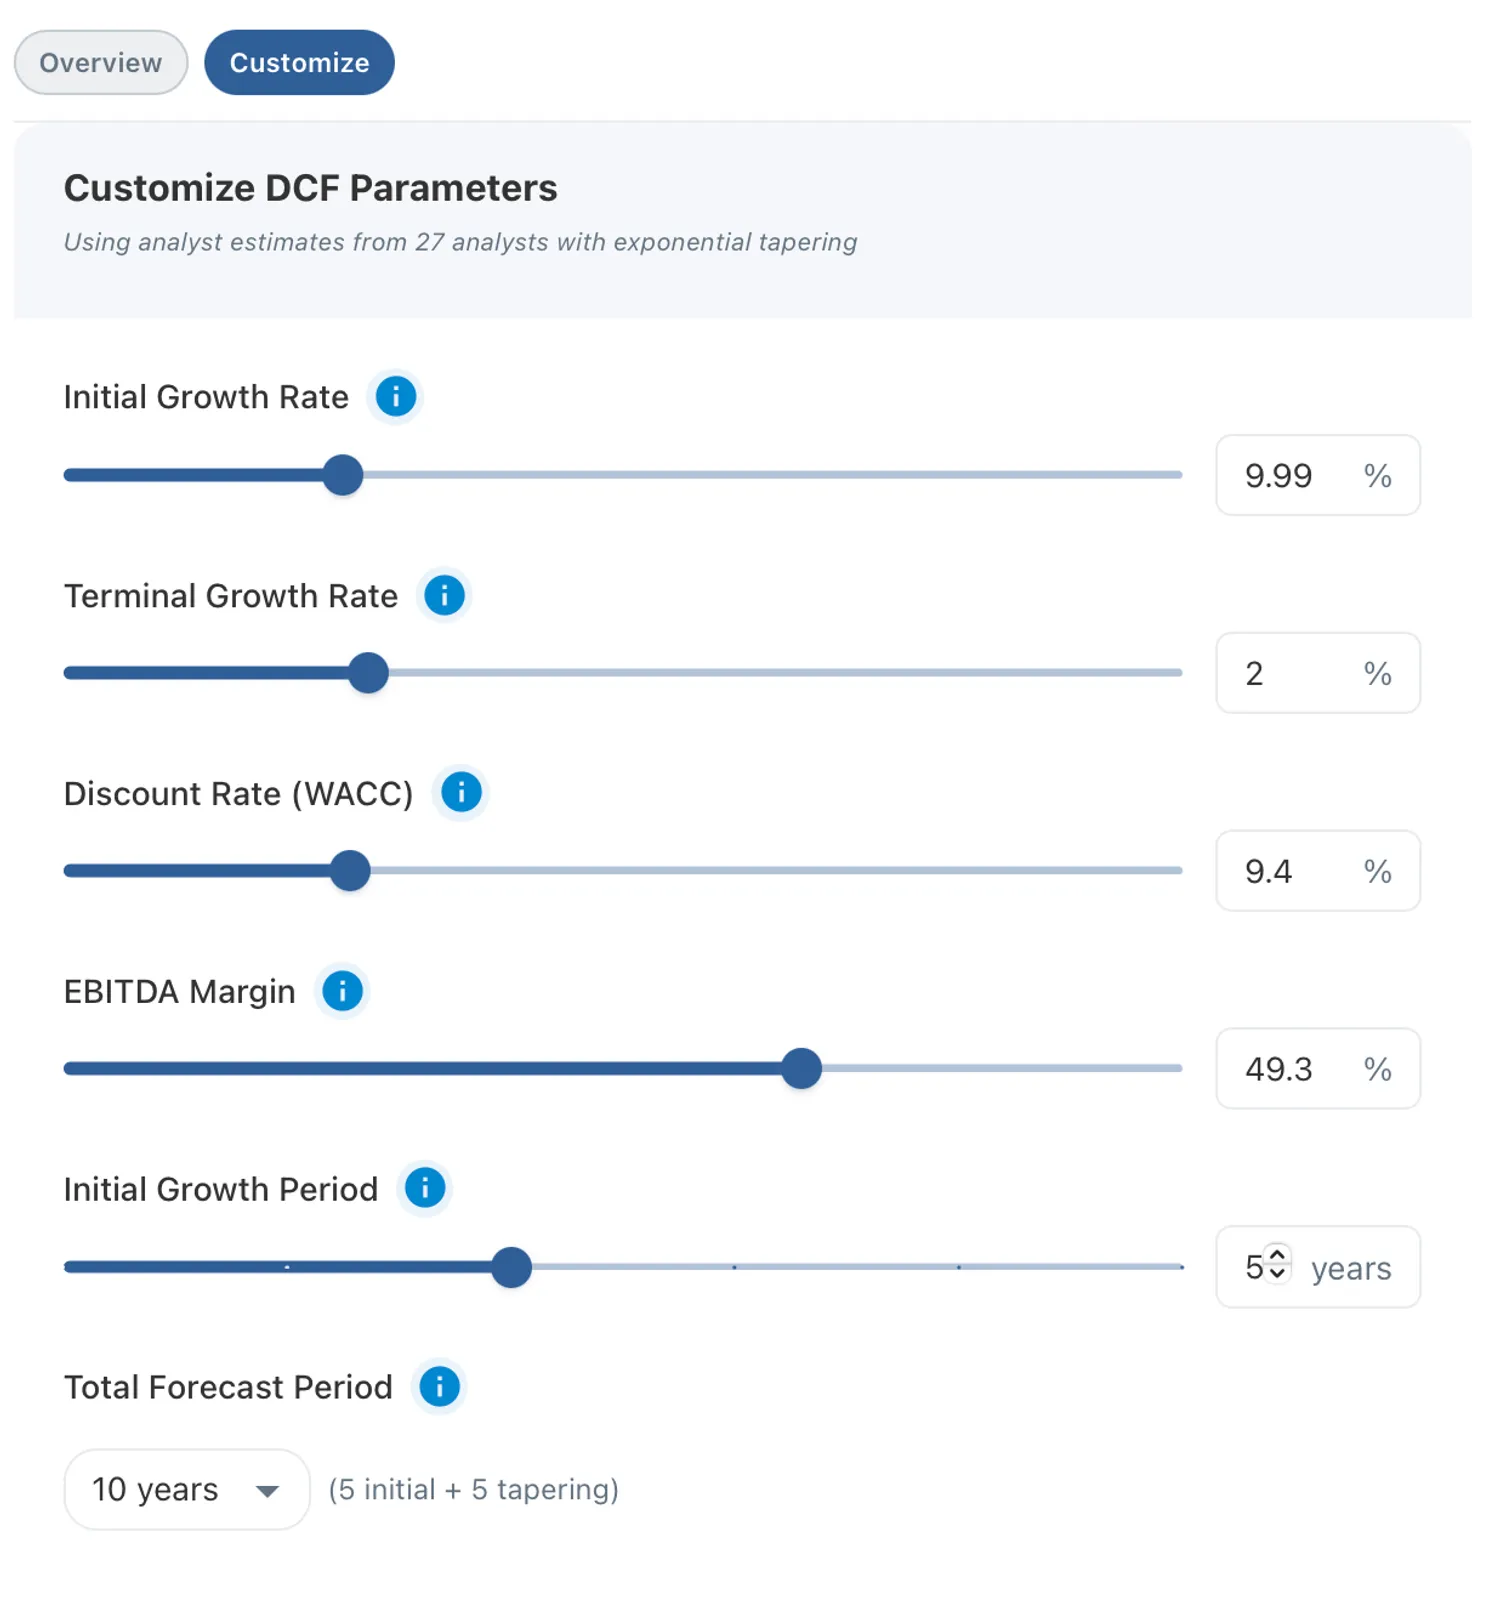
Figure 7. Interactive controls on our platform let you adjust growth, discount rates, and forecast periods to test different scenarios and build conviction in the valuation conclusion.
The Multiples Perspective
While DCF provides the intrinsic value anchor, valuation multiples reveal how the market prices Salesforce relative to its fundamentals and peers. Our framework analyzes 10 key metrics across price-based and enterprise value approaches, comparing each against 80 technology sector peers, the company's own 10-year history, and forward analyst estimates.
The composite picture is striking. The median peer-implied fair value across all 10 multiples is $261.29, representing 34% upside from the current price. When blended 50/50 with the DCF intrinsic value of $323.52, the overall fair value estimate is $292.41, suggesting 50% upside.
The alignment between DCF and multiples is significant. Both independent approaches estimate Salesforce priced below its intrinsic-value estimate, reducing the probability that either method is producing a spurious result.
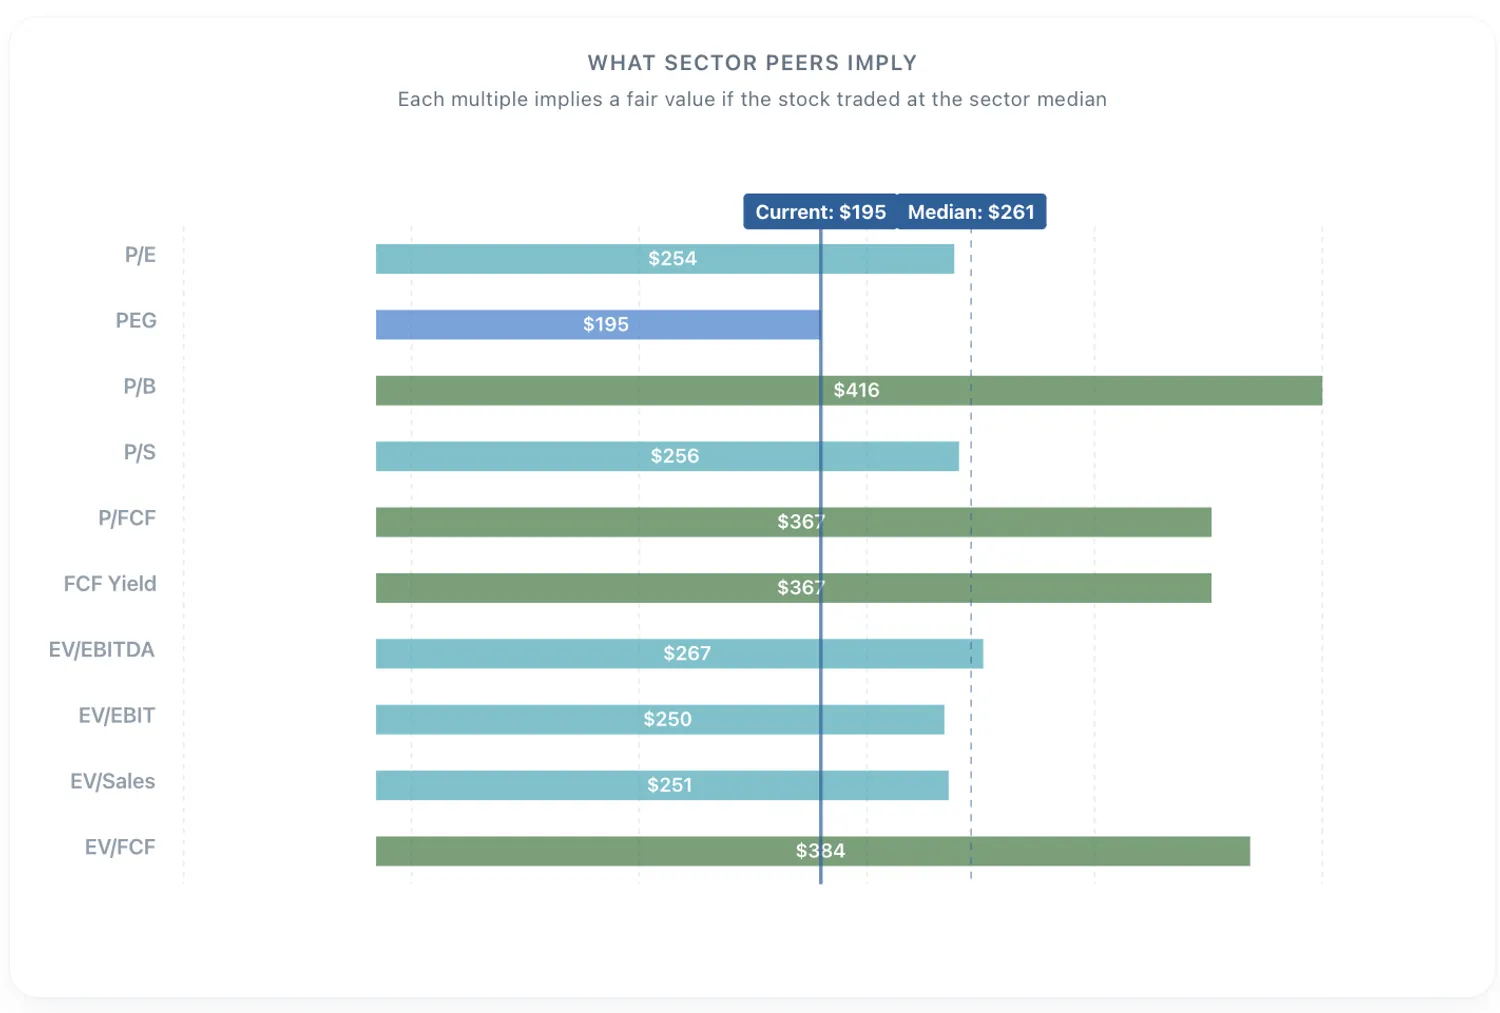
Figure 8. Valuation summary: peer-implied fair values from all 10 multiples, with current price reference line and median implied price, showing the model's broad-based intrinsic-value estimates sitting above price relative to technology sector peers.
Analytical Conclusions
The analysis produces a clear quantitative signal: our models estimate Salesforce priced below its intrinsic-value estimate on both a fundamental cash flow basis (66% DCF upside) and a relative multiples basis (34% composite upside). The alignment between independent valuation approaches strengthens the signal.
The 49.3% EBITDA margin is the key assumption to interrogate. Analyst consensus projects margins expanding from today's 31.7% to nearly 50%, driven by operating leverage and AI-driven efficiencies. As the margin sensitivity analysis shows, the stock offers modest upside even at current margins (5% at 32%), but the case strengthens considerably if the expansion thesis plays out, even partial margin expansion to 38% implies 26% upside. The investment question is not whether the models estimate Salesforce priced below intrinsic value (they do on most measures), but how much of the projected margin expansion you believe will materialize.
The market appears to be pricing significant skepticism into that margin trajectory. At roughly 13x free cash flow, Salesforce trades at a level more consistent with slow-growth industrials than a dominant software platform growing at 10% with rapidly expanding profitability. Either the market is right that margins will plateau, or sentiment has overcorrected.
This is exactly the kind of tension that valuation analysis is designed to surface. Not to provide definitive answers, but to quantify the gap between price and fundamentals, test the robustness of that gap under different assumptions, and frame the questions that investors must answer through competitive analysis and industry expertise.
Try the DCF valuation engine yourself on our Valuation Analysis page. Run your own scenarios and see what the numbers say.
DCF valuation based on trailing twelve month data, 10-year historical financials, and consensus analyst estimates as of March 2026. WACC inputs from FMP (Financial Modeling Prep) market data. Data sourced from 10-K filings via Financial Modeling Prep API.
This analysis is for educational purposes only and does not constitute investment advice. DCF results rely on assumptions that may not materialize. Consult qualified financial advisors before making investment decisions.