
17 Ready-Made Stock Screens: From Graham's Deep Value to Dividend Growth
Skip the filter setup. Our preset screens encode ready-made strategies from Greenblatt, Lynch, Graham, and Buffett - plus proprietary screens that leverage all five dimensions of our analysis framework.
Stock screeners are powerful, but they share a common friction point: you need to know which filters to set, what thresholds matter, and how multiple criteria interact before you see your first result.
Our visual stock screener already solved the exploration side of this problem with force-simulated bubble charts and 40+ financial metrics. But we kept hearing the same question: "What screens should I actually run?"
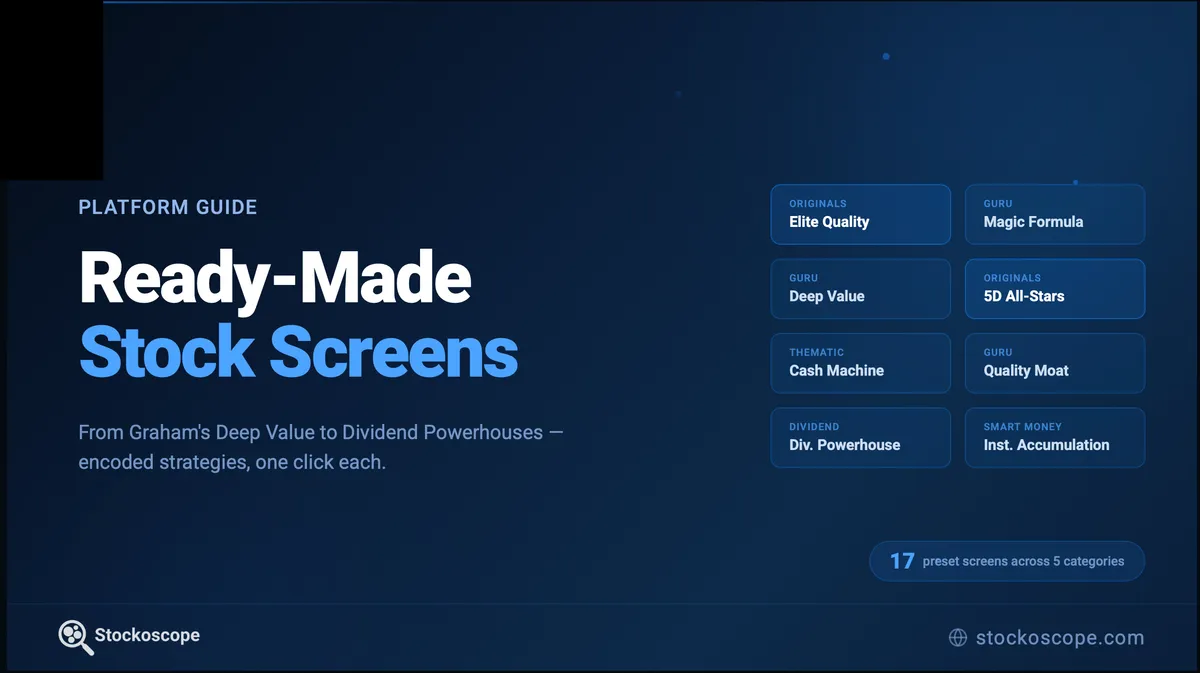
So we built 17 preset screens that encode time-tested investment strategies. Each one is a complete, ready-to-run strategy. Select it, and qualifying stocks appear instantly, sorted by the metric that matters most for that approach.
Five Categories, One Click Each
The preset screens are organized into five categories, each serving a different investment philosophy.
Stockoscope Originals
These four screens leverage our proprietary scoring system, which evaluates companies across ten fundamental pillars and five analytical dimensions that no single traditional metric can capture.
High Quality Score surfaces companies scoring 3.75/5 or higher on our Business Quality assessment. The score synthesizes 10 fundamental pillars: returns (ROE/ROIC), margins, cash flow quality, top-line growth, operational efficiency, leverage and coverage, per-share fundamentals, liquidity, valuation multiples, and dividend metrics. A single number, but nothing important is hidden from it.
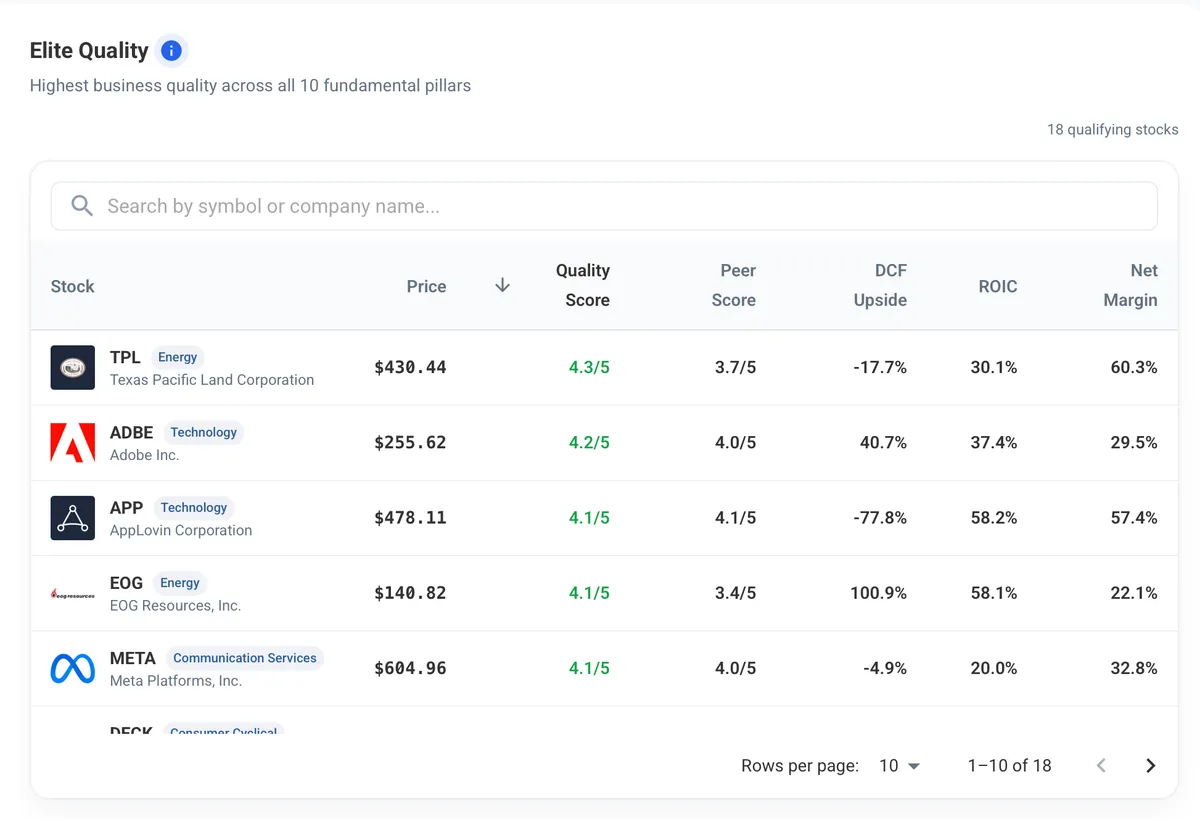
Figure 1: High Quality Score. Companies scoring 3.75/5 or higher on the Business Quality assessment, sorted by quality score. The pillar columns show where the strength is coming from.
Highest Peer Score by Sector answers a different question: who's the best within their peer group? It takes the single highest-ranked company in each sector by our Peer Ranking Score, which measures fundamental quality relative to sector peers rather than on an absolute scale. A software company and a utility company face very different margin and growth norms, so absolute thresholds miss the point. Peer ranking accounts for that. The result is the single highest-ranked stock per sector, sorted by how far ahead of their peers they are. The index filter changes the answer meaningfully: run it on the full universe to find the best across all listed stocks, or restrict to the S&P 500 to see who leads each sector among large caps only.
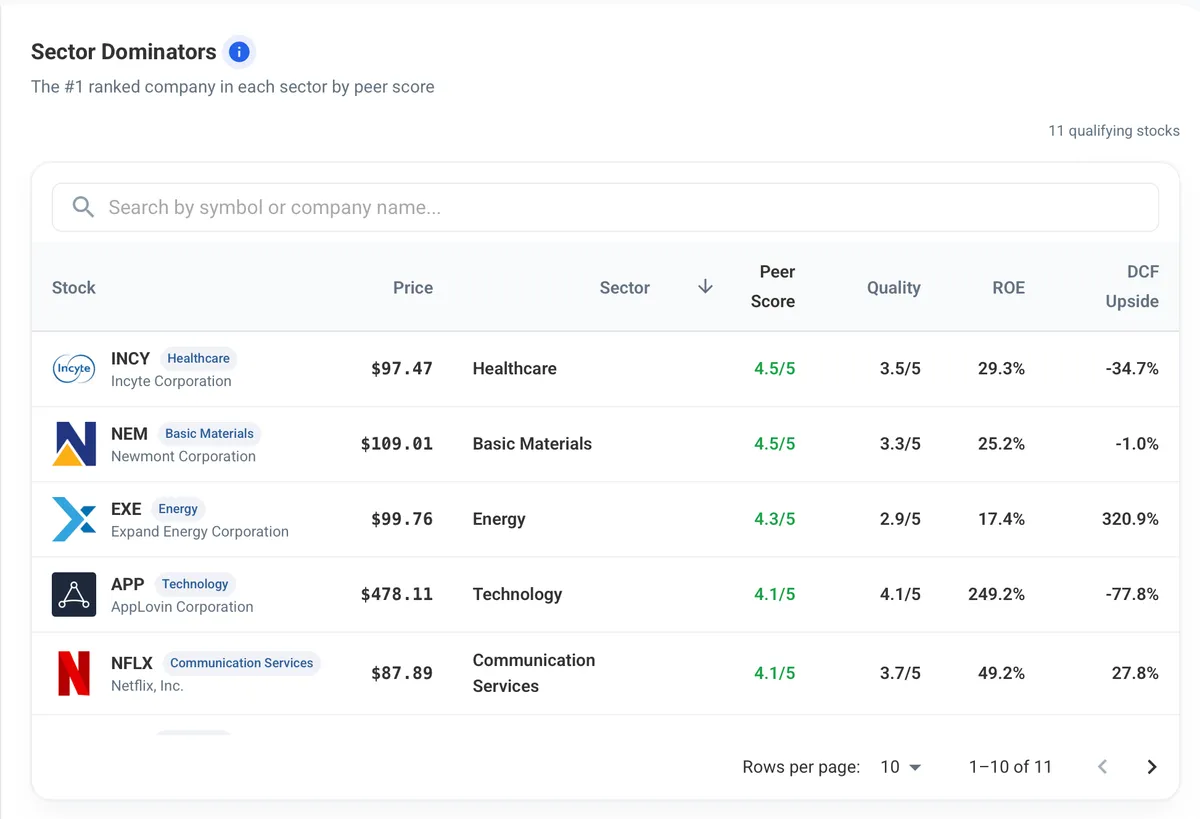
Figure 2: Highest Peer Score by Sector. The single highest-ranked company in each sector by Peer Ranking Score, showing how far ahead each leader is from its sector peers.
High Across All 5 Dimensions is the most selective screen we offer. It requires a score of 3.5/5 or higher across all five dimensions of our framework: Business Quality, Peer Ranking, DCF Valuation, Analyst Sentiment, and Holdings Sentiment. These are stocks with no dimension scoring below the threshold. They show quality, value, analyst conviction, and smart-money flows all scoring above the threshold together.
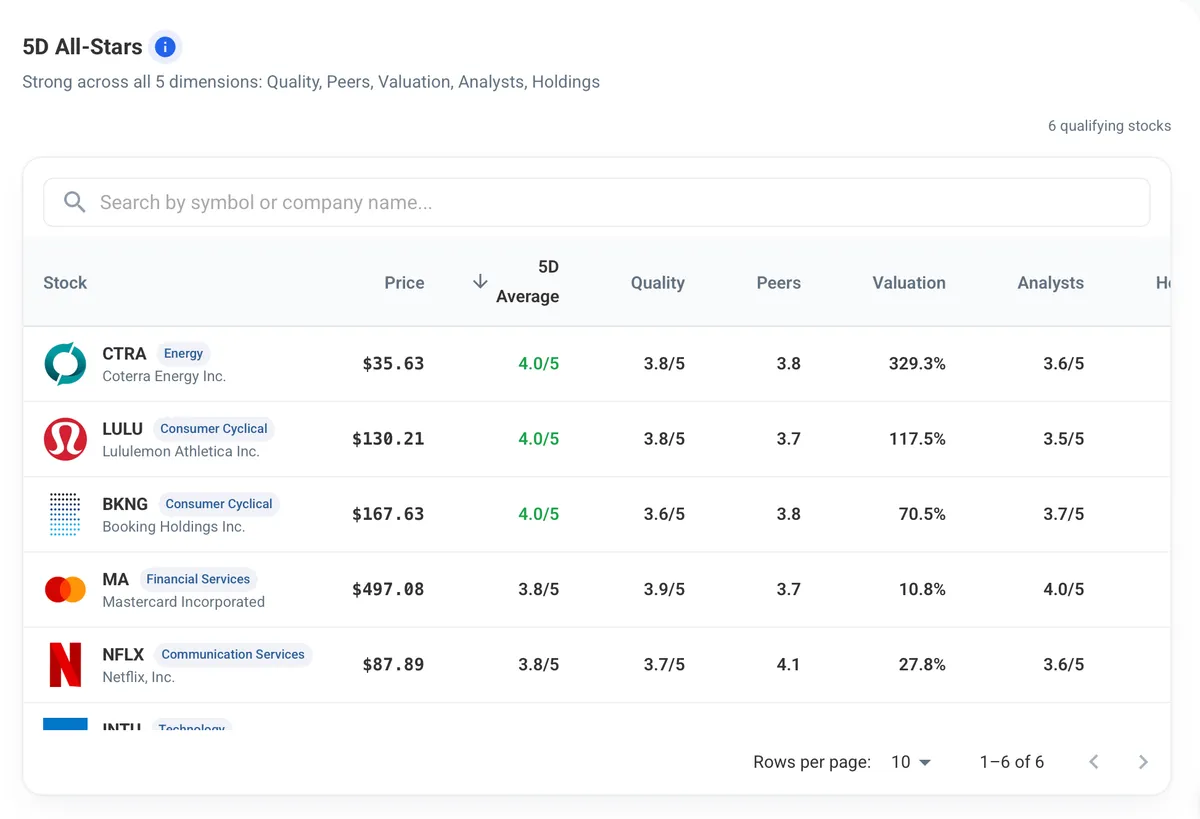
Figure 3: High Across All 5 Dimensions. Stocks scoring 3.5/5 or higher on every dimension, sorted by their 5D average. Columns show all five dimension scores so you can see the consistency at a glance.
High Quality + High DCF Upside combines a high quality score (3.75+) with significant DCF upside (20%+). High quality alone doesn't make a good investment if you overpay. This screen finds businesses where our model estimates the price is below its intrinsic-value estimate alongside a high fundamental score.
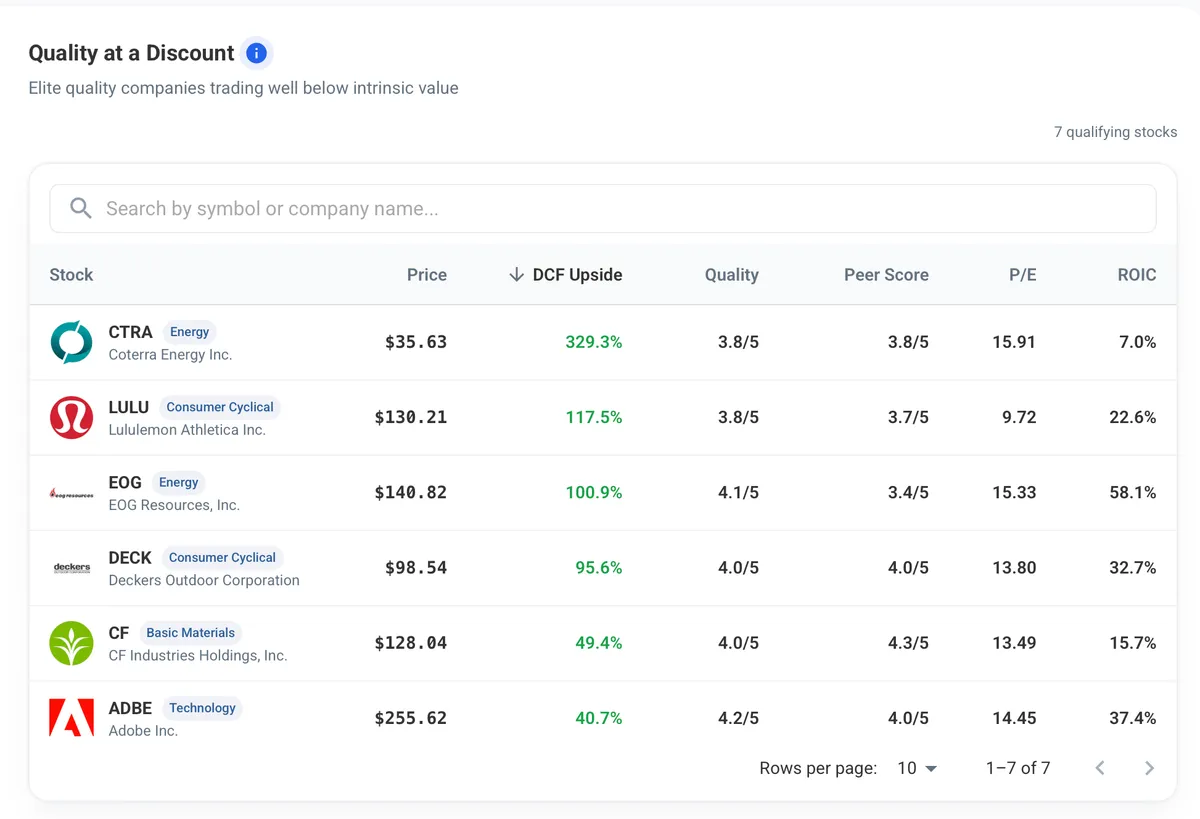
Figure 4: High Quality + High DCF Upside. High-quality businesses (3.75+) trading at 20%+ DCF upside, sorted by upside. The intersection of fundamental strength and valuation discount.
Analyst & Ownership
Four screens that tap into professional consensus and institutional behavior.
High Analyst Sentiment surfaces stocks scoring 3.75/5 or higher on our composite Analyst Sentiment Score, then ranks them by that score. The score combines consensus ratings, price target trends, earnings growth estimates, financial health assessments, and coverage depth. A high score reflects broad professional agreement across multiple dimensions, not just a "buy" rating from one or two analysts.
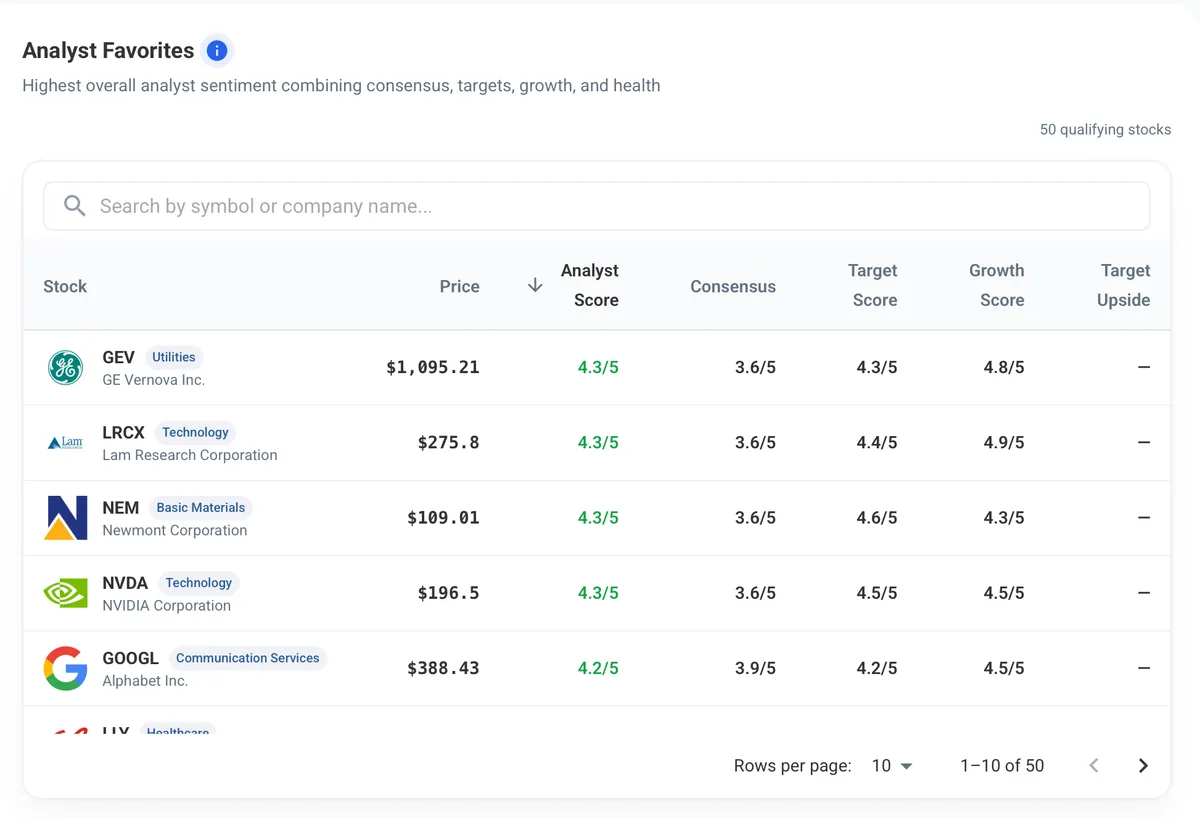
Figure 5: High Analyst Sentiment. Stocks where the composite Analyst Sentiment Score is 3.75 or higher, with sub-scores for consensus, price targets, growth, and financial health visible as columns.
High Holdings Sentiment surfaces stocks scoring 3.75/5 or higher on our composite Holdings Sentiment Score, which combines insider trading activity, institutional ownership changes, and ETF/mutual fund flows. A stock reaches this threshold when the weight of evidence across those three signals is net positive. It doesn't require every component to be strong, but it does require the overall picture to be favorable, which in practice means at least two of the three are clearly pointing in the right direction.
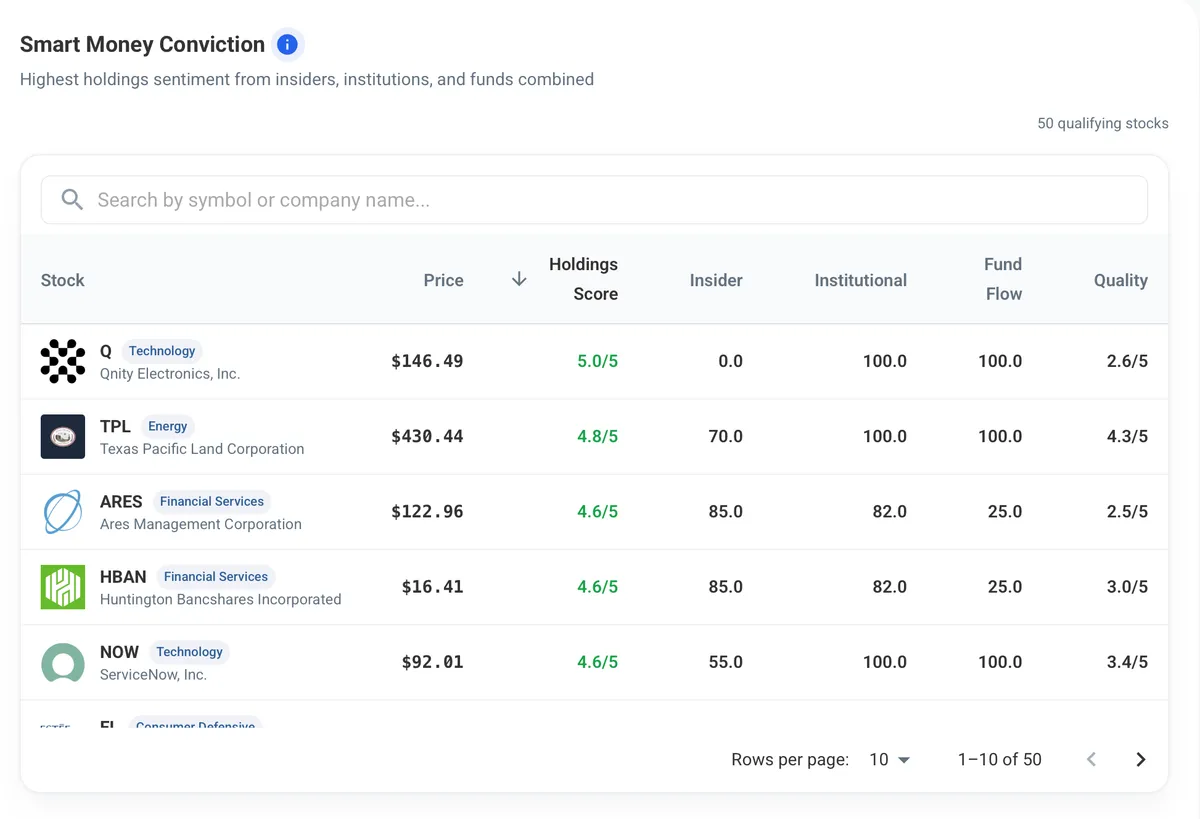
Figure 6: High Holdings Sentiment. Stocks scoring 3.75+ on the composite Holdings Sentiment Score. Insider, institutional, and fund flow component scores show which signals are doing the work.
High Analyst Price-Target Upside applies three filters that together separate genuine conviction from stale ratings: 60%+ buy/strong-buy consensus, 25%+ price target upside, and targets that are stable or rising (last quarter's average target at or above last year's). The rising-target filter is critical. It excludes stocks where analysts are simply chasing the price down, issuing progressively lower targets while maintaining "buy" ratings.
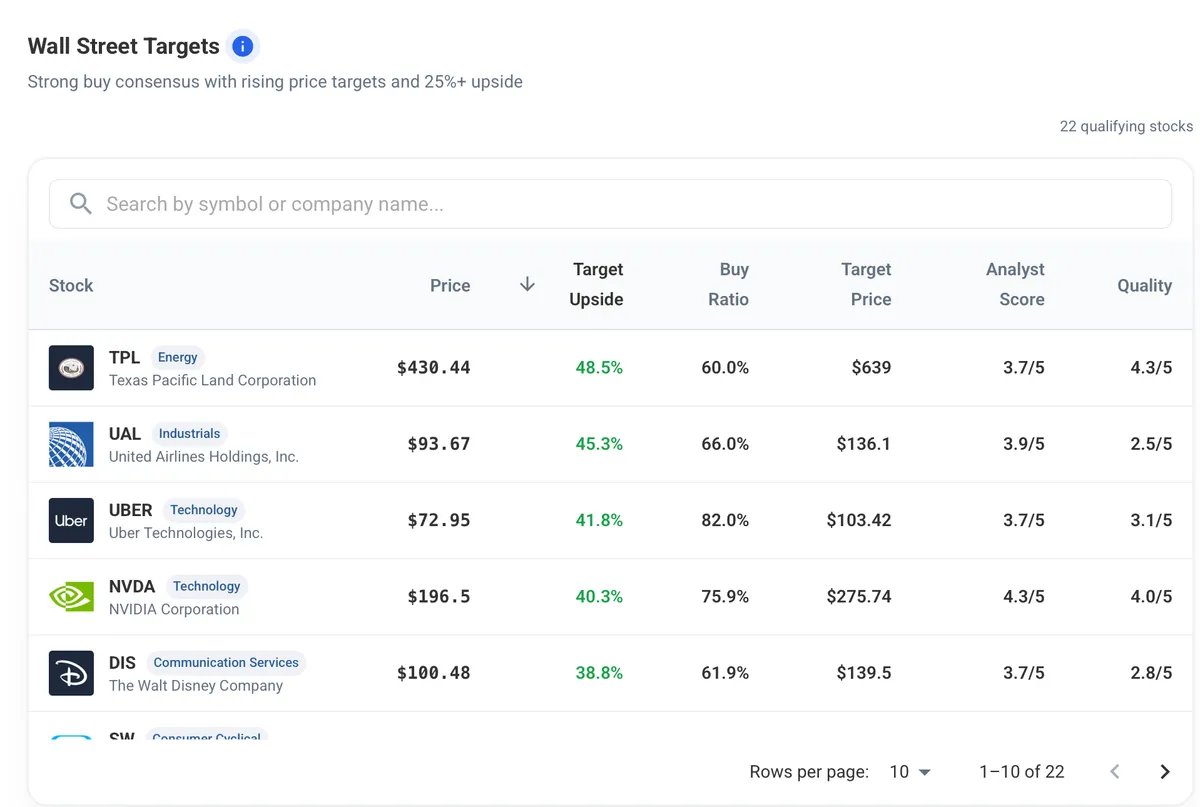
Figure 7: High Analyst Price-Target Upside. Stocks with 60%+ buy ratio, 25%+ price target upside, and stable-or-rising targets, sorted by upside. The buy ratio and target columns show the source of the conviction.
Rising Institutional & Fund Ownership identifies stocks where either institutional investors or ETF/mutual funds are scoring 60+ on our flow metrics (which run from -100 to +100). Large investors build positions over multiple quarters; catching the accumulation early is the whole point of tracking ownership changes.
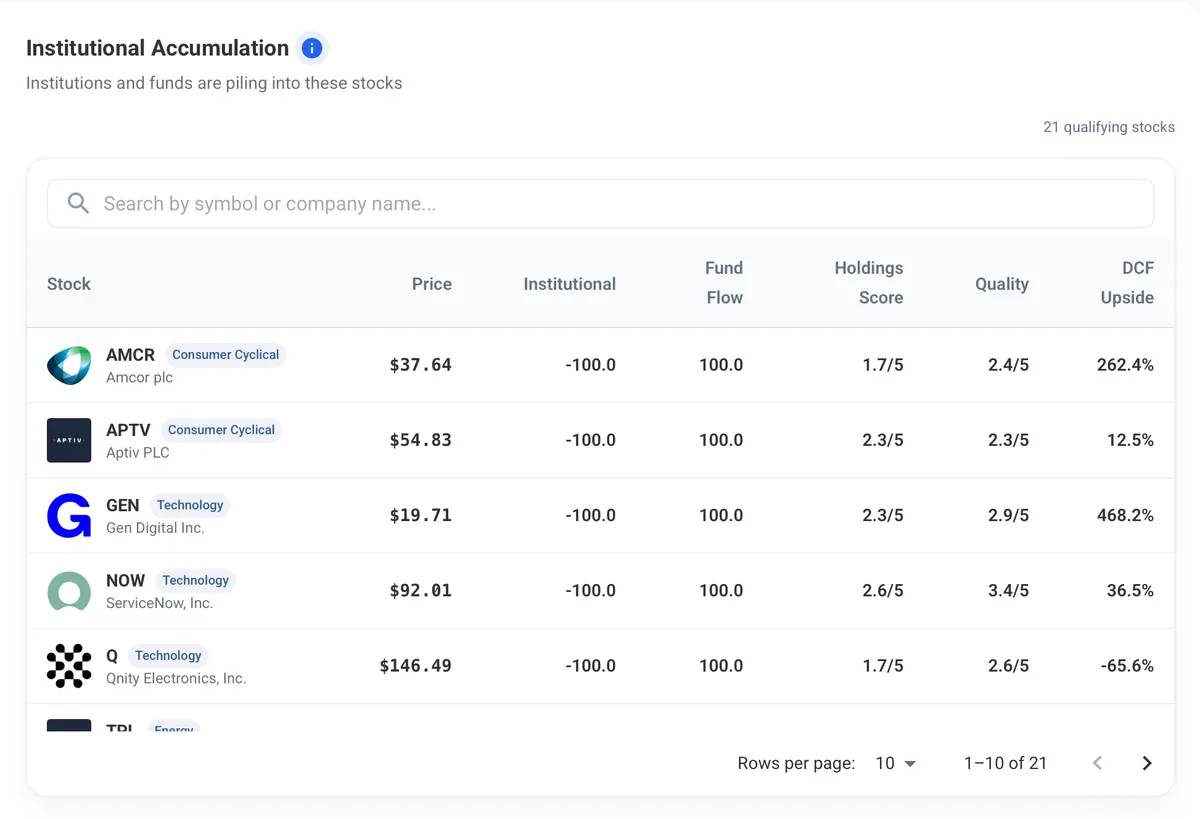
Figure 8: Rising Institutional & Fund Ownership. Stocks where institutional or fund flow scores exceed 60 on a -100 to +100 scale, showing where large investors are actively building positions.
Classic Investor Strategies
Four screens modeled on strategies from some of the most successful investors in history.
Magic Formula implements Joel Greenblatt's ranking system from The Little Book That Beats the Market. Every stock gets two ranks: one for return on capital employed (quality) and one for earnings yield via EV/EBITDA (cheapness). The combined rank surfaces cheap, high-quality businesses. Financial Services and Utilities are excluded, as their capital structures distort both metrics. Greenblatt recommends buying the top 20-30 and holding for a year.
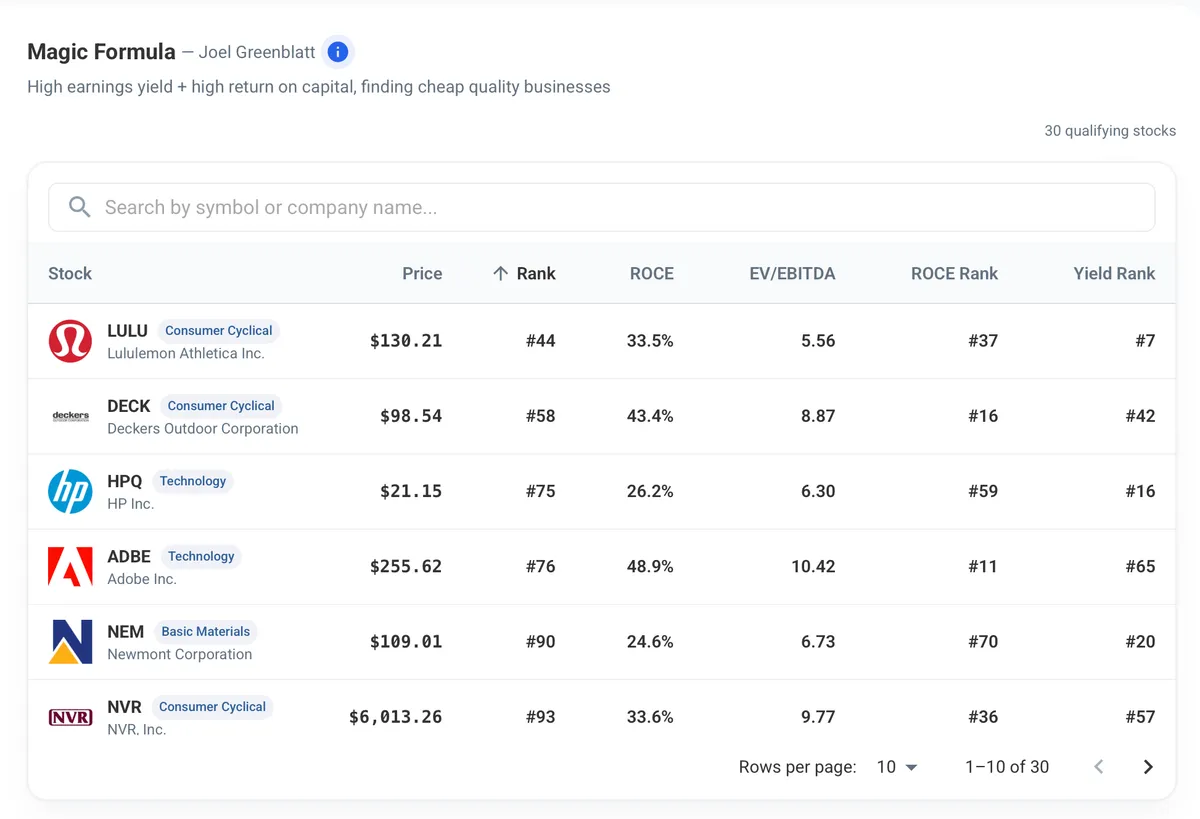
Figure 9: Magic Formula. Greenblatt's combined rank of return on capital employed and EV/EBITDA earnings yield, with Financial Services and Utilities excluded.
GARP Screen follows Peter Lynch's Growth at a Reasonable Price philosophy. It requires a PEG ratio between 0.1 and 1.5, EPS growth between 10-50%, and debt-to-equity below 0.5. The growth ceiling at 50% is intentional: Lynch warned that hyper-growth is rarely sustainable, and stocks priced for it face the steepest falls when growth inevitably decelerates. The PEG floor at 0.1 filters out data noise from implausibly low ratios.
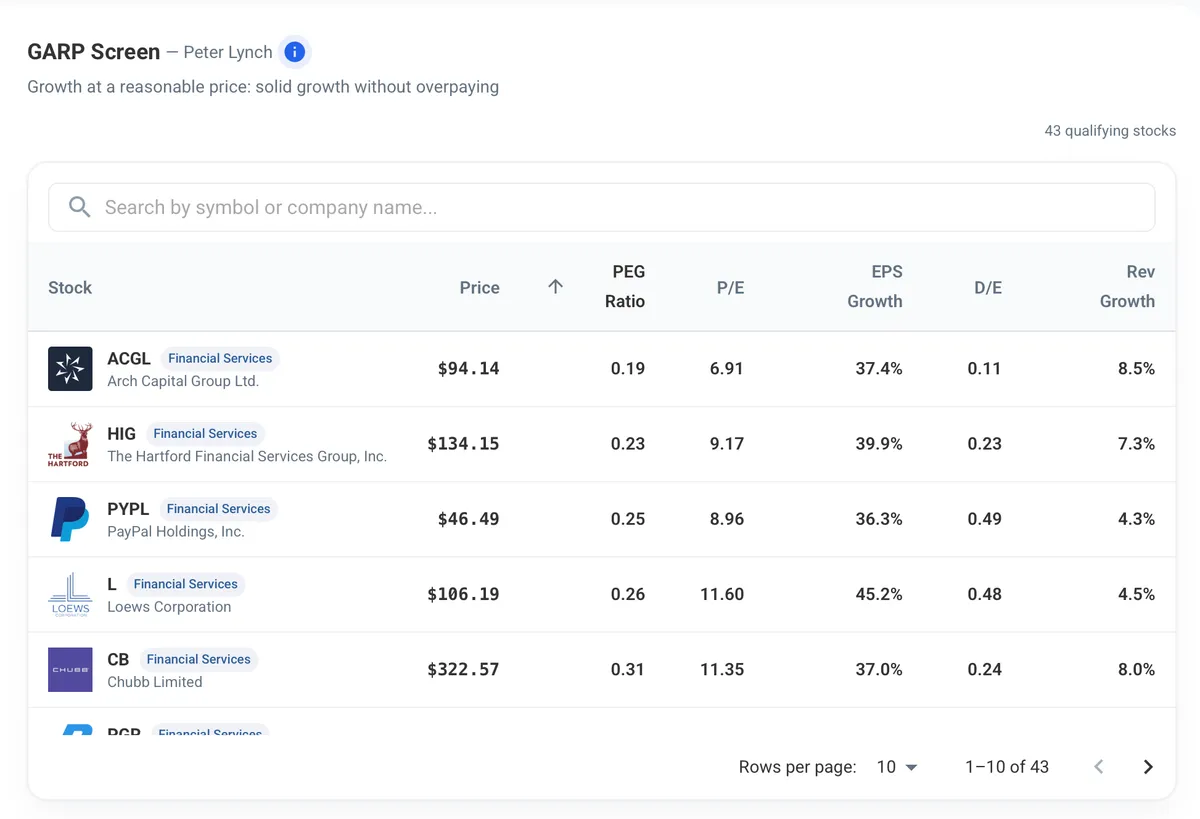
Figure 10: GARP Screen. Lynch's Growth at a Reasonable Price filter: PEG between 0.1 and 1.5, EPS growth 10-50%, debt-to-equity below 0.5.
Deep Value applies Benjamin Graham's classic criteria from The Intelligent Investor: P/E below 15, P/B below 2.0, their product below 22.5 (the Graham Number), and current ratio above 1.5 for financial safety. The P/E x P/B constraint is what makes this screen genuinely Grahamian rather than just "low P/E." A stock can be cheap on earnings but expensive on book value, or vice versa. Graham's product rule catches both.
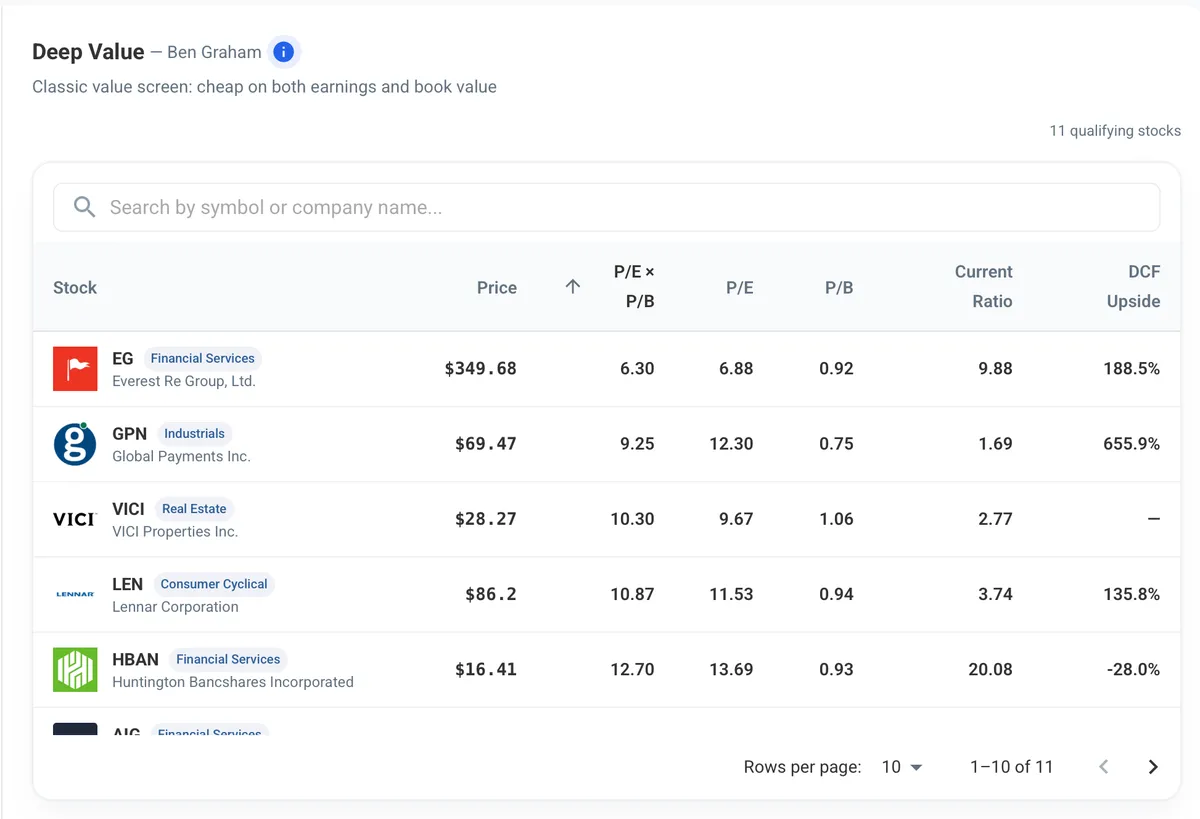
Figure 11: Deep Value. Graham's classic criteria with the Graham Number constraint (P/E × P/B below 22.5) and a current ratio of 1.5+ for financial safety.
Quality Moat captures Warren Buffett's focus on durable competitive advantages: ROE above 15%, net margin above 12%, ROIC above 12%, revenue growth above 5%, and debt-to-equity below 0.8. The ROIC threshold is the key differentiator. Return on invested capital measures how efficiently a business uses all capital, not just equity. A company can inflate ROE with leverage, but ROIC sees through that.
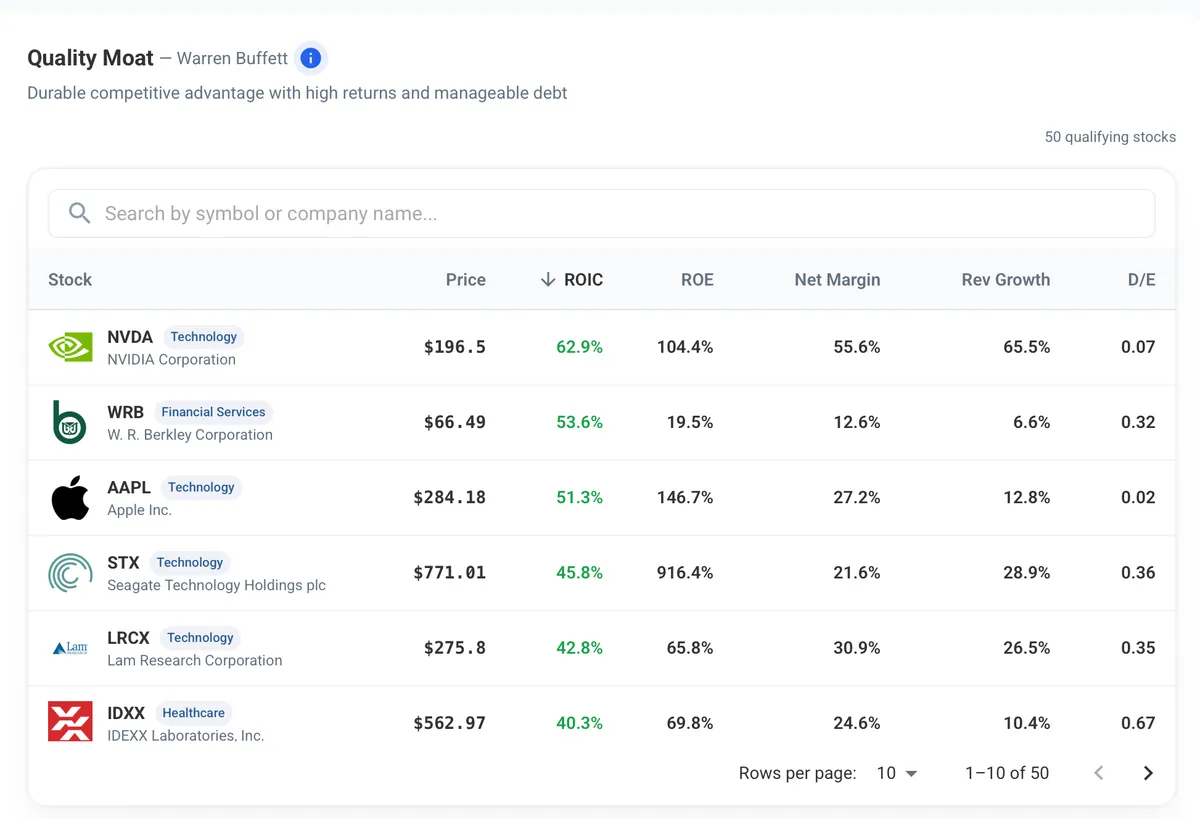
Figure 12: Quality Moat. Buffett-style filter requiring ROE 15%+, ROIC 12%+, net margin 12%+, revenue growth 5%+, and debt-to-equity below 0.8.
Thematic Screens
Three screens built around specific financial characteristics rather than investor philosophies.
High Free Cash Flow finds cash-generation powerhouses: FCF yield above 7%, income quality above 1.0 (meaning cash flow exceeds reported earnings), net margin above 8%, and debt-to-equity below 1.0. The income quality filter is what separates this from a simple high-yield screen. When a company generates more cash than it reports as profit, the earnings are real. The opposite, aggressive accounting that inflates reported earnings above actual cash generation, is a classic red flag.
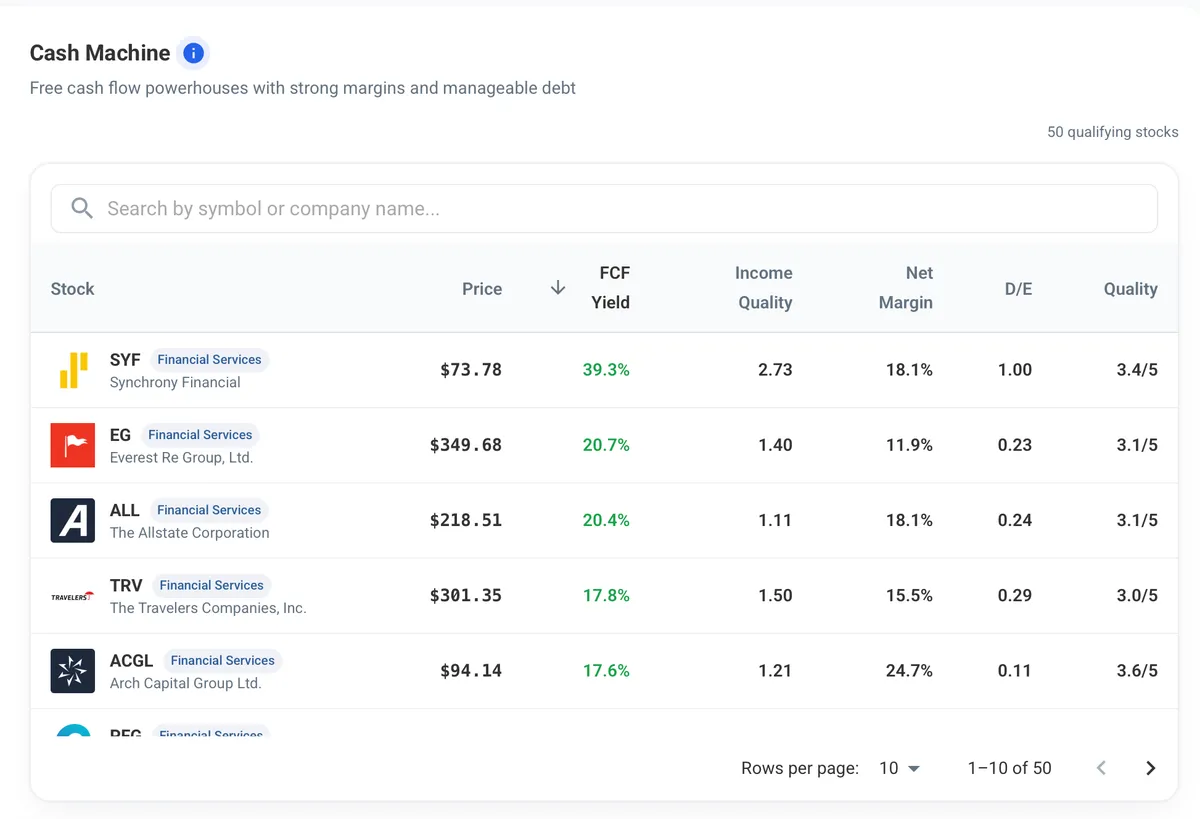
Figure 13: High Free Cash Flow. FCF yield above 7%, income quality above 1.0, net margin 8%+, debt-to-equity below 1.0. Income quality is the filter that separates real cash generators from accounting profits.
Low Debt & Strong Coverage identifies fortress balance sheets: net debt-to-EBITDA below 2.0 (could repay all debt in under two years), interest coverage above 5x, and current ratio above 1.5. These companies can weather economic downturns, rising rates, and credit crunches without breaking a sweat. The screen also requires non-negative net debt, excluding net-cash companies (those with more cash than debt). A net-cash company would trivially pass the leverage threshold without actually demonstrating debt discipline. The focus here is on companies that carry real debt loads and manage them conservatively.
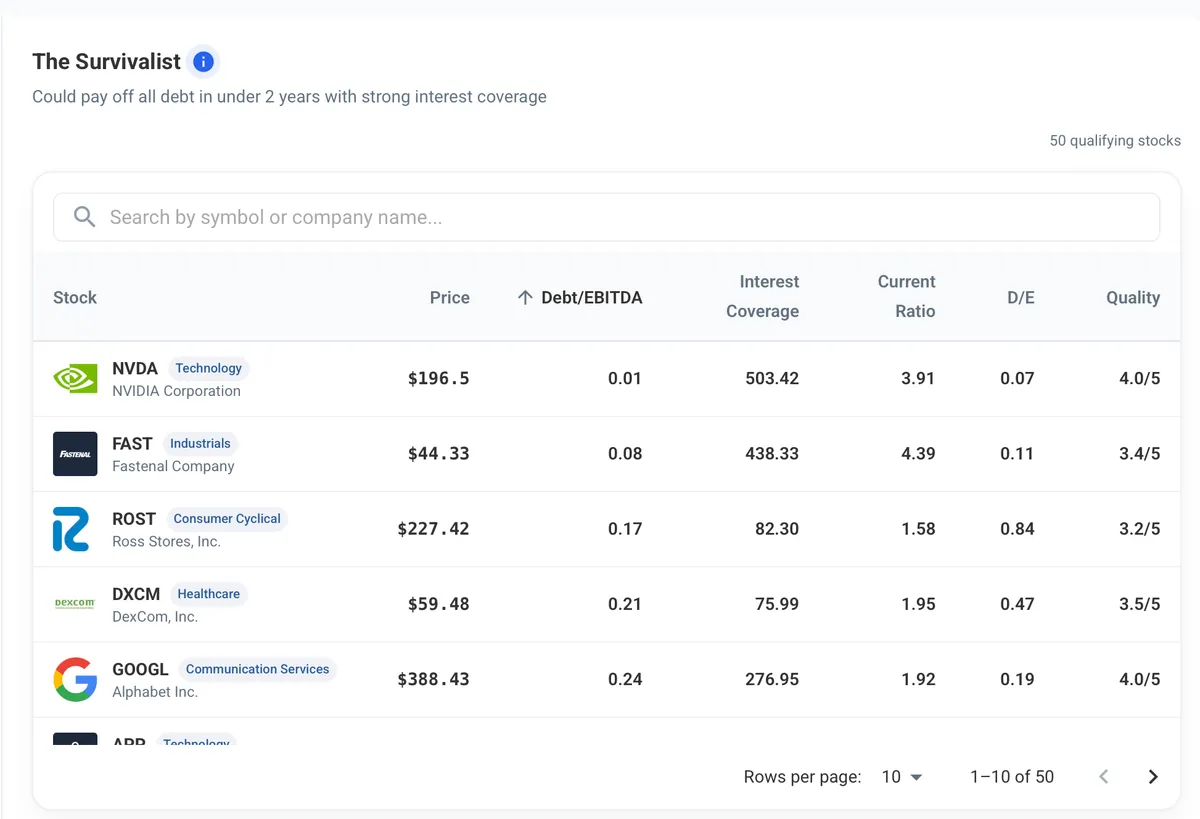
Figure 14: Low Debt & Strong Coverage. Fortress balance sheets: net debt-to-EBITDA below 2.0, interest coverage above 5x, current ratio above 1.5, and net debt above zero (excludes net-cash companies).
Share Buyback Signal (inspired by Charlie Munger's appreciation for buybacks) finds companies actively shrinking their share count: ROE above 15%, FCF yield above 4%, quality score of 3.0+, and, critically, EPS growth that is both positive and outpacing revenue growth. When per-share earnings grow faster than total revenue, the denominator is shrinking. Combined with high returns and strong cash flow, this signals management returning capital efficiently rather than empire-building.
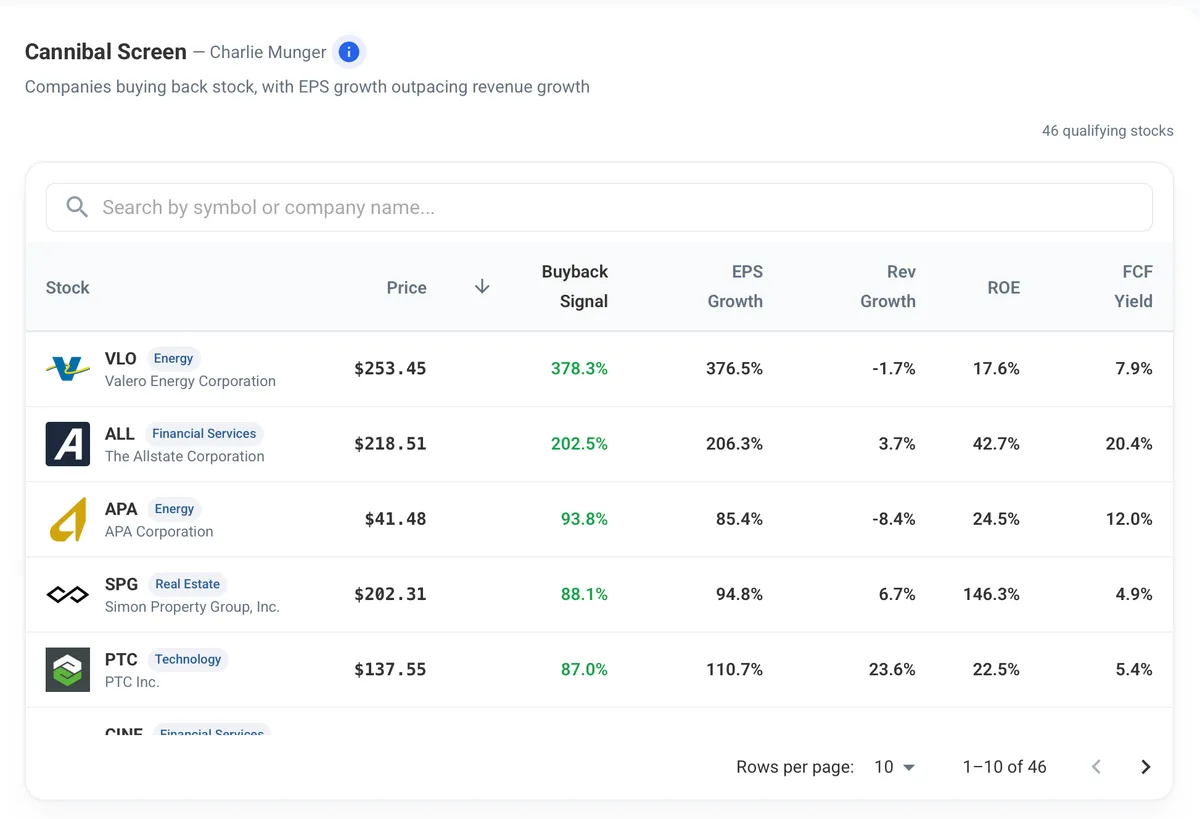
Figure 15: Share Buyback Signal. ROE 15%+, FCF yield 4%+, quality 3.0+, and EPS growth that is positive and outpacing revenue growth. The growth gap is the buyback signal.
Dividend Screens
Two screens focused on income investing, built to separate sustainable dividend payers from yield traps.
High Yield, Cash-Covered finds high-yield stocks where the payout screens as sustainable: yield of 2%+, payout ratio between 20-75%, free cash flow yield exceeding the dividend yield, and quality score of 3.0+. The FCF coverage requirement is the most important filter here. A company paying a 4% dividend yield needs to generate more than 4% in free cash flow yield to sustain it without borrowing or depleting reserves. The quality floor prevents yield-trap situations where a high yield simply reflects a collapsing stock price.
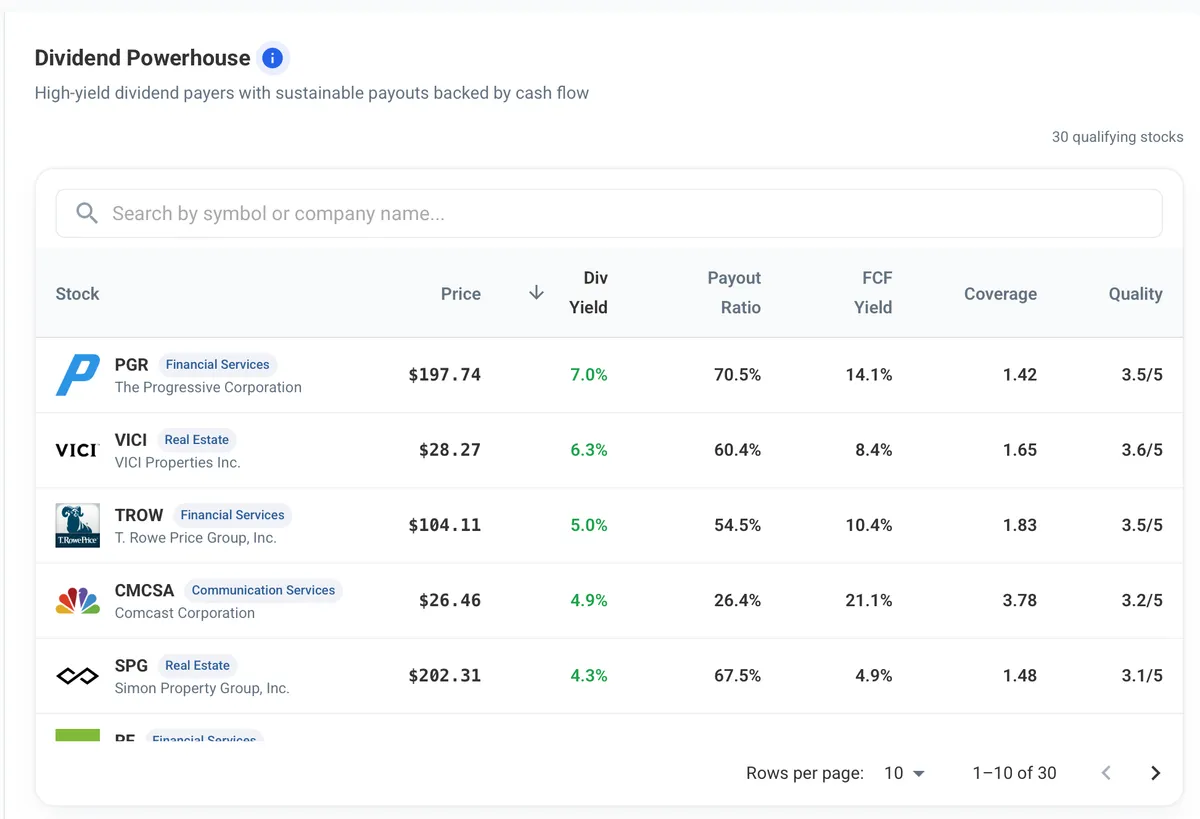
Figure 16: High Yield, Cash-Covered. Yield 2%+, payout ratio 20-75%, FCF yield exceeding dividend yield, quality 3.0+. The FCF coverage check is what separates sustainable yields from yield traps.
Dividend Growth takes a different angle: instead of maximizing current yield, it targets companies with the most room to increase their dividends. It requires an existing dividend (yield above 0.5%), a payout ratio below 50% (plenty of headroom), ROE above 15% (strong earnings power), revenue growth above 5% (expanding earnings base), and debt-to-equity below 0.8 (not borrowing to fund dividends). A low payout ratio plus high ROE means the company is retaining and reinvesting most of its earnings profitably. The dividend has a long runway to grow.
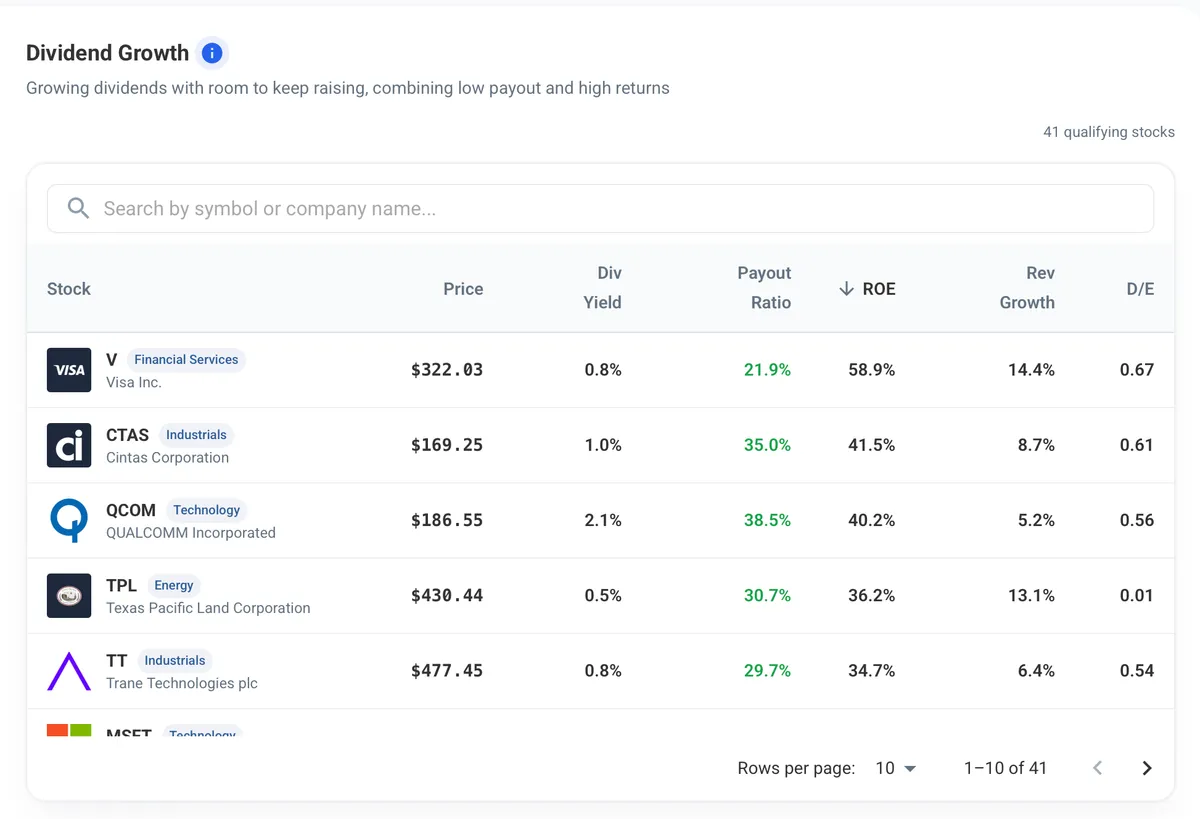
Figure 17: Dividend Growth. Existing dividend (yield 0.5%+), payout below 50%, ROE 15%+, revenue growth 5%+, debt-to-equity below 0.8. Built to find dividends with room to grow rather than maximum current yield.
Every Screen, One Click
All 17 preset screens are accessible from the Presets tab in our screener. Select a strategy, and qualifying stocks appear instantly in a sortable table with the most relevant metrics for that strategy displayed as columns.
Each screen includes an info tooltip explaining the strategy's significance, what the results mean, and what benchmark levels to look for. You can further narrow results by market index using the index chips above the results.
The screens are designed to be starting points, not final answers. Find an interesting stock through a preset screen, then dive into its full 5D analysis dashboard to understand the complete picture before making any investment decision.
This article is for educational purposes only and does not constitute investment advice. All screening strategies described are mechanical filters based on historical financial data and published investment methodologies. Past performance of any strategy does not guarantee future results. Always conduct your own research and consider consulting with financial professionals before making investment decisions.